


| Issue |
A&A
Volume 711, July 2026
|
|
|---|---|---|
| Article Number | L14 | |
| Number of page(s) | 4 | |
| Section | Letters to the Editor | |
| DOI | https://doi.org/10.1051/0004-6361/202661050 | |
| Published online | 23 July 2026 | |
Letter to the Editor
The relation between plasmoids and supra-arcade downflows in solar flares
1
Institute of Space Physics, Luoyang Normal University, Luoyang 471934, PR China
2
Yunnan Key Laboratory of the Solar physics and Space Science, Kunming 650216, PR China
3
Yunnan Observatories, Chinese Academy of Sciences, Kunming 650216, PR China
4
College of Physics & Electronic Information, Luoyang Normal University, Luoyang 471934, PR China
★ Corresponding author: This email address is being protected from spambots. You need JavaScript enabled to view it.
Received:
21
May
2026
Accepted:
9
July
2026
Abstract
Context. Plasmoids and supra-arcade downflows (SADs) are two important structures that facilitate the energy transformation and particle acceleration in regions above solar flare loop tops. The connection between them is unclear, however.
Aims. To determine the counterpart of plasmoids in a face-on perspective and the bridge between plasmoids and SADs, we investigated the thermal-dynamical behaviors of bubble-like SADs (BSADs) in a solar flare.
Methods. We used time-series images and the differential emission measure method to study the performance of BSADs observed on September 1, 2024. To explain these BSADs, we used synthetic face-on images created from the 3D magnetohydrodynamical simulations of solar eruptions.
Results. The sunward movement of BSADs caused the local plasma emission and density along the path to first decrease and then to recover partially. Collisions between BSADs and the upper side of the supra-arcade fan generated distinctive Y-shape plasma morphologies that are spatiotemporally correlated with the initiation of tadpole-like SADs. In simulations, the evolution of regions encircled by twisted tube-like plasmoids was similar to the evolution observed BSADs.
Conclusions. As an intermediary, BSADs not only reflect the dynamical behavior of plasmoids from the face-on perspective, but also perturb the region above flare loop tops to facilitate the formation of tadpole-like SADs. We propose decomposing the emission-depleted structures observed above flare loop tops into the high-altitude BSADs associated with 3D magnetic flux tubes and low-altitude tadpole-like SADs. These findings provide novel insights into energy dissipation processes and the correlations between magnetic structures in solar flares.
Key words: instabilities / magnetic reconnection / methods: numerical / methods: observational / Sun: flares
© The Authors 2026
 Open Access article, published by EDP Sciences, under the terms of the Creative Commons Attribution License (https://creativecommons.org/licenses/by/4.0), which permits unrestricted use, distribution, and reproduction in any medium, provided the original work is properly cited.
This article is published in open access under the Subscribe to Open model. This email address is being protected from spambots. You need JavaScript enabled to view it. to support open access publication.
1. Introduction
Multi-scale plasmoids formed by the tearing-mode instability in reconnection current sheets (RCSs) are not only direct products of the nonlinear evolution of magnetic reconnection, but also crucial carriers that link the large-scale energy release in solar eruptions to small-scale plasma heating and particle acceleration processes. They bidirectionally propagate from the reconnection site to the base of the coronal mass ejection bubble and the top of flare loop systems at speeds spanning tens to thousands of kilometers per second (e.g., Cheng et al. 2018; Patel et al. 2020). Statistical studies indicate that the width of plasmoids is governed by a power-law distribution (Patel et al. 2020) or a log-normal distribution (Guo et al. 2013). In edge-on imaging observations and 2D theoretical studies, plasmoids are characterized as hot and dense blob-like structures. In 3D studies, they exhibit twisted elongated tubular configurations (Mei et al. 2017), but they have only rarely been observed.
Supra-arcade downflows (SADs) are emission-depleted structures observed within hot supra-arcade fans (SAFs). Their temperatures are close to that of the surrounding plasma, but are higher than the background corona (Hanneman & Reeves 2014; French et al. 2025). Statistical studies showed that the width, speed, and lifetime of SADs follow a log-normal distribution (Xie et al. 2022). The temporal correlations between SAD occurrences, impulsive hard X-ray and radio bursts (Asai et al. 2004), and enhanced X-ray emissions from SAD-flare arcade collisions (Samanta et al. 2021) indicate that SADs contribute to the nonthermal energy redistribution. Thermal-energy calculations demonstrated that SADs induce adiabatic compression-driven heating feedback within the region above the flare loop tops (e.g., Reeves et al. 2017; Xie & Reeves 2023). The formation of SADs remains a highly controversial topic. Tan et al. (2023) suggested that a common mechanism likely governs the early-stage development of the SAD width and that the subsequent width evolution is strongly modulated by ambient plasma parameters, such as the magnetic field topology and the density scale heights.
Different to plasmoids primarily observed in an edge-on view, SADs are mainly recognized in a face-on view. Lin et al. (2015) briefly discussed the distinct nature of SADs and plasmoids based on their plasma properties and the observational perspective, concluding that they are not the same phenomenon. A more appropriate approach of evaluating their relation is from a face-on view because plasmoids in 2D models manifest as twisted flux tubes in 3D models.
We analyze bubble-like SADs (BSADs) observed in an M5.5 flare on September 1, 2024, and perform 3D magnetohydrodynamical simulations to explore the physical relation between BSADs, plasmoids, and tadpole-like SADs (TSADs). Section 2 presents the observational data and 3D numerical simulation setup. Section 3 details the evolution of BSADs in observations and the performance of tube-like plasmoids in simulations. Section 4 gives the discussions, followed by our conclusions in Section 5.
2. Data and method
2.1. Observation data
The event presented here was a GOES M5.5 flare that occurred at the east limb on September 1, 2024. The entire evolution of BSADs and TSADs was clearly observed by the hot 131 Å band of the Atmospheric Imaging Assembly (AIA; Lemen et al. 2012), and we therefore primarily used 131 Å images to analyze their performance. To quantitatively give the thermal information of plasma around BSADs from differential emission measure (DEM) method (Cheng et al. 2012), other AIA extreme-UV (EUV) bands including 94 Å, 171 Å, 193 Å, 211 Å, and 335 Å were also used. The uncertainties on the EM solutions were estimated with 200 Monte Carlo simulations. All of the AIA data were calibrated to level 1.5 using the standard procedure in the SolarSoftware (SSW; Freeland & Handy 1998).
2.2. Numerical simulation
To explore the nature of BSADs, we produced synthetic AIA 131 Å images based on the 3D numerical simulations of the flare that were identical to those of Ye et al. (2023). The normalization unit of the length was L0 = 5 × 10⁴ km, which created a physical length of 156.25 km/pixel. Thermal conduction and gravitational stratification were included in the simulations. The line-tied boundary condition was set at the bottom boundary z = 0, and the open conditions were used for the other five boundaries, allowing the plasma to freely enter or exit the simulation box (Ye et al. 2023). During the synthetic data procedure, the temperature response functions obtained from aia_get_response.pro were incorporated.
3. Result
3.1. BSAD behavior in observations
During the flare, plasma structures with a different topology appeared in the region above the solar limb (Fig. 1). Their height rose as the flare progressed. BSADs were located in regions over 100″ above the upper boundary of the SAF, where TSADs were present. As the flare evolved, these BSADs migrated toward the SAF, driving a morphological transition of the SAF from a featureless state to filamentary structures. Then, multiple TSADs were recognized at lower altitude (for details about their evolution, see the online animation).
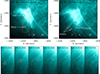 |
Fig. 1. Overview of the flare observations. (a-b) AIA 131 Å images of the flare at 13:12:32 UT and 13:56:32 UT, respectively. (c) Performances of a BSAD at different times in the region denoted by the box in panel (a). The ellipse indicates the body of the BSAD, and the dot-dashed curve in panel (c1) denotes the front of the BSAD. The dotted lines in panel (c7) mark the compressed plasma boundaries. The animation shows the sunward motion of BSADs. (The associated movie is available online.) |
Figure 1c shows the sunward motion of a sampled BSAD that consisted of a dark void and an elongated bright front, accompanied by a torsion of about 10°. The collision between the BSAD and the quasi-static environment generated a central intensity-depleted region flanked by radially elongated enhancements, which correspond to the inchoate TSADs.
Figure 2 shows the space-time map and the time-series DEM results of the sampled BSAD. As displayed in Fig. 2b, a Y-shape plasma morphology was produced along the line AB during the downward process of the BSAD. On the other hand, the downward trajectory of the BSAD along the line CD presents an evolutionary process of first a falling-down motion and then an oscillating motion (Fig. 2c). The apparent speed calculated from the change in distance over a short period clearly decreases, dropping from 544 km s−1 to 34 km s−1. The flowing speeds are consistent with that of plasmoids in EUV observations (Patel et al. 2020). Figure 2d shows the changes in the emission and EM results as the BSAD front traversed the sampling region. The emission and electron density derived from the DEM method both decrease strongly, followed by a partial increase. Their peaks correspond to the moment when the BSAD front was at the sampling position. This indicates the depletion of local plasma and its rapid recovery.
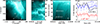 |
Fig. 2. Thermal-dynamical evolution of the sampled BSAD. (a) AIA 131 Å image at 13:12:56 UT. (b) Space-time map obtained along the dotted line AB. (c) Space-time map obtained along the dotted line CD. (d) Variation in T (blue line), EM (red line), and emission (black line) vs. time extracted from the red box in panel (a). The uncertainties on the velocities were estimated as the error in the length measurement, which was considered to be about 0.6 arcsec (about one pixel length of SDO/AIA). |
3.2. Performance of tube-like plasmoids in 3D simulations
To explain these observed BSADs, we display the evolution of downward tube-like plasmoids in a 3D and 2D frame integrated along the x-axis (Fig. 3). With the evolution progress, the tube-like plasmoids move downward and interact with the flare loop top. As shown in panels (c)-(f), multiple plasma structures composed of bright fronts that correspond to the projection of magnetic flux tubes and dark cavities that correspond to regions encircled by these twisted tubes can be identified in the face-on view. Their character is similar to that of the observed BSADs. Figure 3f4 presents the collision of the downward-propagating flux tube with the top of flare arcades, which caused the dark dip and bright spikes. The impact is remarkably consistent with the observational features displayed in Fig. 1.
 |
Fig. 3. Overview of the flare in numerical simulations. (a-b) Structures of the blobs shown by the current isosurface with value |J| = 50 colored by the velocity along the z-direction Vz at t = 0.96t0 and t = 0.98t0. (c)-(e) Evolution of the electron density (ne), temperature, and current density averaged along the LOS vs. time. (f) Corresponding synthetic AIA 131 Å images, calculated by subtracting the intensity from the previous image and dividing by the previous one. The arrows in panels (a) and (b) denote the analyzed structure, which corresponds to the structure of interest marked by ellipses. The dotted lines in panel (d4) mark the compressed plasma boundary. |
To further confirm the connection between BSADs and tube-like plasmoids, we created a space-time map of the synthetic AIA 131 Å images and the evolving curves of the AIA emission, electron density, and temperature (Fig. 4). The move of the tube-like plasmoid also created a Y-shape morphology (Fig. 4b). On the other hand, the trend of the intensity and density was to decrease and increase as the tube traversed the sampling white box (Fig. 4c). These results are consistent with those presented in Fig. 2 and establish a direct dynamics and morphological correspondence between the simulated tube-like plasmoids and the observed BSADs.
 |
Fig. 4. Evolution of the sampled tube-like plasmoid in numerical simulations. (a) Synthetic AIA 131 Å image at t = 0.94 t0. (b) Space-time map obtained along the dotted line AB. (c) Evolution of the AIA intensity, density, and temperature extracted at the fix box in panel a. |
4. Discussion
The face-on AIA 131 Å observations reveal that a large number of emission-depleted structures formed above the flare loop tops. Those in higher regions appeared to be elliptical, and those in lower regions exhibited a tadpole-like morphology (Fig. 1 and refers to the Fig. 3 in Xie et al. 2022). Previous works uniformly classified them as SADs (Innes et al. 2014; Xie et al. 2025), with explanations for their formation primarily centering on magnetic loop contraction and plasma instabilities (Savage et al. 2012; Innes et al. 2014; Shen et al. 2022). Some studies noted that the formation mechanisms of SADs are limited, such as by inconsistent plasma-refilling timescales (Cassak et al. 2013) and the lack of a correlation between SADs and SADLs (Innes et al. 2014).
Different to those works, we here propose a classification scheme according to the morphological difference with altitude, dividing these emission-depleted structures into elliptical BSADs formed at higher altitudes and tadpole-shaped SADs situated above the top of SAFs. Correspondingly, the formation mechanisms underlying these structures can be decoupled into distinct physical processes, that is, BSADs associated with twisted tube-like plasmoids, and TSADs attributed to magnetohydrodynamic instabilities (e.g., Innes et al. 2014; Shen et al. 2022). The topological decoupling naturally resolves discrepancies such as the different plasma refill timescales (Figures 2 and 4).
On the other hand, plasmoids, BSADs, and TSADs are distinctly vertically stratified from the reconnection site to the loop top in the magnetic reconnection framework from the spatial perspective. From a temporal standpoint, they appear sequentially from the impulsive phase to the decay phase. In terms of dynamical behavior, the velocity at which they propagate toward the solar surface gradually decreases relative to each other. Their temporal-spatial correlation might reflect different stages of magnetic energy release and plasma transformation. The stratification might highlight functional differences: plasmoid reconnection dominates the magnetic energy release in RCSs (Ye et al. 2023), BSADs mediate changes in magnetic topology, and TSADs document the kinetic or thermal energy dissipation in loop-top regions (Reeves et al. 2017; Ruan et al. 2023; Li et al. 2025). These structures collectively outline a system that progresses from magnetic energy conversion (plasmoids and magnetic flux tubes) to information transfer (BSADs) and to the energy dissipation (TSADs).
5. Conclusion
We investigated the thermal-dynamical behavior of BSADs observed in an M5.5 flare on September 1, 2024, and we also performed 3D numerical experiments of a solar eruption to synthetic AIA 131 Å images to explain these observed BSADs. The results of the simulations duplicated those of observations, including the appearance of BSADs in a face-on view and the spatial distribution and evolution of the plasma in the region above the top of flare loops. The observed emission and density curves and the Y-type plasma morphology together support a scenario in which BSADs correspond to regions surrounded by twisted tube-like plasmoids moving toward the flare loop tops. As an intermediary structure, BSADs connect the plasmoids observed in the edge-on perspective with the TSADs observed in the face-on perspective, providing a theoretical framework for understanding the completeness of energy conversion in solar flares.
Going forward, magnetic reconnection and turbulence have been identified in studies of stars and supernova remnants (Sironi et al. 2016; Ball et al. 2021). To explain the inner-ring knots in the Crab nebula, Cerutti & Giacinti (2021) conducted 3D particle-in-cell simulations, in which dense plasmoids and finger-like structures were shown from different perspective. We would like to point out that the bubble-like signals of plasmoids and the relation between plasmoids and SADs established in this work might be extended to these astrophysical contexts.
Data availability
Movie associated to Fig. 1 is available at https://www.aanda.org
Movie
Movie 1 associated with Fig. 2 Access Supplementary Material
Acknowledgments
This work was supported by grants from the National Scientific Foundation of China (NSFC 12203020, 12473059, 12573062, 42474211), the Yunnan Key Laboratory of Solar Physics and Space Science (202205AG070009), Project of Central Plains Science and Technology Innovation Leading Talents of Henan Province (244200510012), the Program for Innovative Research Team in University of Henan Province (25IRTSTHN014), the Key research and development program of Henan province (231111222200), Strategic Priority Research Program of the Chinese Academy of Sciences (XDB0560000), National Key R&D Program of China (2022YFF0503804), and the Yunnan Science Foundation of China (202301AT070347). We appreciate the team of SDO for the open data use policy.
References
- Asai, A., Yokoyama, T., Shimojo, M., & Shibata, K. 2004, ApJ, 605, L77 [Google Scholar]
- Ball, D., Özel, F., Christian, P., Chan, C.-K., & Psaltis, D. 2021, ApJ, 917, 8 [NASA ADS] [CrossRef] [Google Scholar]
- Cassak, P. A., Drake, J. F., Gosling, J. T., et al. 2013, ApJ, 775, L14 [Google Scholar]
- Cerutti, B., & Giacinti, G. 2021, A&A, 656, A91 [NASA ADS] [CrossRef] [EDP Sciences] [Google Scholar]
- Cheng, X., Zhang, J., Saar, S. H., & Ding, M. D. 2012, ApJ, 761, 62 [NASA ADS] [CrossRef] [Google Scholar]
- Cheng, X., Li, Y., Wan, L. F., et al. 2018, ApJ, 866, 64 [Google Scholar]
- Freeland, S. L., & Handy, B. N. 1998, Sol. Phys., 182, 497 [Google Scholar]
- French, R. J., Kazachenko, M. D., Mihailescu, T., & Reeves, K. K. 2025, ApJ, 986, L16 [Google Scholar]
- Guo, L. J., Bhattacharjee, A., & Huang, Y. M. 2013, ApJ, 771, L14 [Google Scholar]
- Hanneman, W. J., & Reeves, K. K. 2014, ApJ, 786, 95 [NASA ADS] [CrossRef] [Google Scholar]
- Innes, D. E., Guo, L. J., Bhattacharjee, A., Huang, Y. M., & Schmit, D. 2014, ApJ, 796, 27 [NASA ADS] [CrossRef] [Google Scholar]
- Lemen, J. R., Title, A. M., Akin, D. J., et al. 2012, Sol. Phys., 275, 17 [Google Scholar]
- Li, X., Shen, C., Xie, X., et al. 2025, ApJ, 991, 202 [Google Scholar]
- Lin, J., Murphy, N. A., Shen, C., et al. 2015, Space Sci. Rev., 194, 237 [NASA ADS] [CrossRef] [Google Scholar]
- Mei, Z. X., Keppens, R., Roussev, I. I., & Lin, J. 2017, A&A, 604, L7 [NASA ADS] [CrossRef] [EDP Sciences] [Google Scholar]
- Patel, R., Pant, V., Chandrashekhar, K., & Banerjee, D. 2020, A&A, 644, A158 [NASA ADS] [CrossRef] [EDP Sciences] [Google Scholar]
- Reeves, K. K., Freed, M. S., McKenzie, D. E., & Savage, S. L. 2017, ApJ, 836, 55 [NASA ADS] [CrossRef] [Google Scholar]
- Ruan, W., Yan, L., & Keppens, R. 2023, ApJ, 947, 67 [NASA ADS] [CrossRef] [Google Scholar]
- Samanta, T., Tian, H., Chen, B., et al. 2021, The Innovation, 2, 100083 [NASA ADS] [CrossRef] [Google Scholar]
- Savage, S. L., McKenzie, D. E., & Reeves, K. K. 2012, ApJ, 747, L40 [NASA ADS] [CrossRef] [Google Scholar]
- Shen, C., Chen, B., Reeves, K. K., et al. 2022, Nat. Astron., 6, 317 [NASA ADS] [CrossRef] [Google Scholar]
- Sironi, L., Giannios, D., & Petropoulou, M. 2016, MNRAS, 462, 48 [NASA ADS] [CrossRef] [Google Scholar]
- Tan, G., Hou, Y., & Tian, H. 2023, MNRAS, 522, 4468 [Google Scholar]
- Xie, X., & Reeves, K. K. 2023, ApJ, 942, 28 [Google Scholar]
- Xie, X., Reeves, K. K., Shen, C., & Ingram, J. D. 2022, ApJ, 933, 15 [Google Scholar]
- Xie, X., Shen, C., Reeves, K. K., et al. 2025, ApJ, 984, L27 [Google Scholar]
- Ye, J., Raymond, J. C., Mei, Z., et al. 2023, ApJ, 955, 88 [NASA ADS] [CrossRef] [Google Scholar]
All Figures
|
Fig. 1. Overview of the flare observations. (a-b) AIA 131 Å images of the flare at 13:12:32 UT and 13:56:32 UT, respectively. (c) Performances of a BSAD at different times in the region denoted by the box in panel (a). The ellipse indicates the body of the BSAD, and the dot-dashed curve in panel (c1) denotes the front of the BSAD. The dotted lines in panel (c7) mark the compressed plasma boundaries. The animation shows the sunward motion of BSADs. (The associated movie is available online.) |
| In the text | |
|
Fig. 2. Thermal-dynamical evolution of the sampled BSAD. (a) AIA 131 Å image at 13:12:56 UT. (b) Space-time map obtained along the dotted line AB. (c) Space-time map obtained along the dotted line CD. (d) Variation in T (blue line), EM (red line), and emission (black line) vs. time extracted from the red box in panel (a). The uncertainties on the velocities were estimated as the error in the length measurement, which was considered to be about 0.6 arcsec (about one pixel length of SDO/AIA). |
| In the text | |
|
Fig. 3. Overview of the flare in numerical simulations. (a-b) Structures of the blobs shown by the current isosurface with value |J| = 50 colored by the velocity along the z-direction Vz at t = 0.96t0 and t = 0.98t0. (c)-(e) Evolution of the electron density (ne), temperature, and current density averaged along the LOS vs. time. (f) Corresponding synthetic AIA 131 Å images, calculated by subtracting the intensity from the previous image and dividing by the previous one. The arrows in panels (a) and (b) denote the analyzed structure, which corresponds to the structure of interest marked by ellipses. The dotted lines in panel (d4) mark the compressed plasma boundary. |
| In the text | |
|
Fig. 4. Evolution of the sampled tube-like plasmoid in numerical simulations. (a) Synthetic AIA 131 Å image at t = 0.94 t0. (b) Space-time map obtained along the dotted line AB. (c) Evolution of the AIA intensity, density, and temperature extracted at the fix box in panel a. |
| In the text | |
Current usage metrics show cumulative count of Article Views (full-text article views including HTML views, PDF and ePub downloads, according to the available data) and Abstracts Views on Vision4Press platform.
Data correspond to usage on the plateform after 2015. The current usage metrics is available 48-96 hours after online publication and is updated daily on week days.
Initial download of the metrics may take a while.