


Fig. 1.
Download original image
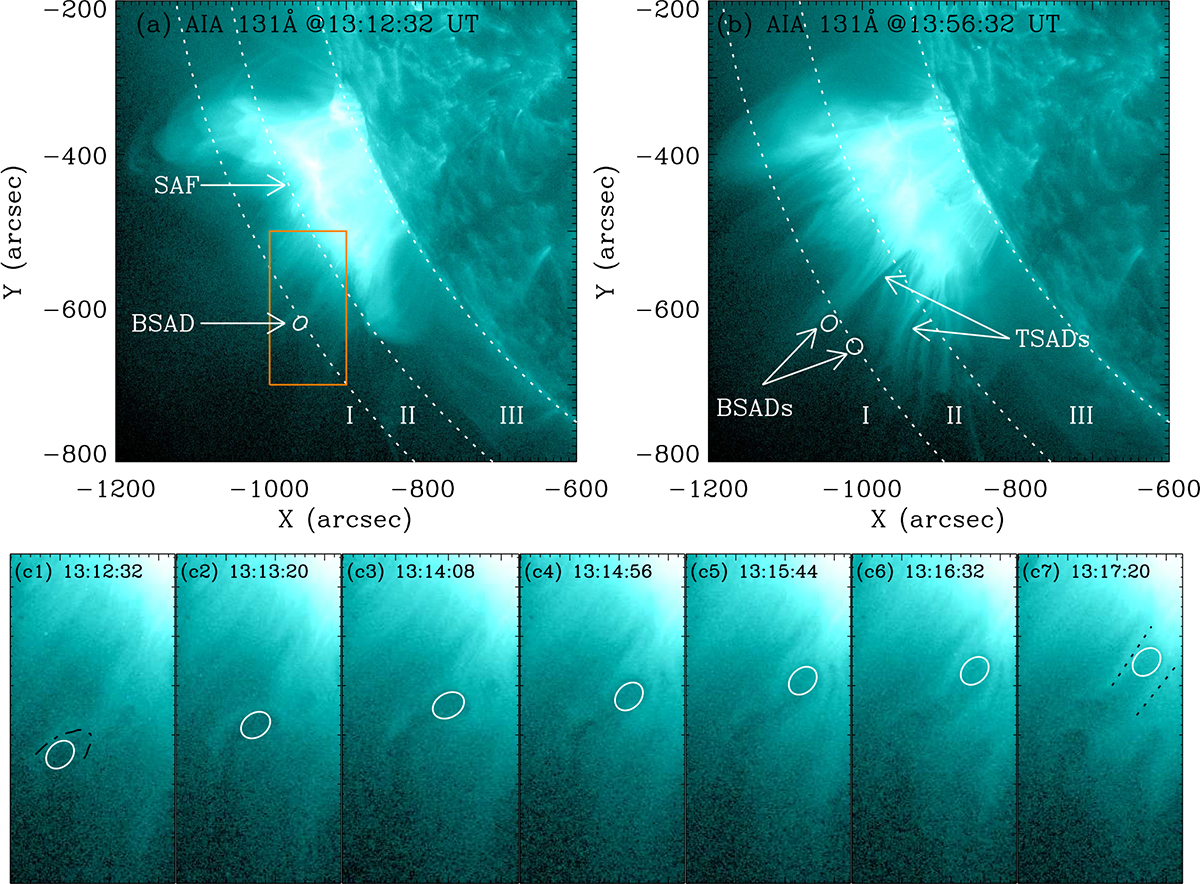
Overview of the flare observations. (a-b) AIA 131 Å images of the flare at 13:12:32 UT and 13:56:32 UT, respectively. (c) Performances of a BSAD at different times in the region denoted by the box in panel (a). The ellipse indicates the body of the BSAD, and the dot-dashed curve in panel (c1) denotes the front of the BSAD. The dotted lines in panel (c7) mark the compressed plasma boundaries. The animation shows the sunward motion of BSADs. (The associated movie is available online.)
Current usage metrics show cumulative count of Article Views (full-text article views including HTML views, PDF and ePub downloads, according to the available data) and Abstracts Views on Vision4Press platform.
Data correspond to usage on the plateform after 2015. The current usage metrics is available 48-96 hours after online publication and is updated daily on week days.
Initial download of the metrics may take a while.