


Fig. 2.
Download original image
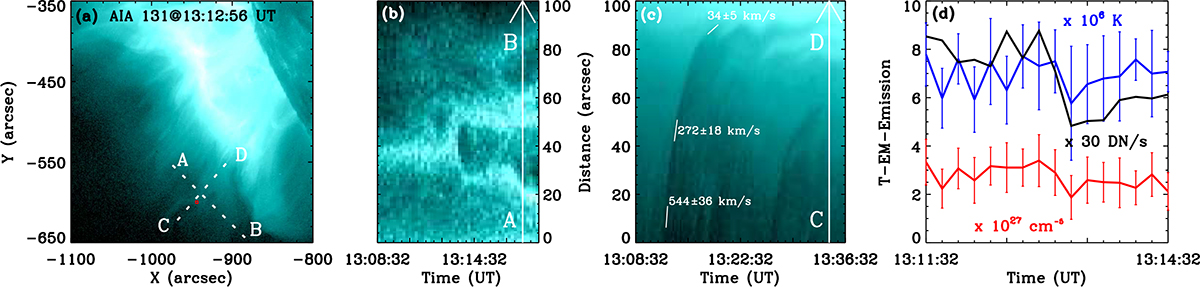
Thermal-dynamical evolution of the sampled BSAD. (a) AIA 131 Å image at 13:12:56 UT. (b) Space-time map obtained along the dotted line AB. (c) Space-time map obtained along the dotted line CD. (d) Variation in T (blue line), EM (red line), and emission (black line) vs. time extracted from the red box in panel (a). The uncertainties on the velocities were estimated as the error in the length measurement, which was considered to be about 0.6 arcsec (about one pixel length of SDO/AIA).
Current usage metrics show cumulative count of Article Views (full-text article views including HTML views, PDF and ePub downloads, according to the available data) and Abstracts Views on Vision4Press platform.
Data correspond to usage on the plateform after 2015. The current usage metrics is available 48-96 hours after online publication and is updated daily on week days.
Initial download of the metrics may take a while.