


| Issue |
A&A
Volume 711, July 2026
|
|
|---|---|---|
| Article Number | C1 | |
| Number of page(s) | 2 | |
| Section | Numerical methods and codes | |
| DOI | https://doi.org/10.1051/0004-6361/202661011e | |
| Published online | 02 July 2026 | |
AI application to artificial satellite identification in CHEOPS data
Scanning the CHEOPS image archive with a neural network (Corrigendum)
1
Safran,
171 Bd de Valmy,
92700
Colombes,
France
2
CFisUC, Departamento de Física, Universidade de Coimbra,
Coimbra
3004-516,
Portugal
3
Laboratory of Astrophysics, EPFL,
Chemin Pegasi 51,
1290
Versoix,
Switzerland
4
Observatoire Astronomique de l’Université de Genève,
Chemin Pegasi 51,
1290
Versoix,
Switzerland
5
European Space Agency (ESA), European Space Astronomy Centre (ESAC), Camino Bajo del Castillo s/n,
28692
Villanueva de la Cañada, Madrid,
Spain
★ Corresponding author: This email address is being protected from spambots. You need JavaScript enabled to view it.
Key words: methods: data analysis / astronomical databases: miscellaneous / errata, addenda
In the original publication, an error was identified in the conversion from instrumental counts to standard magnitude, mstandard. During the calibration process, an incorrect velocity unit was used to match the units of the CHEOPS field of view. This unit mismatch introduced a constant, systematic offset of approximately +8.89 (calculated as 2.5 log10(3600)) to all derived standard magnitude values. This offset affects the standard magnitude scale represented in Figures 9, 10, and 11, as well as the aggregate mean standard magnitude values quoted in the text. However, because this scaling offset applies uniformly to all detections, it does not alter any of the relative temporal comparisons or the underlying general statistics discussed throughout the paper.
Consequently, the scientific interpretation and the final conclusions of the study remain entirely unchanged. The specific corrections to the text are as follows:
In the abstract (results): the sentence originally stating “While our photometric analysis from 2020 to 2025 shows a constant average standard magnitude (13.4 ± 1.7) for the aggregate detection set...,” should now read “While our photometric analysis from 2020 to 2025 shows a constant average standard magnitude (4.5 ± 1.7) for the aggregate detection set...”
In Section 3.4 (brightness analysis): the sentence originally stating “We obtained a global mean value of 13.4 with a standard deviation of σ = 1.7...,” should now read “We obtained a global mean value of 4.5 with a standard deviation of σ = 1.7.”
In Section 4 (conclusions): the sentence originally stating “While the average standard magnitude of detections across the 2020–2025 period has remained relatively constant (13.4 ± 1.7)...,” should now read “While the average standard magnitude of detections across the 2020–2025 period has remained relatively constant (4.5 ± 1.7)...”
The corrected versions of Figures 9, 10, and 11, reflecting the updated standard magnitude scale on the x-axis (Figure 9) and y-axis (Figures 10 and 11), are provided below. Additionally, further acknowledgements for Luís Gonçalves have been added in this corrigendum.
Acknowledgements
LPG acknowledges support from FCT – Fundação para a Ciência e a Tecnologia, I.P., Portugal through grant 2024.00506.BDANA and from CFisUC UID/04564/2025 with DOI identifier 10.54499/UID/04564/2025.
© The Authors 2026
 Open Access article, published by EDP Sciences, under the terms of the Creative Commons Attribution License (https://creativecommons.org/licenses/by/4.0), which permits unrestricted use, distribution, and reproduction in any medium, provided the original work is properly cited.
This article is published in open access under the Subscribe to Open model. This email address is being protected from spambots. You need JavaScript enabled to view it. to support open access publication.
All Figures
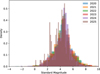 |
Fig. 9 Standard magnitude distribution of detected objects for each year of the CHEOPS database. |
| In the text | |
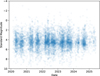 |
Fig. 10 Standard magnitude of detected objects over the years in the CHEOPS database. |
| In the text | |
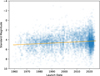 |
Fig. 11 Standard magnitude of the detected object versus the launch date of the object with a trend line showing an increasing brightness trend over time. |
| In the text | |
Current usage metrics show cumulative count of Article Views (full-text article views including HTML views, PDF and ePub downloads, according to the available data) and Abstracts Views on Vision4Press platform.
Data correspond to usage on the plateform after 2015. The current usage metrics is available 48-96 hours after online publication and is updated daily on week days.
Initial download of the metrics may take a while.