


| Issue |
A&A
Volume 711, July 2026
|
|
|---|---|---|
| Article Number | A294 | |
| Number of page(s) | 7 | |
| Section | Planets, planetary systems, and small bodies | |
| DOI | https://doi.org/10.1051/0004-6361/202660810 | |
| Published online | 23 July 2026 | |
An unidentified absorption feature at 5.11 μm on the surfaces of Titan and Pluto from JWST spectroscopy
1
LIRA, Observatoire de Paris, Université PSL, CNRS, Sorbonne Université, Université Paris Cité,
5 place Jules Janssen,
92195
Meudon,
France
2
Division of Geological and Planetary Sciences, California Institute of Technology,
Pasadena,
CA
91125,
USA
3
Jet Propulsion Laboratory, California Institute of Technology,
Pasadena,
CA
91109,
USA
4
Université Grenoble Alpes, CNRS, IPAG,
38041
Grenoble,
France
5
Solar System Exploration Division, NASA Goddard Space Flight Center,
Greenbelt,
MD
20771,
USA
6
School of Earth Sciences, University of Bristol,
Wills Memorial Building, Queens Road,
Bristol,
BS8 1RJ,
UK
7
LEATP, Campus Sciences Exactes et Naturelles – BP 1039, Université de Reims Champagne-Ardenne, CNRS,
51687
Reims,
France
8
Université Paris Cité, Institut de Physique du Globe de Paris (IPGP), CNRS,
75005
Paris,
France
9
CNRM, Météo-France, CNRS, Université de Toulouse,
Toulouse,
France
10
Department of Astronomy & Astrophysics, University of California,
San Diego, La Jolla,
CA
92093,
USA
11
Florida Space Institute, University of Central Florida,
Orlando,
FL
32826,
USA
12
Institut d’Astrophysique de Paris, Sorbonne Université, CNRS,
UMR7095,
Paris,
France
13
Space Telescope Science Institute,
Baltimore,
MD,
USA
14
Institute of Space Sciences and Technologies of Asturias (ICTEA), University of Oviedo,
33004
Oviedo,
Spain
15
Department of Physics, University of Oviedo,
33007
Oviedo,
Spain
★ Corresponding author: This email address is being protected from spambots. You need JavaScript enabled to view it.
Received:
6
May
2026
Accepted:
9
June
2026
Abstract
Context. Titan possesses a thick N2–CH4 atmosphere that makes its surface difficult to study spectroscopically. The chemical composition of Titan’s solid surface therefore remains highly uncertain.
Aims. By leveraging JWST’s high sensitivity and large spectral coverage, we searched for signatures from Titan’s surface in the broad and less explored 5 μm atmospheric window. We also investigated the JWST spectrum of Pluto, which has a thin Titan-like atmosphere.
Methods. We selected JWST NIRSpec and MIRI spectra around Titan’s disk center and compared the average NIRSpec spectrum with a radiative transfer model that includes gas and haze opacity.
Results. We detect an unidentified absorption in both the NIRSpec and MIRI spectra of Titan, centered at 5.113 μm (1956 cm−1) and 6–7% deep. The width of the feature is 0.024 ± 0.0008 μm (9.2 ± 0.3 cm−1) in the NIRSpec spectrum recorded on the trailing side and possibly 25% narrower in the MIRI spectrum of the leading side. This absorption most likely originates from the surface. We could not identify this signature among published laboratory spectra of ices relevant to Titan’s atmospheric compounds, but we present a few plausible candidates. A 4–5% deep absorption is also present in the MIRI spectrum of Pluto, but is about three times broader than on Titan’s trailing side.
Key words: planets and satellites: surfaces / Kuiper belt objects: individual: Pluto / planets and satellites: individual: Titan
© The Authors 2026
 Open Access article, published by EDP Sciences, under the terms of the Creative Commons Attribution License (https://creativecommons.org/licenses/by/4.0), which permits unrestricted use, distribution, and reproduction in any medium, provided the original work is properly cited.
This article is published in open access under the Subscribe to Open model. This email address is being protected from spambots. You need JavaScript enabled to view it. to support open access publication.
1 Introduction
Titan and Pluto possess N2-dominated atmospheres that contain significant amounts of CH4. In both bodies, intense photochemistry produces hydrocarbons and nitriles, which eventually leads to the formation of an ubiquitous organic haze (see, e.g., Vuitton et al. 2025; Summers et al. 2021). Titan and Pluto also exhibit complex climatic systems that redistribute volatile compounds (liquid CH4 on Titan; N2, CH4, and CO ices on Pluto) and shape their surface morphology. Despite these similarities, Titan and Pluto differ in various respects, most notably in their surface conditions: the ~1.5-bar surface pressure on Titan exceeds that on Pluto (currently around 10 μbar) by five orders of magnitude, while the temperature varies from 94 K on Titan to as low as 37.5 K for N2 ice on Pluto. Comparison of the chemical composition of the atmosphere, haze, and surface of both objects can thus provide valuable information on the chemical and physical processes at work in N2–CH4 cold atmospheres.
The New Horizons spacecraft, which flew by Pluto in July 2015, provided a detailed picture of the surface diversity, revealing a large basin, mountains, and active glaciers, with a specific geographic repartition of nonvolatile (water, ammonia) and volatile ices. These ices appear reddish-brown due to complex organic material. The mission also provided detailed information on the atmospheric gas composition and the distribution and optical properties of the haze. Stern et al. (2021) provide a detailed review of the New Horizons results. More recently, the high sensitivity of the James Webb Telescope (JWST) has enabled observations of Pluto in the previously unexplored mid-infrared range (Lellouch et al. 2025). Signatures of C2H6, C2H2, C2HD, CH3C2H, and C4H2 gases were detected, as well as fluorescence from CH4 and CH3D. The haze emission spectrum was also characterized and absorption bands from CH4, CH3D, and C2H4 ices at the surface were clearly detected.
The Cassini–Huygens mission explored the Saturn system between July 2004 and September 2017 and revealed that the surface of Titan presents a complex morphology, including fluvial landscapes, lakes, massive dune fields, mountains, and tectonic features (Nixon et al. 2026). Little is known, however, about the composition of the solid surface (Solomonidou et al. 2025) except for the data provided by the Huygens Gas Chromatograph Mass Spectrometer (GCMS), which detected methane and ethane vaporizing from the ground after landing (Niemann et al. 2010). The Huygens probe Descent Imager Spectral Radiometer (DISR) detected a broad surface absorption centered at 1.54 μm, which may be attributed to water ice, but this identification is not entirely conclusive (Tomasko et al. 2005). In the 0.8–5.4 μm near-infrared domain, solar radiation undergoes absorption by atmospheric methane bands, the N2–N2 collision-induced band centered at 4.3 μm, and the CO band centered at 4.7 μm. As a result, only a few narrow transparency windows (centered at 0.83, 0.94, 1.07, 1.28, 1.58, 2.0, 2.8, and 5.0 μm) provide access to the surface albedo spectrum (see Fig. 1 of Nixon et al. 2025). Even at these wavelengths, particularly below 3 μm, extinction by atmospheric haze particles significantly affects the surface signal. The surface albedo variations observed between these different windows point to compositional differences among these different geological units on Titan. They have often been interpreted as mixtures of different aerosol sediments and material exposed from the underlying crust (mostly water ice; Solomonidou et al. 2025). However, no well-defined signature of a chemical compound has yet been unambiguously detected in any of these windows, despite claims of exposed H2O ice (e.g., Griffith et al. 2003, 2019) and various hydrocarbon deposits (Clark et al. 2010; Singh et al. 2016). These tentative detections are based on analyses of data from the Visible and Infrared Mapping Spectrometer (VIMS) aboard Cassini, which are limited by its low spectral resolution and low sensitivity in the 5.0-μm window. More generally, studies of surface composition based on Cassini/VIMS data using radiative transfer and spectral mixing models are limited by the small number of atmospheric windows, the instrument’s low resolution, uncertainties regarding the opacity of atmospheric methane at visible and near-infrared wavelengths, and gaps in laboratory data. These limitations, taken together, lead to ambiguities and nonuniqueness in the composition retrievals (see, e.g., discussion in Solomonidou et al. 2024).
Nixon et al. (2025) recently presented observations of Titan with the Near Infrared Spectrograph (NIRSpec) and Mid Infrared Instrument (MIRI) aboard the JWST. The first analysis of these data focused on the atmosphere, including the detection of the methyl radical (CH3) and the analysis of fluorescence emission from CO and CO2.
In this paper we present the detection of a weak and narrow absorption at the surface of Titan, using JWST spectra in the atmospheric window from 4.9 to 5.4 μm, which is the broadest and least affected by haze extinction. We also report on the detection of an absorption feature in the JWST MIRI spectrum of Pluto (Lellouch et al. 2025), centered at the same wavelength but significantly wider than on Titan.
2 JWST observations
We obtained JWST NIRSpec observations of Titan as part of the Guaranteed Time Observation (GTO) project 1251 (Titan Climate, Composition and Clouds, PI Nixon). Titan was observed on 4 November 2022 across the full 0.95–5.27 μm range with a resolving power of 1500 to 3500, using the integral field unit (IFU) of NIRSpec (Jakobsen et al. 2022; Böker et al. 2023). Thus, full-range spectra were obtained over 30 × 30 imaging elements, each 0.1″ × 0.1″ in size. A four-point cycling dither was used for data acquisition. The total exposure time for the 2.87–5.27 μm spectral range (grating G395H), which is of specific interest here, was 902 s. The sub-observer latitude and longitude on Titan were 15.1°N and 261°W respectively, i.e., approximately centered on the trailing hemisphere of the satellite. Titan’s angular diameter was 0.73 arcsec.
We processed the NIRSpec data with version 1.19.1 of the JWST calibration pipeline (Bushouse et al. 2025), using the reference context map jwst_1468.pmap of the JWST Calibration Reference Data System (CRDS). We applied additional steps as described in Supplement B. 2 of Nixon et al. (2025).
Also part of the GTO 1251 project, JWST MIRI observations were conducted in spectral imaging mode using medium resolution spectroscopy (MRS; Wells et al. 2015; Argyriou et al. 2023) on 11 July 2023. The complete spectral range, 4.9–27.9 μm, was recorded with a resolving power of 1500 to 3500. For Channel 1A (4.90–5.74 μm), which we investigate here, the pixel size is 0.2″ × 0.2″ and the exposure time was set to 854 s. As for the NIRSpec observations, a four-point cycling dither was performed. The observations were targeted at Titan’s leading side, with center-of-disk coordinates of latitude 7.4°N and longitude 86°W. Titan’s angular diameter was 0.78 arcsec.
We reduced the MIRI data using version 1.20.2 of the JWST pipeline with the CRDS context jwst_1475.pmap. Compared with the standard pipeline, we changed the weighting from drizzle to EMSM to improve the baseline, and we changed the alignment from SKYALIGN to IFUALIGN to remove an interpolation and regridding step. We combined data from the four dither positions through the pipeline to produce a single datacube.
We geo-referenced the NIRSpec and MIRI data as described in Nixon et al. (2025), determining the (fractional) spaxel value of the center of Titan, recentering the cube, and computing the geometrical parameters for each spaxel. For MIRI, we noted that spaxels beyond 2″ from disk center, where no flux is expected, still presented nonzero radiances of unknown origin, slowly varying with wavelength, at the typical level of ±200 MJy sr−1. We subtracted this mean “background” signal, which is negative at 5.11 μm, from the cube; at disk center, this correction induces a decrease in the 5.11-μm band depth (discussed below) by 6% of its value.
We obtained more recent MIRI and NIRSpec observations of Titan (GTO project 2760, PI: Lunine), which will be presented in a forthcoming publication (Camarca et al., in prep). In particular, we obtained additional NIRSpec observations at four different sub-observer longitudes, permitting global mapping of the surface albedo spectrum in the 5 μm window. Although a preliminary map could be obtained from the single GTO 1251 NIRSpec observation presented here, we defer the inclusion of this map to the upcoming paper.
On 4 May 2023, we observed Pluto with JWST MIRI as part of the JWST GO-1 program 1658 (Pluto’s climate system with JWST, PI: Lellouch). We acquired observations in the MRS observing mode using a four-position dither over the full 4.9–27.9 μm spectral range. Lellouch et al. (2025) provide details of the acquisition settings. The sub-observer latitude and longitude range were 59.6°N and 353–332°E, respectively. Pluto’s angular size was 0.095 arcsec, which is less than the MIRI pixel size; therefore, the MRS spectrum represents an average across Pluto and its entire atmosphere. The data reduction process is described in Lellouch et al. (2025) and is not repeated here.
As in Nixon et al. (2025) and Lellouch et al. (2025), we converted the NIRSpec and MIRI intensities (expressed in MJy sr−1) into I/F reflectivities using the ACE-FTS (Atmospheric Chemistry Experiment – Fourier Transform Spectrometer) atlas of solar lines Hase et al. (2010) combined with the solar continuum of R.L. Kurucz1.
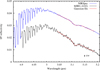 |
Fig. 1 NIRSpec (blue) and MIRI (black) average of nadir spectra of Titan in the 5 μm atmospheric window (see text for details). The MIRI spectrum is shifted downwards by 0.02 for clarity. Red lines represent Gaussian fits to the absorption feature present at 5.11 μm. The fitting function is the sum of a second-order polynomial (three free parameters) and a Gaussian function with three additional free parameters (position, amplitude, and width). The fitting interval is 5.04–5.19 μm. The ± 1σ error bar for the MIRI spectrum, based on the residuals of the fit, is indicated. The ±1σ error bar for the NIRSpec spectrum is also based on the residuals of the fit and is about ±0.00018 in I/F units. |
3 Results
3.1 Titan
Figure 1 shows NIRSpec and MIRI spectra averaged over the four dither positions and over the 3 × 3 (NIRSpec) and 2 × 2 (MIRI) centermost pixels. The 5 μm atmospheric window is limited at short wavelengths by the CO (1–0) fundamental band and at long wavelengths by the far wings of the ν4 and ν2 bands of CH4 (centered at 7.7 and 6.5 μm). Both spectra clearly show an absorption band centered near 5.11 μm. The Cassini/VIMS instrument only marginally covered the spectral region of this feature, with reduced sensitivity and spectral sampling near the detector cutoff, which prevents reliable detection. Since this feature is detected in both MIRI and NIRSpec spectra, we rule out an instrumental artifact. Furthermore, no absorption is detected in the NIRSpec spectra of Ganymede at 5.11 μm (Bockelée-Morvan et al. 2024).
The spectral range shown here exhibits lines of 13CO and C18O up to 5.0 μm (Fig. 2). Other weak absorption features are due to C2H6, visible between 4.90 and 5.06 μm, and the 2ν4+ν2 band of C2H2 at 5.154 μm. Fig. 2 shows a radiative transfer calculation using the atmospheric model described in Nixon et al. (2025). Molecular opacity from CH4, CH3D, CO, C2H6, C2H2, and C2H4 is included in this calculation. We used the haze vertical opacity profile and the phase functions derived by Doose et al. (2016) from in situ Huygens measurements. We assumed that the aerosol single-scattering albedo decreases linearly from 0.45 at 5.0 μm (as in Nixon et al. 2025) to 0.43 at 5.2 μm. We adjusted the surface albedo every 0.05 μm to best reproduce the NIRSpec spectrum and linearly interpolated between values. The resulting albedo decreases smoothly with wavelength from 0.060 at 4.88 μm to 0.024 at 5.2 μm. Our radiative transfer calculations indicate that, beyond 4.9 μm, surface reflection is the dominant source of emission, but haze scattering and thermal emission make a significant contribution (~18% at 5.1 μm). A comparison with the NIRSpec spectrum (blue line in Fig. 2) clearly shows that the 5.11-μm absorption feature mentioned above is not reproduced by the model, while very subtle atmospheric features, for example, at 5.00–5.05 μm and C2H2 at 5.154 μm, are.
This structureless feature, which is broader than that of a typical molecular Q-branch, does not resemble atmospheric absorption. It cannot be due to residual methane absorption, since this spectral region, located almost halfway between the CH4 dyad and pentad regions, contains only hot-band lines whose intensities are negligible at Titan’s temperatures. Furthermore, our methane linelist is based on variational calculations using ab initio potential and dipole-moment surfaces (Rey et al. 2018), which would not miss such a clear and localized absorption. Our model suffers from uncertainties in the methane far-wing lineshape, but this source of opacity, which varies slowly with wavelength, cannot produce such a narrow absorption. We also checked whether any molecule detected in Titan’s atmosphere exhibits an absorption band centered near 5.11 μm. The only candidate is the ν6 parallel band of propadiene (CH2=C=CH2), centered at 5.104 μm (Plíva & Martin 1982), but its double-hump structure, with prominent P- and R-branches and a very weak Q-branch, does not match the shape of the observed 5.11-μm absorption.
In addition, Fig. 3 shows that it does not behave like the weak CO absorption lines. In this figure, we compare the center-of-disk NIRSpec spectrum to the average spectrum of all 0.1″ × 0.1″ spatial pixels centered between 0.865 and 1.135 Titan radii from the disk center. While the CO line depths are similar in the two spectra, the depth of the 5.11-μm absorption, relative to the continuum, is reduced by about half. This strongly suggests that this absorption originates from the surface rather than from an atmospheric gas, since the surface contribution to the emitted flux decreases from the center to the limb, while that of the haze is enhanced. For the same reason, the 5.11-μm absorption does not originate in the main haze, as it would then be enhanced at the limb. In contrast, it could in principle be due to a thin condensate layer near the surface, beneath the bulk of the main haze. Nevertheless, a strong argument in favor of a surface origin of this feature is that it is observed on Pluto at a similar depth, where the atmosphere is optically much thinner.
Fitting the 5.11-μm feature in the NIRSpec and MIRI spectra with a Gaussian function superimposed on a second-degree polynomial over the range 5.04–5.19 μm (Fig. 1), we obtain the parameters given in Table 1 with their error bars (derived from the residuals of the fit). The NIRSpec data indicate that the band is centered at 5.1126 ± 0.0003 μm (1955.9 ± 0.1 cm−1) and has a full width at half maximum (FWHM) of 0.0241 ± 0.0008 μm (9.2 ± 0.3 cm−1). Although the MIRI data indicate a position that agrees within error bars, the derived FWHM is 25% smaller. The difference, which is significant at the 3-σ confidence level, could be real, given that the NIRSpec and MIRI instruments did not observe the same hemisphere. However, given the higher noise in the MIRI data, we prefer to await an analysis based on a more extended set of JWST data before drawing a conclusion. The equivalent width of the feature (i.e., its area, calculated as the integral of the Gaussian function) is the same within the error bars in the NIRSpec and MIRI data presented here (~0.0015 μm). As mentioned above, the surface signal is slightly diluted by the haze contribution, so that the actual surface absorption depth and equivalent width are ~20% larger.
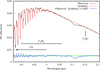 |
Fig. 2 Average Titan spectrum from NIRSpec (black) compared with a radiative transfer calculation in which the surface albedo decreases smoothly with wavelength beyond 4.9 μm (red). The blue line shows the difference between the observed and synthetic spectra, shifted by 0.005 for clarity. The 5.11-μm absorption feature is not reproduced by the model. The small mismatch below 4.93 μm is attributed to a non-LTE CO emission component not included in the model. |
Gaussian fits to the 5.11-μm absorption.
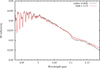 |
Fig. 3 Average NIRSpec spectra recorded at Titan’s disk center (black) compared with an average spectra recorded at the limb, with a field-of-view centered between 0.865 and 1.135 Titan radii from disk center (red). The limb selection is multiplied by a factor of 2.15 to facilitate comparison of relative absorption depths. The CO line-to-continuum ratios are similar in the two selections, while the 5.11-μm feature is about a factor of two weaker in the limb selection. As discussed in the text, this behavior suggests that this feature originates from the surface. |
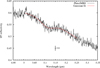 |
Fig. 4 Pluto MIRI spectrum in the 4.95–5.35 μm range (black). The red line represents a Gaussian fit to the absorption feature present at 5.11 μm, using data points from 5.005–5.255 μm. The ± 1σ error bar, based on the residuals of the fit, is indicated. |
3.2 Pluto
Figure 4 shows a portion of the MIRI spectrum of Pluto presented in Lellouch et al. (2025). The spectrum clearly shows a broad absorption centered at 5.1128 ± 0.0021 μm (Table 1), i.e., at the same position as in the Titan spectra within the error bars. In contrast, the FWHM derived from the Gaussian fit (0.069 ± 0.008 μm, i.e., 26 ± 3 cm−1), is approximately three times larger than that in Titan’s NIRSpec spectrum. The equivalent width (~0.0033 μm) is about twice that on Titan’s surface.
4 Discussion
The 5.0–5.2 μm range contains few medium-to-strong bands of organic compounds (Socrates 2001). We first checked that a 5.11-μm absorption peak does not appear in tholins produced in the laboratory by cold plasma discharge for any N2–CH4 mixture (Brassé et al. 2015; Mathé et al. 2018; Drant et al. 2026). We then searched the literature for possible signatures of ice formed from species detected in Titan’s atmosphere: Hudson et al. (2014b) for C2H6 and C2H4, Hudson et al. (2014a) and Abplanalp et al. (2019) for C2H2, Hudson et al. (2021) for C3H8, C3H6 and CH3C2H, Hudson & Yarnall (2022) for CH2CCH2, Schmitt et al. (2015) for C6H6, Moore et al. (2010) for HCN, C2N2, HC3N, CH3CN and C2H5CN, Dello Russo & Khanna (1996) for C2H3CN and C4N2, and Bouilloud et al. (2015) for H2O, CO2 and CH4. We did not find any band referenced in these publications that corresponds to the location of the observed absorption in Titan and Pluto. However, a signature may shift if the compound is mixed with other species. In the following, we examine three plausible candidates that exhibit an absorption band close to 5.113 μm (1956 cm−1).
The closest match is the weak ν2 acetylene (C2H2) band around 1961 cm−1 (5.099 μm; Abplanalp et al. 2019; Hudson et al.2). This absorption is also seen in reflectance spectra of pure acetylene at ~80 K, ground to a fine powder (Clark et al. 2010). However, this spectrum also shows a stronger band centered at 4.83 μm causing a sharp drop in reflectance below 5.0 μm, at odds with the surface-albedo variation required in the model to reproduce the I/F NIRSpec spectrum (see above). Despite this possible inconsistency, we provisionally retain C2H2 ice as a potential candidate. Unpublished measurements made at IPAG (Institut de Planétologie et d’Astrophysique de Grenoble) show that the signature of C2H2 ice diluted in N2 at a 1% concentration shifts slightly toward longer wavenumbers with respect to pure crystalline C2H2 (1964.2 versus 1961.8 cm−1, respectively), thus in the wrong direction. Since the effect of a polar matrix has not yet been tested, it is unclear whether this could shift the C2H2 ice signature by approximately −6 cm−1 to the position of the feature observed by the JWST (1956 cm−1).
Experiments attempting to identify chemical alteration of ice mixtures due to cosmic rays demonstrate that irradiated H2O:CH4 ices lead to the formation of C2H2 with a spectral signature consistent with the observed feature at 1955 cm−1 (Mejía et al. 2020). However, the approximately ten times stronger C2H2 ice band at 750 cm−1 is not detected in the MIRI spectrum of Pluto (Lellouch et al. 2025), providing no further support for this candidate on Pluto. We discuss the comparative effects of radiation on the two bodies below.
The solid state benzene molecule exhibits a weak spectral signature near 5.11 μm assigned to the ν7 + ν19 vibrational mode (Nna-Mvondo & Anderson 2022). In the case of the pure crystalline phase at 130 K, this band shows two components at 1976 and 1981 cm−1 (5.061 and 5.048 μm; Brown & Person 1978; Schmitt et al. 2015). In the amorphous or glassy phase (formed and measured at 15 K), the band displays a single component at 1966 cm−1 (5.086 μm; Brown & Person 1978; Nna-Mvondo & Anderson 2022). The width of this band is approximately 13 cm−1 in the crystalline phase. In this spectral region, the ν11 + ν19 mode is present at ~1835 cm−1 (5.45 μm) with a similar intensity, but is difficult to detect in Titan as it lies at the very edge of the atmospheric window. It is not detected on Pluto, and in this case an assignment of the 5.11-μm absorption to C6H6 can be ruled out. The FWHM of the 5.11-μm band on Titan is 7–9 cm−1, which is narrower than the experimental values mentioned above. Overall, the presence of pure benzene appears to be precluded, but this does not rule out the presence of benzene mixed with other molecular species. Comparison of the measurements by Brown & Person (1978) with previous studies shows that the ν7 + ν19 mode exhibits a significant shift in position depending on its molecular environment: 1955, 1960, 1981, and 1972 cm−1 in Ar, N2, HCl, and Br2 matrices, respectively. Data are not available to assess the corresponding FWHMs. In conclusion, benzene mixed with other molecular species remains a possible candidate for Titan, but we cannot draw a definitive conclusion without additional laboratory experiments.
The group of allenes (organic compounds that include a C=C=C pattern) show a C=C=C out-of-phase stretching vibration mode in the 1900–2000 cm−1 range (Lin-Vien et al. 1991). This group is essentially the only group among organic compounds that exhibits strong absorption bands in this range (Socrates 2001). The exact position depends on the nature of the molecular groups attached to either end of the carbon chain. The simplest allene, propadiene, detected in Titan’s atmosphere (Lombardo et al. 2019), exhibits strong signatures at 1947.3 and 1948 cm−1 (5.135) and 5.133 μm) for the crystalline (80 K) and amorphous (8 K) phases, respectively (Hudson & Yarnall 2022). At first glance, this compound appears to be a plausible candidate because it shows only one strong feature in the 5.0–5.2 μm range, and its width of 5.2 cm−1 is smaller than that of the observed 5.11-μm (1956 cm−1) feature. The broadening could then be interpreted as the result of physical effects such as grain size. Nevertheless, the spectral shift of ~10 cm−1 indicates that pure propadiene is not a good candidate. Systematic laboratory measurements are necessary to investigate the role of chain length, cross-linking, and branching species on the width, shape, and position of the allene bands.
Two candidates with weak features around 5.113 μm should also be mentioned. The first is ketene (CH2C=O), which, in the solid state, exhibits a weak spectral signature (2ν6) at 1942 and 1947 cm−1 (5.149 and 5.136 μm) in the pure phase and when isolated in an argon matrix, respectively (Moore & Pimentel 1963). This feature is accompanied by a much more intense band at ~2080 cm−1 (4.81 μm) usually assigned to out-of-phase stretching modes. The peak positions, 1942 and 1947 cm−1, are close to 1956 cm−1; however, no studies provide a systematic analysis of the parameters controlling the position and width of this feature, and no further conclusions can be drawn. Regarding the second candidate, (Quirico et al. 2023) identify a weak band at 1957 cm−1 (5.110 μm) in the irradiation residue of methanol ice. This band may be attributed either to an allene-type compound or to a C=C=O-type functional group. A radiolytic origin appears unlikely for Titan, but remains plausible for Pluto.
In addition, HCN deserves consideration because hydrogen bonds may, a priori, induce substantial shifts of the band frequencies when the molecule is diluted in another ice. The HCN exhibits a band (ν3) at 4.76 μm (2100 cm−1), which is primarily controlled by the CN stretch. The peak position of this band varies between 2100 and 2100.5 cm−1 over the temperature range 25–120 K for the type I tetragonal crystalline phase and 50–110 K for the amorphous phase. (Dello Russo & Khanna 1996; Moore et al. 2010). These values are close to those of the molecule in the gas phase or isolated in an Ar matrix, indicating that the hydrogen bond that links H and N atoms is too weak to induce a significant spectral shift (Müller et al. 1993). Experiments conducted on HCN diluted in a variety of polar and apolar matrices show peak positions in the range of 2100.3–2063.5 cm−1, which are too far from the position of the 5.11-μm band (Ozhiganov et al. 2024); therefore, we do not consider HCN to be a candidate for the 5.11-μm absorption.
A significant finding of our study is that the width of the 5.11-μm feature is approximately three times larger on Pluto than on Titan. If the same molecular species is responsible for this signature on both bodies, several mechanisms can be considered to explain the larger width observed on Pluto. First, grain size affects band depth, as this parameter primarily controls the optical path length. Saturated bands exhibit more pronounced broadening effects because their wings are considerably amplified. However, the 5.11-μm absorption has low intensity, its Gaussian profile is not consistent with spectral saturation, and such effects are not expected. Similarly, macroscopic mixing regimes (intimate versus areal) do not lead to pronounced broadening effects.
Pluto’s surface temperature (30–60 K) is lower than that of Titan (90–95 K). In the case of ices, the general trend is for bands to broaden as temperature increases, which is inconsistent with the observations. A more likely mechanism is related to the physical state of the molecular species involved, more specifically, to the diversity of its environment at the molecular scale. Concentration-dependent effects may arise when molecular clusters of different sizes form (Quirico & Schmitt 1997; Behringer 1958). Single, double, triple, and larger clusters each exhibit absorption bands with slightly different positions and widths, resulting in broadening of the overall spectral feature. In the case of organic compounds such as the allenes mentioned earlier, the nature of the chemical groups R1 and R2 attached to the terminal carbon atoms of the C=C=C moiety strongly influences the position and width of the absorption band. Consequently, a complex mixture of organic molecules that exhibit a wide diversity of R1 and R2 groups may generate substantial broadening.
The surfaces of Titan and Pluto are exposed to energetic particles for periods long enough to trigger radiolytic and chemical processes. In the case of Titan, the charged particles are primarily secondary electrons produced during interactions with galactic cosmic rays (GCRs) near 65 km (Gronoff et al. 2011), whereas Pluto’s surface is irradiated by GCR ions spanning a broad range of energies. Since Pluto’s atmosphere is thinner, a fraction of the GCR penetrates the surface to a depth ranging from several centimeters to several tens of centimeters. The effects of irradiation are manifold: radiolysis (breaking of chemical bonds), sputtering (e.g., H2), formation of new species through radical recombination, and structural transformation (e.g., amorphization). All of these processes can lead to diversification of the molecular environment, broadening of a spectral signature, and changes in its spectral shape. The low-energy population of GCR ions (except hydrogen) has substantial nuclear stopping power and is more effective at destabilizing carbonaceous compounds (Faure et al. 2021). However, these processes depend on both the molecular species and the environment in which they are likely to interact.
5 Conclusions
We report the detection of an unidentified absorption feature in the JWST spectra of Titan’s trailing and leading sides and of Pluto. This absorption is centered at 5.113 μm (1956 cm−1) and very likely originates from the surface of both bodies. Its width is about three times larger on Pluto than on Titan’s trailing side. On Titan, it is possibly narrower on the leading hemisphere than on the trailing hemisphere. We searched the literature for possible simple ice and organic candidates and find that only a few of them are plausible: the group of allenes and, if mixed with other species, benzene, ketene, or less likely, acetylene (on Titan). The difference in the width of the feature between the two bodies is most likely due to the physical state of the unknown compound at the molecular scale.
In the near future, mapping this absorption feature over Titan’s disk with a more complete JWST dataset may constrain its nature and origin. Dragonfly, the next mission to Titan scheduled to arrive in the mid-2030s, will conduct in situ studies of the surface composition and chemical complexity at various geological sites. In particular, the Dragonfly Mass Spectrometer (DraMS) should be able to identify some of the potential candidates for the 5.11-μm absorption, although the relatively volatile acetylene may not be retained during analysis (M. Trainer, pers. comm., 2026). However, the lack of onboard infrared spectroscopy capabilities prevents any direct observation of the spectral feature itself in surface materials.
Acknowledgements
This work is based on observations made with the NASA/ESA/CSA James Webb Space Telescope. The data were obtained from the Mikulski Archive for Space Telescopes at the Space Telescope Science Institute, which is operated by the Association of Universities for Research in Astronomy, Inc., under NASA contract NAS 5-03127 for JWST. These observations are associated with programs 1251 and 1658. BB, EL and SR acknowledge support from the Programme National de Planétologie (PNP) of CNRS-INSU co-funded by CNES. SR further acknowledges support from CNES and the Agence Nationale de la Recherche (ANR) through the project RaD3-net (ANR-21-CE49-0020). Part of this work was carried out at the Jet Propulsion Laboratory, California Institute of Technology, under a contract with the National Aeronautics and Space Administration. MC acknowledges support from the Caltech Discovery Fund. CAN received support for the work from NASA GSFC Strategic Science Fund. NT is supported by UK Science and Technology Facilities Council grant ST/Y000676/1. N.P.-A. acknowledges the Ministry of Science, Innovation, and Universities (MCIU) in Spain and the State Agency for Research (AEI) for funding through the ATRAE programme, project ATR2023-145683. BB thanks S. Vinatier for helpful discussions.
References
- Abplanalp, M. J., Frigge, R., & Kaiser, R. I. 2019, Sci. Adv., 5, eaaw5841 [NASA ADS] [CrossRef] [Google Scholar]
- Argyriou, I., Glasse, A., Law, D. R., et al. 2023, A&A, 675, A111 [NASA ADS] [CrossRef] [EDP Sciences] [Google Scholar]
- Behringer, R. E. 1958, J. Chem. Phys., 29, 537 [Google Scholar]
- Bockelée-Morvan, D., Lellouch, E., Poch, O., et al. 2024, A&A, 681, A27 [NASA ADS] [CrossRef] [EDP Sciences] [Google Scholar]
- Böker, T., Beck, T. L., Birkmann, S. M., et al. 2023, PASP, 135, 038001 [CrossRef] [Google Scholar]
- Bouilloud, M., Fray, N., Bénilan, Y., et al. 2015, MNRAS, 451, 2145 [Google Scholar]
- Brassé, C., Muñoz, O., Coll, P., & Raulin, F. 2015, Planet. Space Sci., 109, 159 [CrossRef] [Google Scholar]
- Brown, K. G., & Person, W. B. 1978, Spectrochim. Acta Part A: Mol. Spectrosc., 34, 117 [Google Scholar]
- Bushouse, H., Eisenhamer, J., Dencheva, N., et al. 2025, JWST Calibration Pipeline [Google Scholar]
- Clark, R. N., Curchin, J. M., Barnes, J. W., et al. 2010, J. Geophys. Res. (Planets), 115, E10005 [Google Scholar]
- Dello Russo, N., & Khanna, R. K. 1996, Icarus, 123, 366 [NASA ADS] [CrossRef] [Google Scholar]
- Doose, L. R., Karkoschka, E., Tomasko, M. G., & Anderson, C. M. 2016, Icarus, 270, 355 [NASA ADS] [CrossRef] [Google Scholar]
- Drant, T., Sciamma-O’Brien, E., Jovanovic, L., et al. 2026, A&A, 706, A167 [NASA ADS] [CrossRef] [EDP Sciences] [Google Scholar]
- Faure, M., Quirico, E., Faure, A., et al. 2021, Icarus, 364, 114462 [Google Scholar]
- Griffith, C. A., Owen, T., Geballe, T. R., Rayner, J., & Rannou, P. 2003, Science, 300, 628 [Google Scholar]
- Griffith, C. A., Penteado, P. F., Turner, J. D., et al. 2019, Nat. Astron., 3, 642 [Google Scholar]
- Gronoff, G., Mertens, C., Lilensten, J., et al. 2011, A&A, 529, A143 [NASA ADS] [CrossRef] [EDP Sciences] [Google Scholar]
- Hase, F., Wallace, L., McLeod, S. D., Harrison, J. J., & Bernath, P. F. 2010, J. Quant. Spec. Radiat. Transf., 111, 521 [NASA ADS] [CrossRef] [Google Scholar]
- Hudson, R. L., & Yarnall, Y. Y. 2022, ACS Earth Space Chem., 6, 1163 [NASA ADS] [CrossRef] [Google Scholar]
- Hudson, R. L., Ferrante, R. F., & Moore, M. H. 2014a, Icarus, 228, 276 [NASA ADS] [CrossRef] [Google Scholar]
- Hudson, R. L., Gerakines, P. A., & Moore, M. H. 2014b, Icarus, 243, 148 [NASA ADS] [CrossRef] [Google Scholar]
- Hudson, R. L., Gerakines, P. A., Yarnall, Y. Y., & Coones, R. T. 2021, Icarus, 354, 114033 [NASA ADS] [CrossRef] [Google Scholar]
- Jakobsen, P., Ferruit, P., Alves de Oliveira, C., et al. 2022, A&A, 661, A80 [NASA ADS] [CrossRef] [EDP Sciences] [Google Scholar]
- Lellouch, E., Wong, I., Lavvas, P., et al. 2025, A&A, 696, A147 [NASA ADS] [CrossRef] [EDP Sciences] [Google Scholar]
- Lin-Vien, D., Colthup, N. B., Fateley, W. G., & Grasselli, J. G. 1991, in The Handbook of Infrared and Raman Characteristic Frequencies of Organic Molecules, eds. D. Lin-Vien, N. B. Colthup, W. G. Fateley, & J. G. Grasselli (San Diego: Academic Press), 277 [Google Scholar]
- Lombardo, N. A., Nixon, C. A., Greathouse, T. K., et al. 2019, ApJ, 881, L33 [Google Scholar]
- Mathé, C., Gautier, T., Trainer, M. G., & Carrasco, N. 2018, ApJ, 861, L25 [Google Scholar]
- Mejía, C., de Barros, A. L. F., Rothard, H., Boduch, P., & da Silveira, E. F. 2020, ApJ, 894, 132 [CrossRef] [Google Scholar]
- Moore, C. B., & Pimentel, G. C. 1963, J. Chem. Phys., 38, 2816 [Google Scholar]
- Moore, M. H., Ferrante, R. F., Moore, W. J., & Hudson, R. 2010, ApJS, 191, 96 [NASA ADS] [CrossRef] [Google Scholar]
- Müller, B., Lutz, H. D., Hermeling, J., & Knözinger, E. 1993, Spectrochim. Acta Part A: Mol. Spectrosc., 49, 191 [Google Scholar]
- Niemann, H. B., Atreya, S. K., Demick, J. E., et al. 2010, J. Geophys. Res. (Planets), 115, E12006 [CrossRef] [Google Scholar]
- Nixon, C. A., Bézard, B., Cornet, T., et al. 2025, Nat. Astron., 9, 969 [Google Scholar]
- Nixon, C. A., Birch, S., Chatain, A., et al. 2026, Rev. Geophys., 64, e2025RG000909 [Google Scholar]
- Nna-Mvondo, D., & Anderson, C. M. 2022, ApJ, 925, 123 [NASA ADS] [CrossRef] [Google Scholar]
- Ozhiganov, M., Medvedev, M., Karteyeva, V., et al. 2024, ApJ, 972, L10 [Google Scholar]
- Plíva, J., & Martin, C. A. 1982, J. Mol. Spectrosc., 91, 218 [Google Scholar]
- Quirico, E., & Schmitt, B. 1997, Icarus, 127, 354 [NASA ADS] [CrossRef] [Google Scholar]
- Quirico, E., Bacmann, A., Wolters, C., et al. 2023, Icarus, 394, 115396 [NASA ADS] [CrossRef] [Google Scholar]
- Rey, M., Nikitin, A. V., Bézard, B., et al. 2018, Icarus, 303, 114 [Google Scholar]
- Schmitt, B., Vinatier, S., & Bernard, J.-M. 2015, Mid-IR transmission and optical constants spectra of crystalline C6H6 at 130 K, https://doi.org/10.26302/SSHADE/EXPERIMENT_BS_20170830_001 [Google Scholar]
- Singh, S., McCord, T. B., Combe, J.-P., et al. 2016, ApJ, 828, 55 [Google Scholar]
- Socrates, G. 2001, Infrared and Raman Characteristic Group Frequencies: Table and Charts (Wiley & Sons) [Google Scholar]
- Solomonidou, A., Malaska, M. J., Lopes, R. M. C., et al. 2024, Icarus, 421, 116215 [Google Scholar]
- Solomonidou, A., Le Gall, A., Hayne, P., & Coustenis, A. 2025, in Titan After Cassini-Huygens, ed. R. M. Lopes, C. Elachi, I. C. Müeller-Wodarg, & A. Solomonidou, COSPAR Series (Elsevier), 325 [Google Scholar]
- Stern, S. A., Moore, J. M., Grundy, W. M., Young, L. A., & Binzel, R. P. 2021, The Pluto System After New Horizons (University of Arizona Press) [Google Scholar]
- Summers, M. E., Young, L. A., Gladstone, G. R., & Person, M. J. 2021, in The Pluto System After New Horizons, eds. S. A. Stern, J. M. Moore, W. M. Grundy, L. A. Young, & R. P. Binzel (University of Arizona Press), 257 [Google Scholar]
- Tomasko, M. G., Archinal, B., Becker, T., et al. 2005, Nature, 438, 765 [NASA ADS] [CrossRef] [Google Scholar]
- Vuitton, V., Lavvas, P., Nixon, C. A., & Teanby, N. A. 2025, in Titan After Cassini-Huygens, eds. R. M. Lopes, C. Elachi, I. C. Müeller-Wodarg, & A. Solomonidou, COSPAR Series (Elsevier), 157 [Google Scholar]
- Wells, M., Pel, J.-W., Glasse, A., et al. 2015, PASP, 127, 646 [NASA ADS] [CrossRef] [Google Scholar]
All Tables
All Figures
|
Fig. 1 NIRSpec (blue) and MIRI (black) average of nadir spectra of Titan in the 5 μm atmospheric window (see text for details). The MIRI spectrum is shifted downwards by 0.02 for clarity. Red lines represent Gaussian fits to the absorption feature present at 5.11 μm. The fitting function is the sum of a second-order polynomial (three free parameters) and a Gaussian function with three additional free parameters (position, amplitude, and width). The fitting interval is 5.04–5.19 μm. The ± 1σ error bar for the MIRI spectrum, based on the residuals of the fit, is indicated. The ±1σ error bar for the NIRSpec spectrum is also based on the residuals of the fit and is about ±0.00018 in I/F units. |
| In the text | |
|
Fig. 2 Average Titan spectrum from NIRSpec (black) compared with a radiative transfer calculation in which the surface albedo decreases smoothly with wavelength beyond 4.9 μm (red). The blue line shows the difference between the observed and synthetic spectra, shifted by 0.005 for clarity. The 5.11-μm absorption feature is not reproduced by the model. The small mismatch below 4.93 μm is attributed to a non-LTE CO emission component not included in the model. |
| In the text | |
|
Fig. 3 Average NIRSpec spectra recorded at Titan’s disk center (black) compared with an average spectra recorded at the limb, with a field-of-view centered between 0.865 and 1.135 Titan radii from disk center (red). The limb selection is multiplied by a factor of 2.15 to facilitate comparison of relative absorption depths. The CO line-to-continuum ratios are similar in the two selections, while the 5.11-μm feature is about a factor of two weaker in the limb selection. As discussed in the text, this behavior suggests that this feature originates from the surface. |
| In the text | |
|
Fig. 4 Pluto MIRI spectrum in the 4.95–5.35 μm range (black). The red line represents a Gaussian fit to the absorption feature present at 5.11 μm, using data points from 5.005–5.255 μm. The ± 1σ error bar, based on the residuals of the fit, is indicated. |
| In the text | |
Current usage metrics show cumulative count of Article Views (full-text article views including HTML views, PDF and ePub downloads, according to the available data) and Abstracts Views on Vision4Press platform.
Data correspond to usage on the plateform after 2015. The current usage metrics is available 48-96 hours after online publication and is updated daily on week days.
Initial download of the metrics may take a while.