


Fig. 1
Download original image
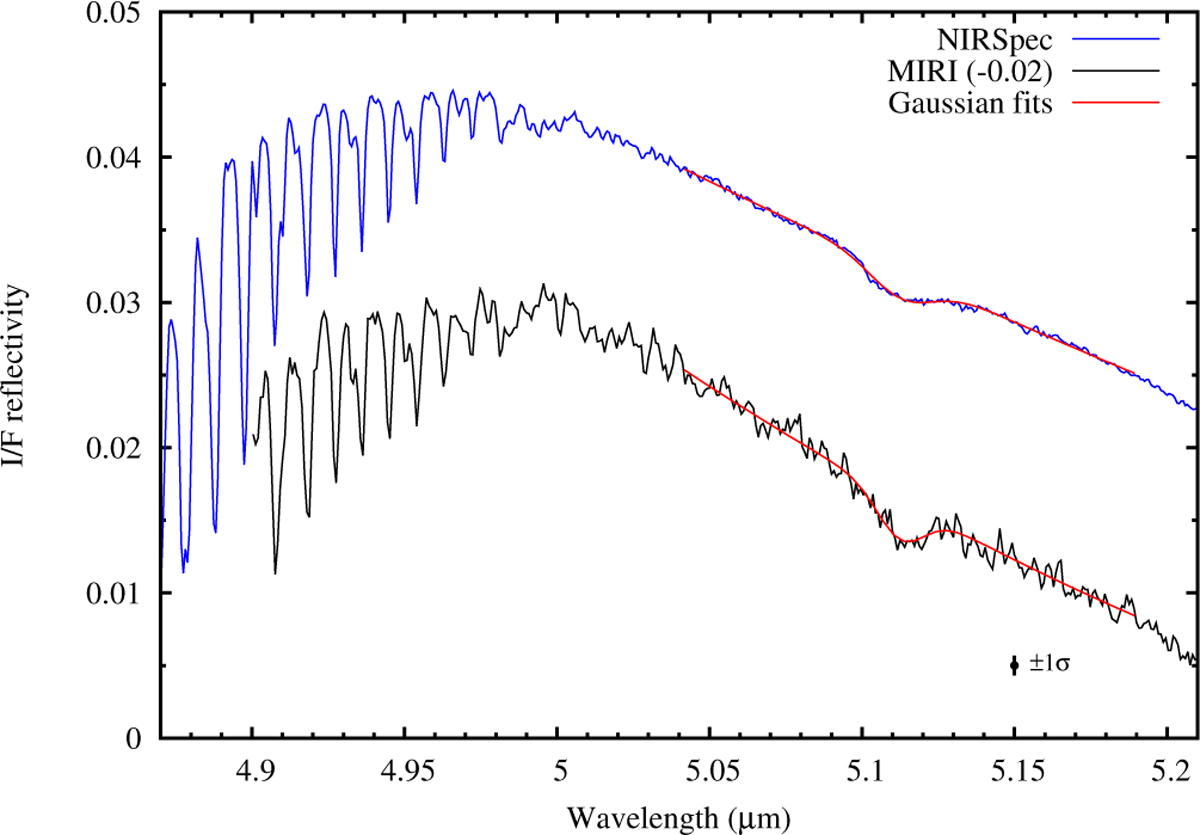
NIRSpec (blue) and MIRI (black) average of nadir spectra of Titan in the 5 μm atmospheric window (see text for details). The MIRI spectrum is shifted downwards by 0.02 for clarity. Red lines represent Gaussian fits to the absorption feature present at 5.11 μm. The fitting function is the sum of a second-order polynomial (three free parameters) and a Gaussian function with three additional free parameters (position, amplitude, and width). The fitting interval is 5.04–5.19 μm. The ± 1σ error bar for the MIRI spectrum, based on the residuals of the fit, is indicated. The ±1σ error bar for the NIRSpec spectrum is also based on the residuals of the fit and is about ±0.00018 in I/F units.
Current usage metrics show cumulative count of Article Views (full-text article views including HTML views, PDF and ePub downloads, according to the available data) and Abstracts Views on Vision4Press platform.
Data correspond to usage on the plateform after 2015. The current usage metrics is available 48-96 hours after online publication and is updated daily on week days.
Initial download of the metrics may take a while.