| Issue |
A&A
Volume 709, May 2026
|
|
|---|---|---|
| Article Number | L7 | |
| Number of page(s) | 6 | |
| Section | Letters to the Editor | |
| DOI | https://doi.org/10.1051/0004-6361/202658955 | |
| Published online | 06 May 2026 | |
Letter to the Editor
Clues for the accretion-regulated dust torus in the changing-look active galactic nucleus SDSS J101152.98+544206.4
Guangxi Key Laboratory for Relativistic Astrophysics, School of Physical Science and Technology, GuangXi University, No. 100, Daxue Road, Nanning 530004, P. R. China
★ Corresponding author: This email address is being protected from spambots. You need JavaScript enabled to view it.
Received:
14
January
2026
Accepted:
7
April
2026
Abstract
The dust torus plays the key role in determining the observational appearance of active galactic nuclei (AGNs). We test the scenario of an accretion-regulated central dust torus for the first time in the individual changing-look AGN (CLAGN) SDSS J1011+5442. Based on the dependence of the broad-line Hα luminosity on the continuum luminosity, the scenario of moving dust clouds can be ruled out in SDSS J1011+5442. Meanwhile, the virial black hole mass in the bright state is consistent with the mass through the M-σ relation, indicating that virialization assumptions are efficient in central broad-line regions (BLRs). However, the virial black hole mass determined in the dim state is 60 times lower than the value through the M-σ relation. The differing properties of broad-line Hα in different states are naturally explained by the scenario of an accretion-regulated dust torus. Below a critical Eddington ratio, the opening angle of the dust torus declines with increasing accretion rate, and only the outer part of central BLRs is therefore detected for broad-line Hα, with smaller line widths detected in the dim state, but all BLRs are detected in the bright state. Our results not only indicate that the properties of the central dust torus clearly affect the variability properties of changing-look AGNs, but also indicate that the study of changing-look AGNs might provide further clues for dynamical evolving models for a dust torus in AGNs.
Key words: galaxies: active / galaxies: nuclei / quasars: supermassive black holes / quasars: individual: SDSS J101152.98+544206.4
© The Authors 2026
 Open Access article, published by EDP Sciences, under the terms of the Creative Commons Attribution License (https://creativecommons.org/licenses/by/4.0), which permits unrestricted use, distribution, and reproduction in any medium, provided the original work is properly cited.
This article is published in open access under the Subscribe to Open model. This email address is being protected from spambots. You need JavaScript enabled to view it. to support open access publication.
1. Introduction
The source SDSS J101152.98+544206.4 (=SDSS J1011+5442) at redshift 0.246 has been reported to be a changing-look AGN (CLAGN), as discussed in Runnoe et al. (2016), Lyu et al. (2025) because its optical AGN type changed from 1 to 1.9 and then to 1 from 2003 to 2015 and then to 2024. Furthermore, after the photometric and spectroscopic variability properties were analyzed, the scenario of variations in the intrinsic accretion rates was accepted for SDSS J1011+5442, as discussed in Lyu et al. (2025). The scenarios of effects of moving dust clouds (LaMassa et al. 2015; Ricci et al. 2016) and tidal disruption events (Trakhtenbrot et al. 2019; Zhang 2021; Wang et al. 2024) as applied in the CLAGN (Ricci & Trakhtenbrot 2023) was discarded.
However, there is one point that cannot be explained in the scenario of variations in the intrinsic accretion rates in SDSS J1011+5442, when properties of broad Balmer emission lines are considered. When we accept the virialization assumptions in the central broad emission line regions (BLRs) (Vestergaard 2002; Peterson et al. 2004; Greene & Ho 2005; Shen et al. 2011; Mejia-Restrepo et al. 2022) for SDSS J1011+5442 from bright to dim state, the width of broad Hα decreases, which contradicts expectations from virialization assumptions.
Furthermore, according to the accepted scenario of variations in the intrinsic accretion rates in SDSS J1011+5442, the variations in the accretion rates should regulate the spatial structures of the central dust torus, as in the receding torus model of Arshakian (2005), Alonso-Herrero et al. (2011), Marin et al. (2016), Matt & Iwasawa (2019), Barrows et al. (2021) and in the radiation-regulated model of Zhuang et al. (2018), Ricci et al. (2022), Alonso-Tetilla et al. (2026). The changes in the spatial structures of the central dust torus might cause different parts of the central BLRs to be detected in different states, which would explain the unique variability properties of the broad emission lines in CLAGN. The individual CLAGN SDSS J1011+5442 with apparent variations in the central accretion rates provides the best opportunity to verify the changes in the spatial structures of the central dust torus. This is the main objective of this Letter.
In this Letter, Section 2 presents the spectroscopic results and main discussions of SDSS J1011+5442. The main conclusions are given in Section 3. We adopted the cosmological parameters H0 = 70 km s−1 Mpc−1, Ωm = 0.3, and ΩΛ = 0.7.
2. Spectroscopic results and discussions
The SDSS spectrum of SDSS J1011+5442 (plate-mjd-fiberid = 8181-57073-0827) in the dim state is shown in the top left panel of Fig. 1 with apparent stellar absorption features. Before measuring emission line properties, host galaxies contributions were determined and subtracted, by the commonly accepted simple stellar population (SSP) method (Bruzual & Charlot 2003; Kauffmann et al. 2003; Cid Fernandes et al. 2005; Cappellari 2017). Similar to what we recently done in Zhang (2024a,b), Gu et al. (2025), Zheng et al. (2025), the sum of the strengthened, shifted, and broadened 39 SSPs discussed in Bruzual & Charlot (2003), Kauffmann et al. (2003) was applied to describe the host galaxy contributions. We also applied a power-law function to describe the intrinsic AGN continuum emissions because the broad-line Hα emissions are weak, but apparent. After the emission lines were masked out, we determined the host galaxy contributions and AGN continuum emissions through the Levenberg-Marquardt least-squares minimization technique Markwardt (2009), shown in the top left panel of Fig. 1. The stellar velocity dispersion (the broadening velocity of the SSPs) can be measured as 211 ± 17 km/s, consistent with the SDSS-provided value 205 ± 30 km/s. This indicates that the measured stellar velocity dispersion is reliable enough.
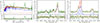 |
Fig. 1. Spectroscopic properties of SDSS J1011+5442 in the dim state. The top left panel shows the SDSS spectrum (solid dark green line) and the determined best descriptions of host galaxy contributions (solid blue line) and AGN continuum emissions (dashed red line). The solid red line shows the sum of host galaxy contributions and AGN continuum emissions. The bottom left panel shows the spectrum after subtraction of the host galaxy contributions and AGN continuum emissions. The horizontal dashed red line marks fλ = 0. The top middle panel shows the spectrum around Hβ (solid dark green line) and the best-fitting results (solid red line) after subtraction of the host galaxy contributions. The dashed blue lines show the determined Gaussian components of narrow Hβ and [O III] doublet. The bottom middle panel shows the residuals. The horizontal solid and dashed red lines mark residuals = 0, ±1. The right panels show the results for emission lines around Hα, similar as in the middle panels. In the top right panel, the dashed blue lines show the determined Gaussian components in the narrow emission lines, and the solid blue line shows the determined broad Hα line. |
After subtracted the host galaxy contributions in the dim state, we measured the emission lines around Hβ (rest wavelength from 4750 to 5100 Å) and around Hα (rest wavelength from 6450 to 6800 Å) in the line spectrum. For each narrow emission line, one Gaussian function with intensity not smaller than zero was applied. For each broad Balmer emission line, one Gaussian function was applied with emission intensity not smaller than zero and line width not smaller than 400 km/s. For [O III] λ4959, 5007 Å doublet ([N II] λ6549, 6583 Å doublet), the same redshift and line width in velocity space and a flux ratio of 3:1 were accepted for the applied Gaussian components. We did not consider the [O I] doublet because the emission intensities are very low. We applied a power-law function to describe the AGN continuum emissions below the emission lines. We show the best-fitting results (χ2/d.o.f. ∼ 0.91) and corresponding residuals to the emission lines in the dim state in the middle and right panels of Fig. 1 through the Levenberg-Marquardt least-squares minimization technique. The residuals were calculated by the line spectrum minus the best-fitting results and were then divided by the uncertainties of the line spectrum. The measured parameters and corresponding 1σ uncertainties of the Gaussian emission components are listed in Table 1 in Appendix A. The best-fitting results were applied to confirm that SDSS J1011+5442 is a Type 1.9 AGN in the dim state because it lacks the Hβ line, but shows the broad Hα line according to the commonly accepted AGN-type classifications (Runco et al. 2016).
The SDSS spectrum of SDSS J1011+5442 (plate-mjd-fiberid = 0945-52652-0022) in the bright state is shown in the left panel of Fig. 2. Based on the host galaxy contributions determined in the dim state, the line spectrum in the bright state was simply determined as the bright spectrum minus the host galaxy contributions. We then applied similar multiple Gaussian components to describe the emission lines. Because the broad Balmer emission lines are very strong, we applied not one, but three Gaussian functions to describe each broad Balmer component. Because the narrow Hα and [N II] doublet in the spectrum are hardly visible in the bright state, we assumed that the Gaussian components for the narrow Hα and [N II] doublet in the bright state had the same central wavelengths and line widths as those in the dim state. We applied an additional Gaussian function to each emission component of the [O III] λ4959, 5007 Å doublet to describe the more complicated line profiles of the [O III] doublet in the spectrum well. Its signal-to-noise ratio in the bright state is high. We applied the sum of the broadened, shifted, and strengthened templates of the optical Fe II emission features in Kovacevic et al. (2010) to describe the optical Fe II emissions in the bright state. We show the best-fitting results (χ2/d.o.f. ∼ 1.34) and corresponding residuals to the emission lines in the bright state based on the Levenberg-Marquardt least-squares minimization technique in the middle and right panels of Fig. 2. The best-fitting results were applied to confirm that the SDSS J1011+5442 is a Type-1 AGN in the bright state because the broad Hβ and broad Hα lines are strong and clearly visible. The flux ratio is  for the broad Hα to the broad Hβ line. The measured narrow emission intensities around Hα are only slightly consistent with those measured in the dim state, mainly due to the very weak narrow emission lines relative to the very strong broad Hα line in the bright state.
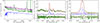 |
Fig. 2. Spectroscopic properties of SDSS J1011+5442 in the bright state. The left panel shows the SDSS spectrum (solid purple line) in the bright state. The solid blue line shows the host galaxy contributions determined in the dim state. The solid dark green line shows the component calculated based on the SDSS spectrum in the bright state minus the host galaxy contributions. The top middle panel shows the best-fitting results (solid red line) to the emission lines around Hβ after subtraction of the host galaxy contributions. The dashed blue lines show the determined Gaussian components of the narrow Hβ and [O III] doublet, the solid purple lines show the determined optical Fe II emissions, and the solid blue lines show the determined Gaussian components in the broad Hβ line. The dashed red line shows the determined AGN continuum emissions below the emission lines. The bottom middle panel shows the corresponding residuals, with horizontal solid and dashed red lines marking residuals = 0, ±1. The right panels show the results for the emission lines around Hα in the bright state after subtraction of the host galaxy contributions. The dashed blue lines show the determined Gaussian components in the narrow Hα and [N II] and [S II] doublets, and the solid blue lines show the determined Gaussian components in the broad Hα line. The dashed red line shows the determined AGN continuum emissions below the emission lines. |
Based on the best-fitting results above, the continuum luminosities L5100 in units of 1043 erg/s at 5100 Å in rest frame are L5100, d = 1.16 ± 0.06 and L5100, b = 7.78 ± 0.06 in the dim and the bright state, respectively. The broad-line Hα luminosities Lα in units of 1042 erg/s are Lα, d = 0.19 ± 0.02 and Lα, b = 7.94 ± 1.02 in the dim and in the bright state, respectively. Based on the reported strong linear correlation between L5100 and Lα for SDSS quasars in Greene & Ho (2005), we verified the properties of L5100 and Lα in the dim and bright states for SDSS J1011+5442 and show them in the top panel of Fig. 3. We selected 1158 unobscured SDSS quasars from the database of Shen et al. (2011) with reliable measurements of L5100 and Lα and with a flux ratio of the broad Hα to the broad Hβ lower than 4. We confirm that SDSS J1011+5442 in the dim and bright states follows the same dependence of Lα on L5100 as for the unobscured SDSS quasars, indicating only a few effects of dust reddening on the measurements of L5100 and Lα in the dim and bright states. Furthermore, if accepted the dim state due to serious obscuration in SDSS J1011+5442, due to the estimated E(B − V) = 1.72 of the extinction curve in Fitzpatrick (1999), which was applied to explain Lα, b/Lα, d ∼ 41.8, the reddening-corrected L5100 and Lα from the dim state mean that SDSS J1011+5442 is an outlier (solid red circle) in the space of L5100 versus Lα. This reconfirms that only a few effects of dust obscurations in the dim state in SDSS J1011+5442.
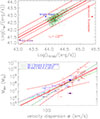 |
Fig. 3. Properties of SDSS J1011+5442 in space of Lα vs. L5100 (top panel) and of BH mass vs. stellar velocity dispersion (bottom panel). In the top panel, the small blue dots with error bars show the results for the selected 1158 unobscured SDSS quasars from Shen et al. (2011), and the solid, dotted, and dashed red lines show the best-fitting results ( |
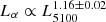
When effects of serious obscuration can be ruled out in SDSS J1011+5442, the variability in the broad emission lines, especially in the broad Hα, are expected to obey the results based on the virialization assumptions in central BLRs. When we consider that the measured line width V (second moment, in units of 1000 km/s) of the broad Hα of Vd = 0.87 ± 0.05 and Vb = 2.44 ± 0.14 in the dim and bright state, the corresponding virial BH masses (in units of 106 M⊙) in the dim state and in the bright state are Md = 4.70 ± 0.83 and Mb = 307 ± 58 based on the equation 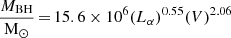 in Greene & Ho (2005), combined with the full width of half maximum of 2.35V. We determined the uncertainties of the virial BH masses based on the uncertainties of the line parameters of the corresponding broad-line Hα. Based on the known M-σ relation (Kormendy & Ho 2013; Bennert et al. 2021), the estimated central BH mass (in units of 106 M⊙) is Mσ = 217 ± 85, consistent with Mb within the uncertainties. We redetermined the M-σ relation as log(MBH/M⊙) = (−2.89 ± 0.49)+(4.83 ± 0.22)log(σ/(km/s)) with the least-trimmed squares regression technique (Cappellari et al. 2013) based on the selected quiescent galaxies and reverberation-mapped broad-line AGN and tidal disruption events, shown as solid red line in the bottom panel of Fig. 3. The BH mass in SDSS J1011+5442 is similar based on this. The consistent BH masses between Mσ and Mb strongly indicate virialization assumptions preferred in the BLRs in the bright state of SDSS J1011+5442. However, because Md is very different from Mb, the measured parameters of the broad-line Hα apparently cannot follow the results expected based on the virialization assumptions, that is, the results expected based on the virialization assumptions cannot be found in the broad Hα line in the dim state.
In order to explain why the properties of the broad Hα line are different from the results expected from virialization assumptions in the dim state, we propose the receding dust torus model instead of the accretion-regulated dust torus, as discussed in Zhuang et al. (2018), for SDSS J1011+5442. In the dim state, the lower accretion rate (lower continuum luminosity) leads to a larger opening angle (relative to the equatorial plane, as shown in the toy model in Fig. B.1 in the Appendix) of the central dust torus, which indicates that only the far side of central BLRs can be directly observed. In the bright state, however the higher accretion rate (stronger continuum luminosity) leads to a smaller opening angle of the central dust torus, which indicates that all central BLRs can be observed. Therefore, in the dim state, the BLR size determined based on the luminosity in the broad Hα line is far smaller than the intrinsic value. The viral BH mass is therefore far lower than that determined based on the M-σ relation. However, in the bright state, BLRs are common, and the virial BH mass is consistent that determined based on the M-σ relation.
As discussed in Zhuang et al. (2018), variations in the accretion rates can lead to strong variations in the opening angles of the central dust torus. In SDSS J1011+5442, from the dim to bright state, the dimensionless Eddington ratio is changed from 0.006 to 0.04 (lower than the critical value 0.5) when we assume that the bolometric luminosity is 15 times higher than L5100, as recently discussed in Netzer (2019). The half-opening angle ∼27° of the central dust torus in bright state might therefore be smaller by 15 degrees than the half-opening angle ∼42° in the dim state, assuming the roughly linear dependence shown in Fig. 11 in Zhuang et al. (2018). The dependence reported by Zhuang et al. (2018) showed strong scatter, and the estimated half-opening angles in SDSS J1011+5442 are not accurate values, but they can be applied to show the probable variations in the half-opening angles. It is hard to give quantified structures of the central systems in SDSS J1011+5442, but we provide a toy model in Fig. B.1 in Appendix B, based on which, the scenario of an accretion-regulated dust torus can be reasonably accepted to explain the variations in the broad emission lines in SDSS J1011+5442.
Furthermore, we discuss the time duration of 13.8 years (from the bright state to the dim state) to show that it is long enough to complete the regulated process of the central dust torus in SDSS J1011+5442 with the following two points. First, as discussed in Kishimoto et al. (2022, 2013) for the dust torus in AGN NGC 4151, the radius of the dust-sublimation region might vary over years through the near-IR reverberation mapping technique and the interferometry results. Second, as the toy model in Fig. B.1 in the appendix shows, the height variation (length of  ) of about 1.3RB might cause the velocity of dust clouds to become
  , which is consistent with the estimated freefall velocity for dust clouds with a distance of about 150 light days (four to five times RB) to the central BH (BH mass about 2 − 3 × 10⁸ M⊙) in SDSS J1011+5442. We estimate RB to be 31.6 light days in SDSS J1011+5442 according to the empirical relation in Bentz et al. (2013), based on the continuum luminosity 7.78 × 1043 erg/s at 5100 Å in the rest frame in the bright state in SDSS J1011+5442. Therefore, the physical picture of an accretion-regulated dust torus is efficient enough in CLAGN SDSS J1011+5442. The results above provide enough clues to support the hypothesis that the dynamical evolving properties of the central dust torus clearly affect the variability properties of the broad Balmer emission lines in CLAGN.
3. Conclusions
Motivated by the scenario of a radiation-regulated dust torus in AGN, we studied the variability properties of broad emission lines to test the evolving dust torus in the known CLAGN SDSS J1011+5442 with apparent variations in the intrinsic accretion rates. Through the strong correlation between L5100 and Lα for unobscured SDSS quasars, effects of moving dust clouds can be ruled out in SDSS J1011+5442. Because the virial BH mass in the bright state is consistent with the BH mass estimated based on the M-σ relation, the virialization assumptions are efficient enough in the central BLRs in SDSS J1011+5442. However, the BH mass determined in the dim state based on the M-σ relation is far higher than the virial BH mass. Therefore, instead of the receding torus model, we prefer the scenario of an accretion-regulated dust torus for SDSS J1011+5442, in which the opening angle of the dust torus declines with increasing accretion rate below the critical Eddington ratio. In other words, the lower accretion rate leading to a larger half-opening angle of the central dust torus indicates that only the outer part of the central BLRs is detected in the dim state. The lines widths in the broad Hα line are therefore smaller, but all BLRs can be detected in the bright state. Therefore, clear effects of an evolving dust torus should be expected when CLAGN properties are studied. Furthermore, we expect further clues for determining the properties of the changes in the structures of the central dust torus in the near future from studies of the properties of broad Balmer emission lines in a sample of CLAGN.
Acknowledgments
Zhang gratefully acknowledge the anonymous referee for giving us constructive comments and suggestions to greatly improve the paper. Zhang gratefully thanks the kind grant support from the HangJi Action Plan under the Guangxi Science and Technology Program 2026GXNSFDA00640018 and from NSFC-12373014 and 12173020 and from Guangxi Talent Programme (Highland of Innovation Talents) and from the Bagui Scholars Programme (W X G., GXR-6BG2424001). This manuscript has made use of the data from the SDSS (https://www.sdss.org/).
References
- Alonso-Herrero, A., Ramos Almeida, C., Mason, R., et al. 2011, ApJ, 736, 82 [NASA ADS] [CrossRef] [Google Scholar]
- Alonso-Tetilla, A. V., Shankar, F., & Fontanot, F. 2026, MNRAS, 547, staf1485 [Google Scholar]
- Arshakian, T. G. 2005, A&A, 436, 817 [NASA ADS] [CrossRef] [EDP Sciences] [Google Scholar]
- Barrows, R. S., Comerford, J. M., & Stern, D. 2021, ApJ, 922, 179 [NASA ADS] [CrossRef] [Google Scholar]
- Bennert, V. N., Treu, T., Ding, X., et al. 2021, ApJ, 921, 36 [NASA ADS] [CrossRef] [Google Scholar]
- Bentz, M. C., Denney, K. D., Grier, C. J., et al. 2013, ApJ, 767, 149 [Google Scholar]
- Bruzual, G., & Charlot, S. 2003, MNRAS, 344, 1000 [NASA ADS] [CrossRef] [Google Scholar]
- Cappellari, M. 2017, MNRAS, 466, 798 [Google Scholar]
- Cappellari, M., Scott, N., Alatalo, K., et al. 2013, MNRAS, 432, 1709 [Google Scholar]
- Cid Fernandes, R., Mateus, A., Sodre, L., Stasinska, G., & Gomes, J. M. 2005, MNRAS, 358, 363 [Google Scholar]
- Fitzpatrick, E. L. 1999, PASP, 111, 63 [Google Scholar]
- Greene, J. E., & Ho, L. C. 2005, ApJ, 630, 122 [NASA ADS] [CrossRef] [Google Scholar]
- Gu, Y., Zheng, Q., Cheng, P., et al. 2025, ApJ, 986, 174 [Google Scholar]
- Kauffmann, G., Heckman, T. M., Tremonti, C., et al. 2003, MNRAS, 346, 1055 [Google Scholar]
- Kishimoto, M., Honig, S. F., Robert Antonucci, R., et al. 2013, ApJ, 775, L36 [NASA ADS] [CrossRef] [Google Scholar]
- Kishimoto, M., Anderson, M., Brummelaar, T., et al. 2022, ApJ, 940, 28 [NASA ADS] [CrossRef] [Google Scholar]
- Kormendy, J., & Ho, L. C. 2013, ARA&A, 51, 511 [Google Scholar]
- Koshida, S., Minezaki, T., Yoshii, Y., et al. 2014, ApJ, 788, 159 [Google Scholar]
- Kovacevic, J., Popovic, L. C., & Dimitrijevic, M. S. 2010, ApJS, 189, 15 [CrossRef] [Google Scholar]
- LaMassa, S. M., Cales, S., Moran, E. C., et al. 2015, ApJ, 800, 144 [NASA ADS] [CrossRef] [Google Scholar]
- Li, J. Y., & Shen, Y. 2023, ApJ, 950, 122 [NASA ADS] [CrossRef] [Google Scholar]
- Lyu, B., Wu, X., Pang, Y., et al. 2025, A&A, 693, A173 [NASA ADS] [CrossRef] [EDP Sciences] [Google Scholar]
- Mannerkoski, M., Johansson, P. H., Rantala, A., et al. 2022, ApJ, 929, 167 [NASA ADS] [CrossRef] [Google Scholar]
- Marin, F., Goosmann, R. W., & Petrucci, P. O. 2016, A&A, 519, A23 [Google Scholar]
- Markwardt, C. B. 2009, ASPC, 411, 251 [Google Scholar]
- Matt, G., & Iwasawa, K. 2019, MNRAS, 482, 151 [Google Scholar]
- Mejia-Restrepo, J. E., Trakhtenbrot, B., Koss, M. J., et al. 2022, ApJS, 261, 5 [CrossRef] [Google Scholar]
- Naddaf, M. H., Czerny, B., & Szczerba, R. 2021, ApJ, 920, 30 [NASA ADS] [CrossRef] [Google Scholar]
- Naddaf, M. H., Martinez-Aldama, M. L., Marziani, P., Czerny, B., & Hutsemekers, D. 2025, A&A, 702, L13 [NASA ADS] [CrossRef] [EDP Sciences] [Google Scholar]
- Netzer, H. 2019, MNRAS, 488, 5185 [NASA ADS] [CrossRef] [Google Scholar]
- Peterson, B. M., Ferrarese, L., Gilbert, K. M., et al. 2004, ApJ, 613, 682 [Google Scholar]
- Ricci, C., & Trakhtenbrot, B. 2023, Nat. Astron., 7, 1282 [Google Scholar]
- Ricci, C., Bauer, F. E., Arevalo, P., et al. 2016, ApJ, 820, 5 [NASA ADS] [CrossRef] [Google Scholar]
- Ricci, C., Ananna, T. T., Temple, M. J., et al. 2022, ApJ, 938, 67 [NASA ADS] [CrossRef] [Google Scholar]
- Runco, J. N., Cosens, M., Bennert, V. N., et al. 2016, ApJ, 821, 33 [NASA ADS] [CrossRef] [Google Scholar]
- Runnoe, J. C., Cales, S., Ruan, J. J., et al. 2016, MNRAS, 455, 1691 [Google Scholar]
- Savorgnan, G. A. D., & Graham, A. W. 2015, MNRAS, 446, 2330 [Google Scholar]
- Shen, Y., Richards, G. T., Strauss, M. A., et al. 2011, ApJS, 194, 45 [Google Scholar]
- Trakhtenbrot, B., Arcavi, I., MacLeod, C. L., et al. 2019, ApJ, 883, 94 [Google Scholar]
- Vestergaard, M. 2002, ApJ, 571, 733 [NASA ADS] [CrossRef] [Google Scholar]
- Wang, Y., Lin, D. N. C., Zhang, B., & Zhu, Z. 2024, ApJ, 962, 7 [Google Scholar]
- Woo, J., Yoon, Y., Park, S., Park, D., & Kim, S. C. 2015, ApJ, 801, 38 [NASA ADS] [CrossRef] [Google Scholar]
- Zhang, X. G. 2021, ApJ, 919, 13 [NASA ADS] [CrossRef] [Google Scholar]
- Zhang, X. G. 2024a, ApJ, 964, 141 [Google Scholar]
- Zhang, X. G. 2024b, ApJ, 961, 82 [CrossRef] [Google Scholar]
- Zheng, Q., Ma, Y., Zhang, X. G., Yuan, Q., & Bian, W. 2025, ApJS, 277, 49 [Google Scholar]
- Zhou, Z. Q., Liu, F. K., Komossa, S., et al. 2021, ApJ, 907, 77 [Google Scholar]
- Zhuang, M., Ho, L. C., & Shangguan, J. 2018, ApJ, 862, 118 [NASA ADS] [CrossRef] [Google Scholar]
Appendix A: Emission line parameters
The measured emission line properties are listed in Table A.1. Based on the listed parameters, we can find that there are similar extended components having line width (second moment) about 8Å in the [O III]λ5007Å in the bright state and in the dim state. However, there is an additional narrower component having line width (second moment) about 1.7Å in the [O III]λ5007Å in the bright state. The narrower component was lost in the dim state, probably mainly due to its lower signal-to-noise (13) of the spectrum in the dim state than the signal-to-noise (19) of the spectrum in the bright state.
Limited ranges for the Model parameters
Furthermore, we can find that the measured narrow Hβ flux is zero in the bright state. Therefore, it is necessary to estimate a upper limit fup of narrow Hβ flux in the bright state. In other words, narrow Hβ having line flux smaller than fup should be not detected in the spectrum in the bright state in SDSS J1011+5442. Here, a simple method is applied as follows to estimate fup. If a narrow Hβ component with line width (second moment) 4.6Å (same as the value determined in the dim state) and line flux fline was intrinsically included in the spectrum in the bright state of SDSS J1011+5442, once such narrow component can be detected with its measured parameters at least 1 times larger than their determined uncertainties by the same fitting procedure above, we can accept fline as the fup, leading to fline = fup ∼ 30 × 10−17erg/s/cm2. Considering the measured narrow Hβ line flux in the dim state is smaller than fup, hence such narrow component cannot be detected in the spectrum in the bright state.
Appendix B: A toy model on spatial structures of central systems
In order to give more clear descriptions on accretion regulated dust torus in SDSS J1011+5442, a toy model shown in Fig. B.1 can be given on spatial structures of central systems. The extended spatial structure of BLRs is shown as the area filled by green, with red cross (F) as the central point, and with G and E as the inner and outer boundaries of the central BLRs. The central BH is shown as solid blue circle (O), lying at the cross point where x-axis and y-axis intersect. And the inner boundary (A) of the dust torus is shown as purple cross, the upper boundaries of the central dust torus in the bright state and in the dim state are shown as solid and dashed blue lines. Then, based on discussions in Koshida et al. (2014), Li & Shen (2023), size RD (length of  ) between central BH and inner boundary of dust torus can be simply estimated by bolometric/continuum luminosity, and ratio about 4 of RD to RB (size of BLRs in SDSS J1011+5442, length of
  ) can be commonly expected in one AGN.
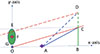 |
Fig. B.1. Toy model of central systems in SDSS J1011+5442. Area in green shows the BLRs with G, F and E marking the inner boundary, the central point (red cross) and the outer boundary. Solid circle in blue (O) show the central BH. Purple cross (A) shows the inner boundary of central dust torus. Lengths of |


Moreover, based on the RB (size of BLRs) in different states with different continuum luminosities in the known reverberation mapped AGN NGC5548 as shown in Peterson et al. (2004), the mean value of RB is about 16light-days, the lower and upper limits of RB are about [7, 27]light-days. Therefore, accepted extended structures of BLRs in SDSS J1011+5442 having similar ratios as those in NGC5548, the corresponding lower and upper limits of central BLRs in SDSS J1011+5442 can be reasonably accepted as 0.4RB (length of  ) and 1.7RB (length of
  ). Then, we simply accepted that the height of the dust torus shown as vertical dashed line in the bright state is equal to the distance (1.7RB) between outer radius of BLRs to central black hole, in order to ensure that the total BLRs can be obscures when line of sight parallel to x-axis.
Based on the toy model with assumed red lines as line of sight, in bright state, areas above the solid red line can be directly observed. If ∠BAC (half opening angle in bright state) accepted to be ∼27° (related to Eddington ratio 0.04) in the bright state changed to ∠BAD∼42° (related to Eddington ratio 0.006) in SDSS J1011+5442, the height of  can be estimated to be
 (B.1)
(B.1)
, accepted tiny variations of inner boundaries of the central dust torus from the bright state to the dim state in SDSS J1011+5442. Therefore, from the bright state to the dim state, the region of BLRs over the dashed red line (shifted from solid red line with shifted distance 1.3RB) can be directly observed without obscurations, but the region of BLRs under the dashed red line could be serious obscured by dust torus. In other words, about 70% ( ) of the BLRs can be seriously obscured. Meanwhile, based on the shown toy model, the inclination angles of line of sight relative to the x-axis can be estimated as ∠BOC∼14°, a possible value for Type-1 AGN with high accretion rates.
The results above indicate that the assumption of accretion regulated dust torus can be reasonably accepted to explain the variations of broad emission lines in SDSS J1011+5442. Certainly, different values of  (
( ), ∠BAC and ∠BAD can lead to different results on obscured regions of BLRs. For example, a large height
  can sensitively lead to a large value of ∠BOC. Unfortunately, at current stage, it is hard to give a clear estimations on the parameters in the toy model above. Therefore, there are not further discussions on the toy model any more.
Before ending the section, one point should be noted. As the discussed Failed Radiatively Accelerated Dusty Outflow (FRADO) models in Naddaf et al. (2021, 2025), central dust torus can be builded related to the FRADO models in AGN. Unfortunately, in cases with low accretion rates (SDSS J1011+5442 having lower accretion rates even in bright state), the moving velocities of clouds are only a few hundreds of kilometers per second in FRADO related to dust torus, which is very smaller than the expected velocities (about 2000km/s) to change the height of the dust torus in SDSS J1011+5442. In other words, if accepted the central dust torus related to FRADO models, the time duration 13.8 years should be not long enough to complete the regulated process of central dust torus in SDSS J1011+5442. Therefore, the central dust torus in SDSS J1011+5442 could be probably different from the torus related to the FRADO models.
All Tables
All Figures
|
Fig. 1. Spectroscopic properties of SDSS J1011+5442 in the dim state. The top left panel shows the SDSS spectrum (solid dark green line) and the determined best descriptions of host galaxy contributions (solid blue line) and AGN continuum emissions (dashed red line). The solid red line shows the sum of host galaxy contributions and AGN continuum emissions. The bottom left panel shows the spectrum after subtraction of the host galaxy contributions and AGN continuum emissions. The horizontal dashed red line marks fλ = 0. The top middle panel shows the spectrum around Hβ (solid dark green line) and the best-fitting results (solid red line) after subtraction of the host galaxy contributions. The dashed blue lines show the determined Gaussian components of narrow Hβ and [O III] doublet. The bottom middle panel shows the residuals. The horizontal solid and dashed red lines mark residuals = 0, ±1. The right panels show the results for emission lines around Hα, similar as in the middle panels. In the top right panel, the dashed blue lines show the determined Gaussian components in the narrow emission lines, and the solid blue line shows the determined broad Hα line. |
| In the text | |
|
Fig. 2. Spectroscopic properties of SDSS J1011+5442 in the bright state. The left panel shows the SDSS spectrum (solid purple line) in the bright state. The solid blue line shows the host galaxy contributions determined in the dim state. The solid dark green line shows the component calculated based on the SDSS spectrum in the bright state minus the host galaxy contributions. The top middle panel shows the best-fitting results (solid red line) to the emission lines around Hβ after subtraction of the host galaxy contributions. The dashed blue lines show the determined Gaussian components of the narrow Hβ and [O III] doublet, the solid purple lines show the determined optical Fe II emissions, and the solid blue lines show the determined Gaussian components in the broad Hβ line. The dashed red line shows the determined AGN continuum emissions below the emission lines. The bottom middle panel shows the corresponding residuals, with horizontal solid and dashed red lines marking residuals = 0, ±1. The right panels show the results for the emission lines around Hα in the bright state after subtraction of the host galaxy contributions. The dashed blue lines show the determined Gaussian components in the narrow Hα and [N II] and [S II] doublets, and the solid blue lines show the determined Gaussian components in the broad Hα line. The dashed red line shows the determined AGN continuum emissions below the emission lines. |
| In the text | |
|
Fig. 3. Properties of SDSS J1011+5442 in space of Lα vs. L5100 (top panel) and of BH mass vs. stellar velocity dispersion (bottom panel). In the top panel, the small blue dots with error bars show the results for the selected 1158 unobscured SDSS quasars from Shen et al. (2011), and the solid, dotted, and dashed red lines show the best-fitting results ( |
| In the text | |
|
Fig. B.1. Toy model of central systems in SDSS J1011+5442. Area in green shows the BLRs with G, F and E marking the inner boundary, the central point (red cross) and the outer boundary. Solid circle in blue (O) show the central BH. Purple cross (A) shows the inner boundary of central dust torus. Lengths of |
| In the text | |
Current usage metrics show cumulative count of Article Views (full-text article views including HTML views, PDF and ePub downloads, according to the available data) and Abstracts Views on Vision4Press platform.
Data correspond to usage on the plateform after 2015. The current usage metrics is available 48-96 hours after online publication and is updated daily on week days.
Initial download of the metrics may take a while.