Fig. 3.
Download original image
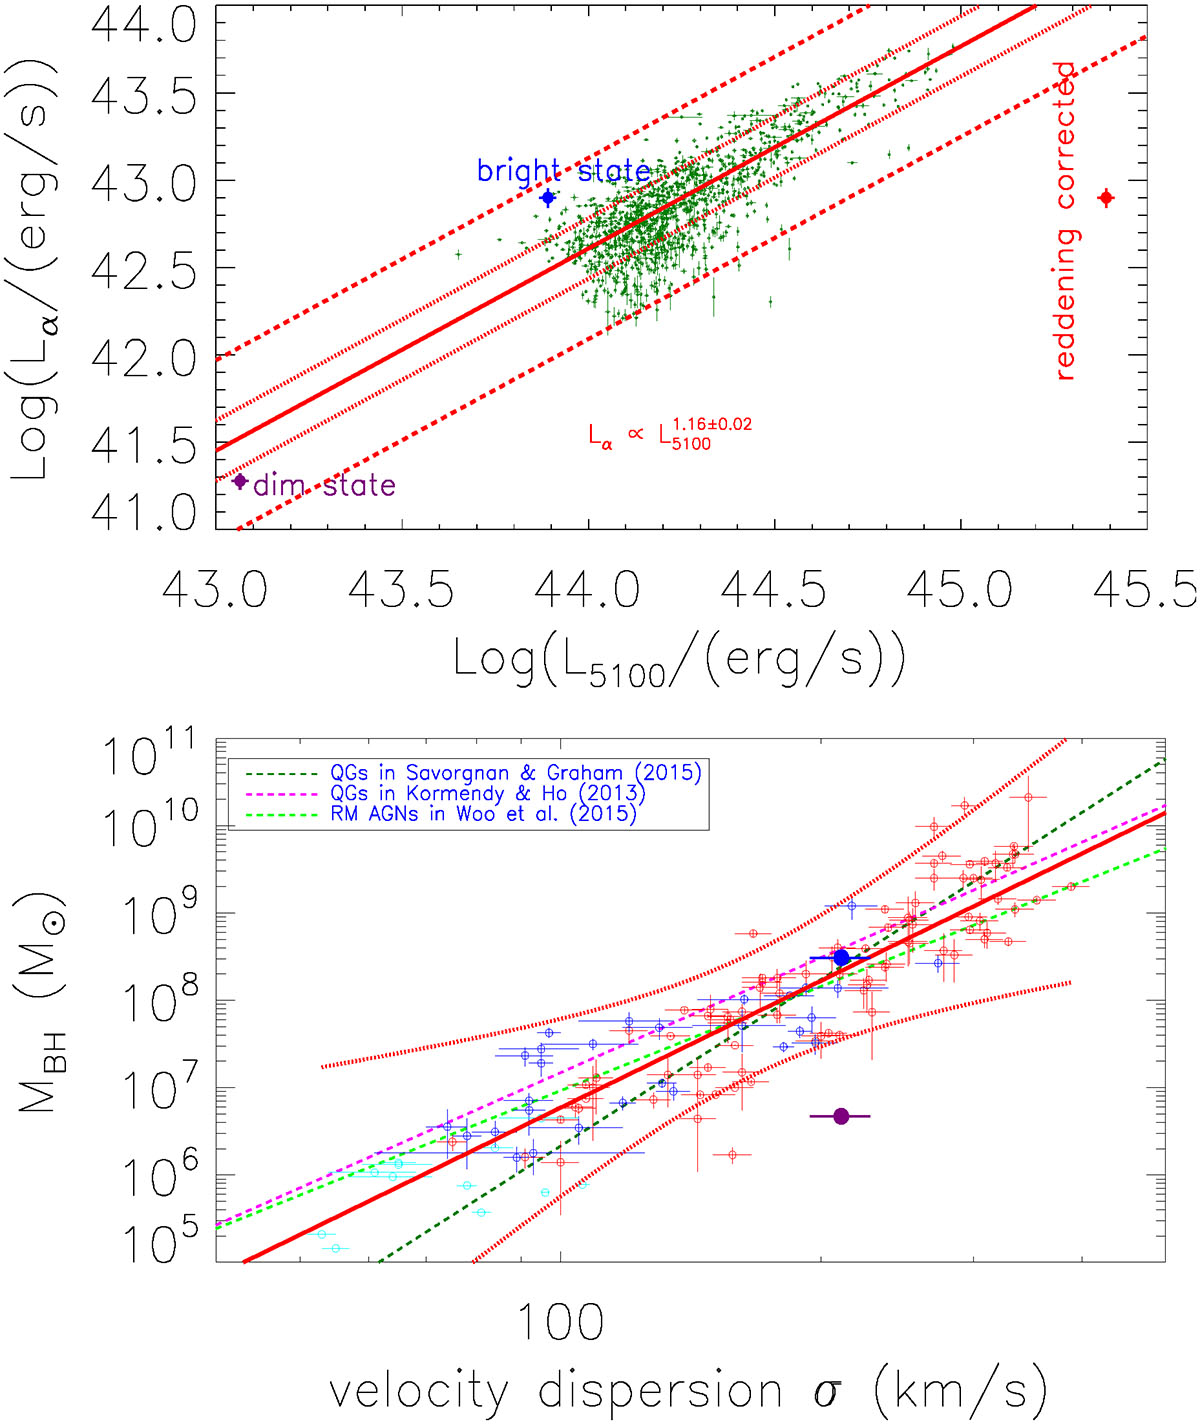
Properties of SDSS J1011+5442 in space of Lα vs. L5100 (top panel) and of BH mass vs. stellar velocity dispersion (bottom panel). In the top panel, the small blue dots with error bars show the results for the selected 1158 unobscured SDSS quasars from Shen et al. (2011), and the solid, dotted, and dashed red lines show the best-fitting results (![]() ) and the corresponding 1RMS and 3RMS scatters. The solid purple and blue circles plus error bars show the results for SDSS J1011+5442 in the dim and the bright state, respectively. In the bottom panel, open red, blue, and cyan circles plus error bars show the results for the quiescent galaxies in Savorgnan & Graham (2015), the reverberation-mapped broad-line AGN in Woo et al. (2015), and the tidal disruption events in Zhou et al. (2021). The solid and dashed red lines show the best-fitting results for the dependence and the corresponding 5σ confidence bands. The dashed dark green, purple, and green lines show the determined results for the dependence from Savorgnan & Graham (2015), Kormendy & Ho (2013), Woo et al. (2015). The solid purple and blue circles plus error bars show the results for SDSS J1011+5442 in the dim and bright state, respectively.
) and the corresponding 1RMS and 3RMS scatters. The solid purple and blue circles plus error bars show the results for SDSS J1011+5442 in the dim and the bright state, respectively. In the bottom panel, open red, blue, and cyan circles plus error bars show the results for the quiescent galaxies in Savorgnan & Graham (2015), the reverberation-mapped broad-line AGN in Woo et al. (2015), and the tidal disruption events in Zhou et al. (2021). The solid and dashed red lines show the best-fitting results for the dependence and the corresponding 5σ confidence bands. The dashed dark green, purple, and green lines show the determined results for the dependence from Savorgnan & Graham (2015), Kormendy & Ho (2013), Woo et al. (2015). The solid purple and blue circles plus error bars show the results for SDSS J1011+5442 in the dim and bright state, respectively.
Current usage metrics show cumulative count of Article Views (full-text article views including HTML views, PDF and ePub downloads, according to the available data) and Abstracts Views on Vision4Press platform.
Data correspond to usage on the plateform after 2015. The current usage metrics is available 48-96 hours after online publication and is updated daily on week days.
Initial download of the metrics may take a while.