Fig. 2.
Download original image
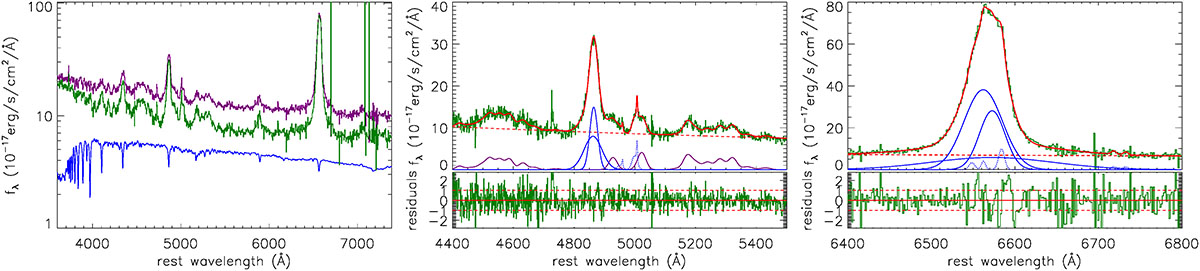
Spectroscopic properties of SDSS J1011+5442 in the bright state. The left panel shows the SDSS spectrum (solid purple line) in the bright state. The solid blue line shows the host galaxy contributions determined in the dim state. The solid dark green line shows the component calculated based on the SDSS spectrum in the bright state minus the host galaxy contributions. The top middle panel shows the best-fitting results (solid red line) to the emission lines around Hβ after subtraction of the host galaxy contributions. The dashed blue lines show the determined Gaussian components of the narrow Hβ and [O III] doublet, the solid purple lines show the determined optical Fe II emissions, and the solid blue lines show the determined Gaussian components in the broad Hβ line. The dashed red line shows the determined AGN continuum emissions below the emission lines. The bottom middle panel shows the corresponding residuals, with horizontal solid and dashed red lines marking residuals = 0, ±1. The right panels show the results for the emission lines around Hα in the bright state after subtraction of the host galaxy contributions. The dashed blue lines show the determined Gaussian components in the narrow Hα and [N II] and [S II] doublets, and the solid blue lines show the determined Gaussian components in the broad Hα line. The dashed red line shows the determined AGN continuum emissions below the emission lines.
Current usage metrics show cumulative count of Article Views (full-text article views including HTML views, PDF and ePub downloads, according to the available data) and Abstracts Views on Vision4Press platform.
Data correspond to usage on the plateform after 2015. The current usage metrics is available 48-96 hours after online publication and is updated daily on week days.
Initial download of the metrics may take a while.