


| Issue |
A&A
Volume 710, June 2026
|
|
|---|---|---|
| Article Number | A3 | |
| Number of page(s) | 14 | |
| Section | Planets, planetary systems, and small bodies | |
| DOI | https://doi.org/10.1051/0004-6361/202558039 | |
| Published online | 28 May 2026 | |
The meteorite analogs of (65803) Didymos and implications for its origin
1
Purple Mountain Observatory, Chinese Academy of Sciences,
Nanjing
210023,
China
2
School of Astronomy and Space Science, University of Science and Technology of China,
Hefei
230026,
China
3
State Key Laboratory of Lunar and Planetary Sciences, Macau University of Science and Technology,
Macau,
China
4
School of Mathematics and Information Science, Xiangnan University,
Chenzhou
423000,
China
★ Corresponding author: This email address is being protected from spambots. You need JavaScript enabled to view it.
Received:
9
November
2025
Accepted:
14
April
2026
Abstract
Context. Identifying meteorite analogs of asteroids is key to understanding their origin and evolution, evaluating planetary defense, and exploring potential space resources. The Didymos binary asteroid system, whose satellite Dimorphos was impacted by the Double Asteroid Redirection Test (DART) mission and will be further investigated by Hera, remains debated in terms of its meteorite analog. In addition, few studies have linked the spectral variations caused by the DART impact to meteorite analogs.
Aims. This study determines the mineralogical composition and meteorite analog of the Didymos system. It also seeks to investigate the differences between the spectral effects of grain size and space weathering among different types of meteorites, and to use these relationships to interpret the spectral variations observed in the Didymos system.
Methods. We used self-established calibration equations to infer the surface composition of Didymos from its spectral data. Band parameters and mineralogical parameters were derived and compared with meteorite samples.
Results. The derived band parameters and mineralogical estimates indicate that Didymos is most consistent with L ordinary chondrites, favoring type 6, with an LL subtype being less likely. For H and L chondrites, ratio spectra can help assess whether the slope variations in the asteroid system or surface are primarily dominated by the grain size effect. However, for LL chondrites, the situation is more complex, as these two effects cannot be easily distinguished. The spectrum-estimated exposure age of Didymos (~0.39 Myr) is consistent with the surface crater retention age of Dimorphos.
Conclusions. Didymos most likely originates from the highly metamorphosed inner regions of the L chondrite parent body. Based on this identification, the spectral variations in the Didymos system are interpreted as being dominated by space weathering rather than by grain size or compositional differences. The exposure age of Didymos further supports a rotational fission origin for the binary system.
Key words: techniques: spectroscopic / meteorites, meteors, meteoroids / minor planets, asteroids: general / minor planets, asteroids: individual: (65803) Didymos
© The Authors 2026
 Open Access article, published by EDP Sciences, under the terms of the Creative Commons Attribution License (https://creativecommons.org/licenses/by/4.0), which permits unrestricted use, distribution, and reproduction in any medium, provided the original work is properly cited.
This article is published in open access under the Subscribe to Open model. This email address is being protected from spambots. You need JavaScript enabled to view it. to support open access publication.
1 Introduction
Identifying the meteorite analogs and mineral compositions of asteroids contributes to our understanding of their origin and evolution. Moreover, such information is essential for planning and evaluating planetary defense missions, as it provides insights into key physical properties of asteroids, such as density, strength, and porosity. It is also valuable for exploring potential space resources. However, as the target of the DART and Hera missions, the meteorite analog of the Didymos system remains under debate (Dunn et al. 2013; Ieva et al. 2024; Rivkin et al. 2023; Polishook et al. 2023; Ieva et al. 2022). Didymos system exhibits characteristics of an S-type asteroid (de León et al. 2006, 2010), and its meteorite analog is considered to be ordinary chondrites (Dunn et al. 2013). Nevertheless, the specific subtype (H, L, or LL) and the precise petrologic type are still debated.
Ordinary chondrites are primarily composed of minerals such as olivine (ol), orthopyroxene (opx), clinopyroxene (cpx), plagioclase, kamacite and taenite. They are classified into three groups – H, L, and LL – based on the abundance of Fe and the ratio of metallic iron (Fe0) to oxidized iron (FeO), with H chondrites having the highest Fe and highest Fe0/FeO ratios, and LL chondrites the lowest (Weisberg et al. 2006). In equilibrated ordinary chondrites (petrologic types 4–6), the fayalite (Fa) content in olivine and ferrosilite (Fs) content in low-Ca pyroxene show good homogeneity. For each subtype, these two mineralogical parameters fall within distinct, non-overlapping ranges, allowing them to be distinguished (Brearley & Jones 1998). In addition, Dunn et al. (2010b) found that the ol/(ol + px) (ratio of olivine to olivine + pyroxene) for each subtype falls within a certain range, and that combining ol/(ol + px) with Fa and Fs enables the meteorite subtype to be determined.
Visible and near-infrared (VNIR) spectroscopy is an effective method of determining the mineral composition of meteorites and asteroids (Reddy et al. 2015; Gaffey et al. 2002). The absorption features of olivine and pyroxene near 1 μm (Band I) and 2 μm (Band II) are diagnostic characteristics of ordinary chondrites. Olivine exhibits a broad and asymmetric absorption feature near 1 μm, which is composed of three overlapping absorption peaks and is caused by Fe2+ ions in the M1 and M2 sites of the olivine crystal lattice (Burns 1970). With increasing fayalite content (mol% Fa), the absorption band shifts toward longer wavelengths (King & Ridley 1987). The pyroxenes in ordinary chondrites are type B pyroxenes; namely, low-calcium pyroxenes, pigeonites, and lower-calcium-content high-calcium pyroxenes. These pyroxenes are characterized by narrow and symmetric absorption bands near 1 μm and 2 μm, caused by Fe2+ located in the M2 site. As Ca2+ and Fe2+ substitute for Mg2+ in the lattice, the two absorption band centers of pyroxene shift toward longer wavelengths (Adams 1974; Burns et al. 1972; Cloutis 1985). Cloutis et al. (1986) measured the reflectance spectra of olivine-orthopyroxene mixtures and correlated the band area ratio (BAR) with opx/(ol + opx). Based on the spectra and mineral compositions of 48 ordinary chondrites, Dunn et al. (2010a,b,c) derived calibration equations relating ol/(ol + px) to the BAR, and Fa and Fs to the Band I center (BIC). Mineralogical parameters derived from band parameters can be compared with the compositional ranges of the three subtypes of ordinary chondrites to identify the specific meteoritic analog subtype.
Different band parameter analysis (BPA) methods, such as variations in the selection of red and blue edges or in the definition of band centers, can lead to inconsistencies in the calculated band parameters (Lindsay et al. 2016; Wu et al. 2018; Mitchell et al. 2020; Sanchez et al. 2020). Therefore, it is important to establish and apply self-consistent calibration equations (McClure & Lindsay 2022). Moreover, the ordinary chondrite samples used to establish the previous calibration equations were relatively limited, and samples containing both spectral and mineralogical information are difficult to obtain. Expanding the sample set would improve constraints on their mineralogical characteristics and yield more accurate results (McClure & Lindsay 2022).
Equally noteworthy is that effects such as space weathering, grain size, and compositional differences can significantly modify the spectral characteristics, thereby influencing the derived composition. Therefore, the spectral variations induced by the DART impact have also attracted wide attention from researchers (Polishook et al. 2023). At the same time, distinguishing between the effects of space weathering and grain size among different meteorite analogs remains challenging when relying solely on spectral data (MacLennan et al. 2024).
In this study, we first analyzed the spectral changes of the Didymos system before and after the DART impact, and compared the effects of grain size and space weathering across different meteorite analogs. A large dataset of meteorite spectra and their corresponding mineralogical parameters was then compiled to derive new mineralogical calibration equations. These equations were subsequently applied to determine the mineralogical compositions and meteorite analogs of the Didymos surface and the ejecta from Dimorphos. These results provide new insights into the origin and evolution of the Didymos system and contribute to assessing the effects of the DART impact.
2 Data and methodology
2.1 Spectral observations of the Didymos system
Seven VNIR spectra of the Didymos system reported by Polishook et al. (2023) were used in this study (Fig. 1). These spectra were obtained with the NASA Infrared Telescope Facility (IRTF) and SpeX (Rayner et al. 2003) during seven consecutive nights, spanning from September 26 (the night before the DART impact) through October 2, 2022. For convenience, they are hereafter referred to by their observation dates as 0926, 0927, 0928, 0929, 0930, 1001, and 1002. In addition, the VNIR spectrum of Didymos acquired in 2004 by de León et al. (2006) is shown in Fig. 1 for comparison. All spectra were normalized at 0.77 μm.
The IRTF/SpeX observational range nominally spans 0.7–2.45 μm, but the 0.7–0.8 μm region is sometimes unreliable; therefore, the usable wavelength range must be defined according to the specific observation (Polishook, priv. comm.). Compared with the de León spectrum, different wavelength ranges were retained for the seven spectra reported by Polishook et al. (2023). As shown in Fig. 1, the spectra obtained during the first three nights were retained over 0.765–2.45 μm, while those from the subsequent four nights were retained over 0.7–2.45 μm. Under this definition of the blue edge, the Polishook spectra exhibit strong consistency with the de León spectrum in the visible region, indicating that the data are reliable. Since the maximum of the de León spectrum near 0.75 μm is located at 0.771 μm (de León et al. 2010), the adopted wavelength ranges for the Polishook spectra encompass this feature, ensuring that the spectral analysis is not affected.
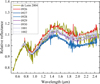 |
Fig. 1 Seven VNIR spectra (obtained by Polishook et al. 2023) of the Didymos system before and after the DART impact. The de León spectrum is also plotted for comparison. All spectra were normalized at 0.77 μm. |
2.2 Spectra and mineralogical compositions of meteorite analogs
A dataset of 81 ordinary chondrites containing both spectral and mineralogical information was compiled. The selected ordinary chondrites were, as far as possible, chosen to have similar grain sizes and to be falls. Among them, 53 provide ol/(ol+px) values, 76 provide Fa values, and 70 provide Fs values. The dataset is approximately twice the size of that used by Dunn et al. (2010b) and was employed to derive new calibration equations. The spectra of these meteorites were obtained from the NASA RELAB database (updated December 31, 2025, Pieters & Hiroi 2004)1, and their detailed information is recorded in Table A.1.
To distinguish the influences of space weathering and grain size on the spectra of different meteorite analogs, we compiled a meteorite dataset comprising 34 samples and 79 spectra (Table A.2). The dataset covers all petrologic types within the three ordinary chondrite subtypes (H, L, and LL). These laboratory spectra were obtained from the NASA RELAB database and the Centre for Terrestrial and Planetary Exploration (C-TAPE) collection2 and were restricted to measurements from the same meteorite portion at multiple particle-size bins, where spectra differ primarily by sieving to minimize composition-related effects. Except for two spectra from the C-TAPE collection for which the temperature was not recorded, all measurements were acquired at a phase angle of 30° and at room temperature.
2.3 Band parameter analysis methods
The spectra of asteroids and meteorites were denoised using cubic spline smoothing, followed by the removal of the linear continuum for the two absorption bands. For Band I, the left end-point of the linear continuum was defined as the local maximum near 0.75 μm, and the right endpoint was defined as the tangent point obtained by drawing a tangent from the left endpoint toward the region near 1.5 μm. For Band II, the right endpoint of the linear continuum was defined as the point at 2.4 μm, and the left endpoint was defined as the tangent point obtained by drawing a tangent from the right endpoint toward the region near 1.5 μm. In this work, the right endpoint of Band II was set to 2.4 μm because, in near-Earth space, the reflectance spectra of silicate surfaces are non-negligibly affected by thermal emission beyond 2.4 μm (Wu et al. 2021). The slope of each absorption band is defined as the slope of its linear continuum, and the band width is defined as the wavelength difference between the right and left endpoints.
After continuum removal, the lower 30% of Band I and Band II were fit with a fifth-order polynomial and a sixth-order polynomial, respectively. The band center is defined as the minimum of the polynomial, and the band depth is defined as the depth at this minimum. The uncertainties of the band parameters for the asteroid spectra were estimated using a Monte Carlo approach. Specifically, Gaussian noise consistent with the measured spectral uncertainties was added to the reflectance values, and the band parameters were recalculated 10 000 times. The final parameter values correspond to the mean of these simulations, while the associated uncertainties were defined as the standard deviations of the resulting distributions. The uncertainties were estimated only for the asteroid spectra, as the meteorite spectra have sufficiently high signal-to-noise ratios.
3 Results
3.1 Calibration formulae for mineralogical parameters
Table B.1 presents the band parameters of the meteorite spectra used in this study. By correlating these parameters with the mineralogical parameters in Table A.1, a set of mineralogical calibration equations was established.
3.1.1 Calibration equation for ol/(ol + px)
Consistent with the previous study (Dunn et al. 2010b), we found that ol/(ol + px) is inversely correlated with BAR. Figure 2 shows the linear regression of ol/(ol + px) as a function of BAR, together with the calibration line reported by Dunn et al. (2010b) for comparison. The two lines are very similar; the small offset mainly reflects the different Band II red edge choices adopted in the two BPA methods, namely 2.4 μm in this work and 2.5 μm in Dunn et al. (2010b). Because using 2.4 μm yields slightly smaller BAR values, our fit line lies slightly to the left of theirs. A least-squares fit of the data yields the calibration equation for ol/(ol + px):
![Mathematical equation: $\[o l /(o l+p x)=-0.2720 \times B A R+0.7176,\]$](/articles/aa/full_html/2026/06/aa58039-25/aa58039-25-eq1.png) (1)
(1)
with an R2 value of 0.67 and a root mean square error of the spectrally derived ol/(ol + px) ratios is 0.035.
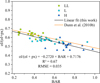 |
Fig. 2 Linear regression of ol/(ol + px) as a function of BAR. The linear fit derived in this work is also shown in the figure. |
3.1.2 Calibration equations for Fa and Fs
Different from Dunn et al. (2010b), we found that using a cubic polynomial provides a better fit for Fa and Fs as a function of BIC, which results from differences in BPA methods. It should be noted that, as in Dunn et al. (2010b), eight outlier samples were excluded from the fitting. Their names are indicated in italics in Table B.1. In addition, two samples (Apt and Dhurmsala) have Fs values that slightly exceed the range defined by Brearley & Jones (1998), and thus were not included in the fitting process.
Figure 3 shows the cubic polynomial fit of Fa and Fs as a function of BIC, together with the calibration curves reported by Dunn et al. (2010b) for comparison. The differences mainly arise because Dunn et al. (2010b) used a quadratic polynomial to determine BIC, whereas we used a quintic polynomial, which better traces the band shape; the quadratic fit tends to place the band center slightly at longer wavelengths, so our curve lies slightly to the left of theirs. A least-squares fit of the data yields the calibration equations for Fa and Fs:
![Mathematical equation: $\[\begin{aligned}F a= & 20650.7630 \times \mathrm{BIC}^3-62305.0382 \times \mathrm{BIC}^2 \\& +62652.1517 \times \mathrm{BIC}-20967.4036,\end{aligned}\]$](/articles/aa/full_html/2026/06/aa58039-25/aa58039-25-eq2.png) (2)
(2)
![Mathematical equation: $\[\begin{aligned}F s= & 16244.5059 \mathrm{BIC}^3-48922.5036 \mathrm{BIC}^2 \\& +49102.6019 \mathrm{BIC}-16399.5173,\end{aligned}\]$](/articles/aa/full_html/2026/06/aa58039-25/aa58039-25-eq3.png) (3)
(3)
where Fa and Fs are in mol% and BIC is in μm, with R2 values of 0.85 and 0.83 and RMSE of 1.60 and 1.26 for the spectrally derived Fa and Fs, respectively.
3.2 Spectral changes of the Didymos system during the DART impact
Following the DART impact, the contribution of Dimorphos ejecta to the Didymos system spectrum decreased from 64% in the 0927 spectrum to 23% in the 1002 spectrum. Polishook et al. (2023) reported that the system’s spectral slopes, derived from linear fits to the reflectance spectrum over 0.8–2.45 μm and 0.8–1.5 μm, decreased during the first two postimpact days and then gradually returned to the pre-impact level over the following nights. Here we obtained the linear continuum slope of Band I (BIS), computed between the left endpoint and the right endpoint of Band I, for the same seven spectra, and found the same temporal evolution: BIS decreases during the first two post-impact days and subsequently recovers toward the pre-impact value (Table 1; Fig. 1). This behavior may result from differences in the degree of space weathering and/or grain size between the ejecta from Dimorphos and the surface of Didymos.
The ratio spectrum, i.e., the ratio of one spectrum to another, is an effective method of investigating spectral differences (Gaffey & Gilbert 1998; Brunetto et al. 2006; Mahlke et al. 2023). Experimental studies simulating solar wind irradiation indicate that solar-wind-induced space weathering primarily affects the continuum of the spectrum, while exerting negligible influence on absorption features (Brunetto et al. 2006; Strazzulla et al. 2005; Brunetto & Strazzulla 2005). Dividing the weathered spectrum by the unweathered spectrum yields a ratio spectrum that exhibits a convex upward shape. This curve can be well described by the following equation (Brunetto et al. 2006):
![Mathematical equation: $\[W(\lambda)=K ~\exp~ \left(\frac{C_S}{\lambda}\right),\]$](/articles/aa/full_html/2026/06/aa58039-25/aa58039-25-eq4.png) (4)
(4)
where W (λ) is the weathering function, i.e., the ratio between the weathered and unweathered spectra, λ is the wavelength, and K is a scaling factor that varies with spectral normalization. The parameter CS is negative, representing the curvature of the exponential function, and serves as an indicator of the degree of weathering. A larger absolute value of CS corresponds to a stronger curvature of the weathering function, indicating a higher degree of weathering. Brunetto et al. (2006) noted that the model works well over 0.3–2.0 μm, whereas in the 2.0–2.5 μm region the fit becomes less accurate, with deviations typically smaller than about 5%.
Few studies have investigated grain size effect using ratio spectra, and it is challenging to distinguish space weathering effect and grain size effect from spectra. In this section, we attempt to use ratio spectra to distinguish space weathering effect and grain size effect, and apply these findings to interpret the spectral variations in the Didymos system.
Band parameters and mineralogical parameters inferred from seven spectra of the Didymos system, as well as their mean values.
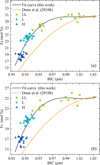 |
Fig. 3 Cubic polynomial regression of BIC vs. Fa and Fs. |
3.2.1 The ratio spectra of the Didymos system
Figure 4 shows the ratio spectra of the other six spectra with respect to the 0927 spectrum. If these spectral variations are entirely caused by space weathering, then according to Eq. (4), these ratio spectra can be expressed as
![Mathematical equation: $\[\frac{R_a(\lambda)}{R_{0927}(\lambda)}=\frac{W_a(\lambda)}{W_{0927}(\lambda)}=\frac{K_a}{K_{0927}} ~\exp~ \left(\frac{C_{S a}-C_{S ~0927}}{\lambda}\right),\]$](/articles/aa/full_html/2026/06/aa58039-25/aa58039-25-eq5.png) (5)
(5)
where a denotes one of the other six spectra.
Figure 4 presents the results of least-squares fitting of the six ratio spectra using Eq. (5). The ratio spectra are well fit by Eq. (5), and no distinct 1 μm or 2 μm absorption features are observed.
However, the grain size effect can also produce similar shapes in the ratio spectra. Space weathering causes asteroid spectra to become redder and darker, whereas smaller grain sizes may make them redder and brighter (Brunetto et al. 2006; MacLennan et al. 2024). Therefore, it is difficult to distinguish between these two effects based solely on spectral slope, and a further discussion is provided in the next section.
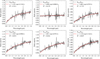 |
Fig. 4 Ratio spectra of the other six Didymos system spectra relative to 0927 spectrum. |
3.2.2 The ratio spectra of the meteorite samples
By dividing the spectrum of the smaller grain size fraction by that of the larger grain size fraction, ratio spectra were obtained and fit using Eq. (5) (Fig. 5). To facilitate a comparison with the spectra of the Didymos system, the range of these ratio spectra is restricted to 0.7–2.4 μm. The CSa − CS0927 values derived from Eq. (5) are labeled beside each ratio spectrum.
As shown in Figs. 5a and b, the spectral variations caused by the grain size effect in H and L chondrites cannot be described by Eq. (5). Most samples exhibit similar behaviors over the 0.7–2.4 μm range: these ratio spectra lie above the fitting curve near 1 μm and 2 μm, which are denoted as “peaks” in this study, but fall below the fitting curve between 1 and 2 μm. This behavior may result from the fact that the spectra with larger grain sizes, used as the denominator, exhibit deeper absorption bands near 1 μm and 2 μm. In a few cases, a pronounced peak near 1 μm can yield positive fit CS values.
This characteristic behavior is consistent with the grain-size trends reported by MacLennan et al. (2024). MacLennan et al. (2024) reported a clear grain-size dependence of the BIS: the smallest grain-size bin exhibits the largest (reddest) slopes, and the BIS distributions generally shift toward lower (bluer) values for coarser size bins (see their Fig. 2a). Their Fig. 2b further indicates that within powdered samples, larger grain sizes tend to exhibit deeper Band I absorptions. They also noted that BIS is sensitive to space weathering; therefore, BIS-based indices can complicate interpretations when grain-size variations and space weathering are both relevant.
In our ratio-spectral analysis restricted to 0.7–2.4 μm, the fit slope may be influenced by absorption band depth variations; however, when a larger-grain spectrum is used as the denominator, deeper absorptions in the denominator naturally generate the two prominent peaks near 1 and 2 μm. Therefore, this peak-bearing ratio-spectral morphology provides an additional indicator beyond a single BIS parameter for distinguishing grain size effects from space weathering in H and L chondrites (Fig. 5).
In contrast, for LL chondrites, the grain size effect is more complex. As is shown in Fig. 5c, approximately one third of the ratio spectra of LL chondrites do not exhibit the two peaks mentioned above. Moreover, despite some deviations, the fitting using Eq. (5) still performs well for these spectra. This indicates that, for LL chondrites, it is difficult to distinguish between grain size effect and space weathering effect based solely on the ratio spectra.
Therefore, identifying the specific meteoritic analog subtype is crucial for understanding the spectral variations in the Didymos system and the surfaces of other ordinary chondrite-like asteroids. For H and L chondrites, ratio spectra can help assess whether the slope variations in the asteroid system or surface are primarily dominated by grain size effect or by space weathering. However, for LL chondrites, the situation is more complex and warrants further investigation in future studies. We believe that this method of distinction should also be applicable to some other meteorite analogs that exhibit spectral absorption features, which is worth investigating in the future.
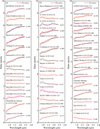 |
Fig. 5 Ratio spectra of ordinary chondrites with different grain sizes, obtained by dividing the spectrum of the smaller grain size fraction by that of the larger grain size fraction, and fit using the weathering function defined by Eq. (5). (a) Thirteen ratio spectra of H chondrites from 10 meteorites; (b) fourteen ratio spectra of L chondrites from 9 meteorites; (c) sixteen ratio spectra of LL chondrites from 15 meteorites. For clearer visualization, the spectra are appropriately scaled and vertically offset. The CSa − CS0927 values derived from Eq. (5) are labeled beside each ratio spectrum. The poor fit indicates that the weathering function is not suitable for describing grain size effects. |
3.3 Meteorite analog and mineral composition of Didymos
The reddening of spectra is the main cause of the mismatch between asteroid spectra and meteorites in band parameters. To obtain accurate spectral parameters, the spectra of Didymos were de-reddened using Eq. (4) so that their Band I continuum slopes matched the average slope (0.029 μm-1) calculated from ordinary chondrite spectra that were normalized at 0.55 μm. The band parameters (BIS, BIC, and BAR, with their associated uncertainties) were computed from the Didymos spectra, with BIS measured on the original spectra to quantify reddening, BIC and BAR measured on the de-reddened spectra; BIC and BAR were then used in Eqs. (1–3) to derive the corresponding mineralogical parameters, as summarized in Table 1. The derived BIC and BAR values are in good agreement with those reported by Polishook et al. (2023); the small differences reflect methodological variations among different BPA methods, underscoring the importance of using self-consistent calibration relations.
Figure 6 shows the projections of seven spectra of the Didymos system in the Fa vs. ol/(ol + px) and Fs vs. ol/(ol + px) plots, along with their average values. Error bars represent the quoted uncertainties, defined as the standard deviations of the seven individual estimates derived from the seven spectra. The solid-line boxes in the figure represent the ranges of measured mineralogical parameters for the three subtypes, as reported by Brearley & Jones (1998) and Dunn et al. (2010b), while the dashed-line boxes denote the ranges considering the RMSE values given by the calibration equations, with RMSEs of 0.035 for ol/(ol + px), 1.60 for Fa, and 1.26 for Fs. The mineralogical ranges of these seven spectra are highly concentrated and largely fall within the L chondrite field; although the uncertainties allow some overlap with the LL field in Fa and Fs, the ol/(ol + px) constraint keeps Didymos outside the LL region, so an L chondrite analog is favored, while an LL subtype cannot be strictly ruled out.
By comparing the absorption depth ratios in the near-infrared spectra, Abe et al. (2006) successfully predicted the meteorite analog and petrologic type of Itokawa. In this study, we adopted their definition of band parameters, calculated the absorption depth ratios at 1.05 μm and 1.15 μm relative to 0.9 μm for meteorites, and projected the Didymos spectra onto the plot (Fig. 7). The three types of ordinary chondrites are clearly distinguishable in Fig. 7a, with only a few overlaps. The Didymos spectra are located within the L chondrite region and close to the boundary with the LL field, consistent with the results shown in Fig. 6. However, unlike Abe et al. (2006), when additional meteorite sample data are included, the petrologic types are less distinctly separated, although the overall trend remains the same as in Fig. 4 of Abe et al. (2006), with petrologic types increasing toward the upper right. For a more detailed comparison, Fig. 7b shows only L chondrites and the Didymos system. In this plot, Didymos occupies the upper right region of the L chondrite field, where it is surrounded by six L6 data points and one L5 data point. The L5 point appears to be an outlier and lies close to the boundary with the LL field. Therefore, the available data suggest that Didymos is most consistent with highly metamorphosed L chondrites, most similar to L6, although a type 5 interpretation cannot be entirely excluded.
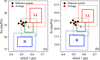 |
Fig. 6 Projection of mineralogical parameters derived from seven spectra of the Didymos system. (a) Projection in the Fa vs. ol/(ol + px) space. (b) Projection in the Fs vs. ol/(ol + px) space. The mean values of these parameters are also shown, with error bars representing the standard deviations of the seven individual estimates derived from the seven spectra. The solid-line boxes in the figure represent the ranges of measured mineralogical parameters for the three subtypes (Brearley & Jones 1998; Dunn et al. 2010b), while the dashed-line boxes denote the ranges considering the RMSE values given by the calibration equations, with RMSEs of 0.035 for ol/(ol + px), 1.60 for Fa, and 1.26 for Fs. |
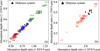 |
Fig. 7 Absorption depth ratios at 1.05 and 1.15 μm relative to 0.9 μm of the Didymos spectra. (a) Comparison with H (red), L (blue), and LL (green) chondrites. (b) Detailed comparison with L chondrites, where L6, L5, and L4 are shown in red, orange, and yellow, respectively, indicating increasing degrees of thermal metamorphism. |
4 Discussion
4.1 The causes of spectral variations in the Didymos system
Section 3.2 indicates that the spectral changes in the Didymos system can be well described by Eq. (5). However, the interpretation of asteroid spectral variations depends on its meteorite analog. Section 3.3 indicates that the meteorite analog of the Didymos system is most consistent with L ordinary chondrites, with a minor possibility of LL, suggesting that the ratio spectra can help distinguish between the effects of space weathering and grain size on Didymos. If the spectral changes of the Didymos system were dominated by space weathering, its ratio spectra would be expected to be well described by Eq. (5), and no peaks would appear at 1 μm and 2 μm. In contrast, such features are not observed in Fig. 4. Therefore, the spectral changes of Didymos are more likely dominated by space weathering, although minor contributions from grain size effects cannot be entirely excluded.
4.2 Formation of the Didymos binary system
The mineral compositions derived from the seven spectra of the Didymos system are highly similar (Sect. 3.3), and the spectral variations are primarily caused by space weathering rather than grain size effect or compositional differences (Sect. 4.1), indicating that Didymos and Dimorphos are compositionally homogeneous, consistent with the hypothesis that the Didymos system formed via rotational fission (Pajola et al. 2024; Barnouin et al. 2024).
Further support comes from the surface exposure age of Didymos. Rotational fission is an effective mechanism for refreshing asteroid surfaces (DeMeo et al. 2023). If Dimorphos originated from material ejected from Didymos, the surface exposure age of Didymos and the surface crater retention age of Dimorphos should be consistent. The CS value was originally introduced to characterize the degree of space weathering and is linked to the exposure age of asteroids (Brunetto et al. 2006). Given that the spectral variations in the Didymos system are primarily governed by space weathering, the exposure age of Didymos can likewise be inferred from the CS value of the 0926 spectrum. Applying the method of Brunetto et al. (2006), the exposure age of Didymos was estimated to be ~0.39 Myr (see Appendix C for details of the calculation). Recent studies indicate that the surface crater retention age on Dimorphos is 0.09–0.3 Myr (Barnouin et al. 2024), which is consistent with the exposure age derived in this work. This provides new evidence supporting the hypothesis that Didymos formed through rotational fission. The derived exposure age constrains the timing of the major mass-shedding event experienced by Didymos to approximately 0.39 Myr ago.
4.3 Meteorite analog and origin of Didymos system
The meteorite analog of the Didymos system is most consistent with L ordinary chondrites, and the derived band parameters suggest a highly metamorphosed petrologic type, most similar to L6. According to the onion-shell model, regions closer to the center of the L chondrite parent body experienced higher degrees of thermal metamorphism, corresponding to higher petrologic types (Gail & Trieloff 2019). This suggests that the Didymos system originated from the highly thermally metamorphosed inner regions of an L chondrite parent body.
5 Conclusions
Based on the analyses conducted in this study, we characterized the spectral changes of the Didymos system and identified the corresponding meteorite analogs, which are essential for interpreting these variations. By compiling an extensive dataset of meteorite spectra along with their mineralogical parameters, we derived new calibration equations that were applied to determine the mineralogical compositions of the Didymos system. The following conclusions are drawn from this study:
- (1)
The meteorite analog of Didymos is most consistent with L ordinary chondrites. The derived band parameters further suggest a highly metamorphosed petrologic type, most similar to L6, although type 5 cannot be entirely excluded, indicating that Didymos experienced extensive thermal metamorphism and suggesting that the Didymos system originated from the highly thermally metamorphosed inner regions of the L chondrite parent body;
- (2)
For H and L chondrites, ratio spectra can help assess whether the slope variations in the asteroid system or surface are primarily dominated by the grain size effect. However, for LL chondrites, the situation is more complex, as these two effects cannot be easily distinguished. Based on the ratio spectra of the Didymos system, it can be concluded that the spectral changes of Didymos are primarily dominated by space weathering rather than by grain size effect or compositional differences;
- (3)
The surface of Didymos has an exposure age of ~0.39 Myr, which is consistent with the recently reported surface crater retention age on Dimorphos. This suggests that ~0.39 Myr ago the primary may have undergone a large-scale mass-shedding event that simultaneously reset the surface crater retention age of Dimorphos and the exposure age of Didymos, providing new evidence supporting the rotational fission mechanism as the formation process of the Didymos system.
These results provide useful insights into the origin and evolution of the Didymos system and contribute to understanding the effects of the DART impact.
Acknowledgements
This research was supported by the Macau Science and Technology Development Fund (0094/2024/RIA2), the Natural Science Foundation of Jiangsu Province (BK20252110), National Natural Science Foundation of China (12150009) and the Foundation of Minor Planets of the Purple Mountain Observatory. We thank David Polishook (Weizmann Institute of Science) for kindly providing the near-infrared spectral data of the Didymos system. This research utilizes spectra acquired by various investigators with the NASA RELAB facility at Brown University. We thank Edward Cloutis for providing laboratory spectra from the C-TAPE collection and for helpful assistance with the dataset, and we acknowledge C-TAPE at the University of Winnipeg for access to laboratory spectral data.
References
- Abe, M., Takagi, Y., Kitazato, K., et al. 2006, Science, 312, 1334 [Google Scholar]
- Adams, J. B. 1974, J. Geophys. Res., 79, 4829 [NASA ADS] [CrossRef] [Google Scholar]
- Barnouin, O., Ballouz, R.-L., Marchi, S., et al. 2024, Nat. Commun., 15, 6202 [Google Scholar]
- Brearley, A. J., & Jones, R. H. 1998, Rev. Mineral. Geochem., 36, 3 [Google Scholar]
- Brunetto, R., & Strazzulla, G. 2005, Icarus, 179, 265 [NASA ADS] [CrossRef] [Google Scholar]
- Brunetto, R., Vernazza, P., Marchi, S., et al. 2006, Icarus, 184, 327 [CrossRef] [Google Scholar]
- Burbine, T. H., McCoy, T. J., Jarosewich, E., & Sunshine, J. M. 2003, Antarct. Meteorite Res., 16, 185 [Google Scholar]
- Burns, R. G. 1970, Am. Mineral., 55, 1608 [Google Scholar]
- Burns, R. G., Huggins, F. E., & Abu-Eid, R. M. 1972, Moon, 4, 93 [Google Scholar]
- Cloutis, E. A. 1985, Master’s thesis, University of Hawai’i at Manoa [Google Scholar]
- Cloutis, E. A., Gaffey, M. J., Jackowski, T. L., & Reed, K. L. 1986, J. Geophys. Res., 91, 11641 [NASA ADS] [CrossRef] [Google Scholar]
- de León, J., Licandro, J., Duffard, R., & Serra-Ricart, M. 2006, Adv. Space Res., 37, 178 [CrossRef] [Google Scholar]
- de León, J. d., Licandro, J., Serra-Ricart, M., Pinilla-Alonso, N., & Campins, H. 2010, A&A, 517, A23 [CrossRef] [EDP Sciences] [Google Scholar]
- DeMeo, F. E., Marsset, M., Polishook, D., et al. 2023, Icarus, 389, 115264 [NASA ADS] [CrossRef] [Google Scholar]
- Dunn, T. L., Cressey, G., McSWeen Jr, H. Y., & McCOY, T. J. 2010a, Meteorit. Planet. Sci., 45, 123 [Google Scholar]
- Dunn, T. L., McCoy, T. J., Sunshine, J. M., & McSween, H. Y. 2010b, Icarus, 208, 789 [NASA ADS] [CrossRef] [Google Scholar]
- Dunn, T. L., McSween Jr, H. Y., McCOY, T. J., & Cressey, G. 2010c, Meteorit. Planet. Sci., 45, 135 [Google Scholar]
- Dunn, T. L., Burbine, T. H., Bottke, W. F., & Clark, J. P. 2013, Icarus, 222, 273 [NASA ADS] [CrossRef] [Google Scholar]
- Gaffey, M. J., & Gilbert, S. L. 1998, Meteorit. Planet. Sci., 33, 1281 [NASA ADS] [CrossRef] [Google Scholar]
- Gaffey, M., Cloutis, E., Kelley, M., & Reed, K. 2002, Mineralogy of Asteroids (University of Arizona Press), 183 [Google Scholar]
- Gail, H.-P., & Trieloff, M. 2019, A&A, 628, A77 [NASA ADS] [CrossRef] [EDP Sciences] [Google Scholar]
- Gomes, C. B., & Keil, K. 1980, Brazilian stone meteorites: with a brief, general introduction on the significance, classification, mineralogy, bulk composition, and recognition of stone meteorites (Albuquerque: University of New Mexico Press) [Google Scholar]
- Heyse, J. V. 1978, Earth Planet. Sci. Lett., 40, 365 [Google Scholar]
- Ieva, S., Epifani, E. M., Perna, D., et al. 2022, Planet. Sci. J., 3, 183 [Google Scholar]
- Ieva, S., Epifani, E. M., Dotto, E., et al. 2024, Planet. Sci. J., 5, 225 [Google Scholar]
- Keil, K., & Fredriksson, K. 1964, J. Geophys. Res., 69, 3487 [Google Scholar]
- King, T. V. V., & Ridley, W. I. 1987, J. Geophys. Res.: Solid Earth, 92, 11457 [Google Scholar]
- Korda, D., Penttila, A., Klami, A., & Kohout, T. 2023, A&A, 669, A101 [NASA ADS] [CrossRef] [EDP Sciences] [Google Scholar]
- Lindsay, S. S., Dunn, T. L., Emery, J. P., & Bowles, N. E. 2016, Meteorit. Planet. Sci., 51, 806 [Google Scholar]
- MacLennan, E. M., Emery, J. P., Lucas, M. P., McClure, L. M., & Lindsay, S. S. 2024, Meteorit. Planet. Sci., 59, 1329 [Google Scholar]
- Mahlke, M., Eschrig, J., Carry, B., Bonal, L., & Beck, P. 2023, A&A, 676, A94 [NASA ADS] [CrossRef] [EDP Sciences] [Google Scholar]
- McClure, L. T., & Lindsay, S. S. 2022, Icarus, 379, 114907 [Google Scholar]
- Mitchell, A. M., Reddy, V., Sharkey, B. N. L., et al. 2020, Icarus, 336, 113426 [Google Scholar]
- Oshtrakh, M. I., Maksimova, A. A., Chukin, A. V., et al. 2019, Spectrochim. Acta A, 219, 206 [Google Scholar]
- Pajola, M., Tusberti, F., Lucchetti, A., et al. 2024, Nat. Commun., 15, 6205 [Google Scholar]
- Pieters, C. M., & Hiroi, T. 2004, in Lunar and Planetary Science Conference, 1720 [Google Scholar]
- Polishook, D., DeMeo, F. E., Burt, B. J., et al. 2023, Planet. Sci. J., 4, 229 [Google Scholar]
- Rayner, J. T., Toomey, D. W., Onaka, P. M., et al. 2003, Publ. Astron. Soc. Pac., 115, 362 [Google Scholar]
- Reddy, V., Dunn, T. L., Thomas, C. A., Moskovitz, N. A., & Burbine, T. H. 2015, Mineralogy and Surface Composition of Asteroids (University of Arizona Press) [Google Scholar]
- Rivkin, A. S., Thomas, C. A., Wong, I., et al. 2023, Planet. Sci. J., 4, 214 [NASA ADS] [CrossRef] [Google Scholar]
- Rubin, A. E. 1990, Geochim. Cosmochim. Acta, 54, 1217 [Google Scholar]
- Sanchez, J. A., Thomas, C., Reddy, V., et al. 2020, Astron. J., 159, 146 [Google Scholar]
- Strazzulla, G., Dotto, E., Binzel, R., et al. 2005, Icarus, 174, 31 [CrossRef] [Google Scholar]
- Weisberg, M. K., McCoy, T. J., & Krot, A. N. 2006, in Meteorites and the Early Solar System II (University of Arizona Press) [Google Scholar]
- Wu, Y., Li, L., Luo, X., et al. 2018, Icarus, 303, 67 [NASA ADS] [CrossRef] [Google Scholar]
- Wu, Y., Kührt, E., Grott, M., et al. 2021, Geophys. Res. Lett., 48, e2020GL089226 [Google Scholar]
Appendix A Meteorite information
Meteorites used in this study and their mineralogical information.
Meteorite spectra with varying grain sizes.
Appendix B Meteorite parameters
Meteorites used in this study and their band parameter.
Appendix C The exposure age of Didymos
Based on the cross-sectional areas of the primary and secondary, before the DART impact, Dimorphos contributed only about 4% of the total reflected light (Ieva et al. 2022). The pre-impact spectrum effectively represents the surface of the primary, therefore, to estimate the surface exposure age of the primary, we used the pre-impact spectrum (0926 spectrum) to calculate CS. As described in Sect. 3.3, by de-reddening the Band I continuum slope of the pre-impact spectrum (0926 spectrum) of Didymos to the mean slope of ordinary chondrite spectra, a CS value of −0.141 μm was obtained. The exposure age t of Didymos can be obtained from this CS value using the weathering model proposed by Brunetto et al. (2006). Laboratory ion irradiation experiments on silicate materials have shown that when the ion fluence is below 1017 ions/cm2, spectral reddening is primarily caused by atomic displacements within the silicate (Brunetto et al. 2006; Strazzulla et al. 2005; Brunetto & Strazzulla 2005). The damage parameter d refers to the number of displacements per unit area (displacements/cm2), and its relationship with the CS value (the damage curve) is given by
![Mathematical equation: $\[C_S=\alpha ~\ln (\beta d+1),\]$](/articles/aa/full_html/2026/06/aa58039-25/aa58039-25-eq6.png) (C.1)
(C.1)
where α = −0.33 μm, β = 1.1 × 10⁻¹⁹ cm2. After the damage parameter d is obtained, the surface exposure age of the asteroid can be calculated using the following equation:
![Mathematical equation: $\[t=2.53 \times 10^{-13}\left(\frac{D}{2.9 ~\mathrm{AU}}\right)^2 d,\]$](/articles/aa/full_html/2026/06/aa58039-25/aa58039-25-eq7.png) (C.2)
(C.2)
where D is the semi-major axis of Didymos (1.64 AU). Substituting the CS value of the 0926 spectrum into Eqs. (C.1) and (C.2) yields an exposure age of t ~ 0.39 Myr (Fig. C.1).
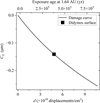 |
Fig. C.1 Damage curve and surface exposure age of Didymos. The top axis shows the corresponding surface exposure age at 1.64 AU, while the bottom axis shows the damage parameter d in 1018 displacements/cm2, which is related to the top axis via Eq. (C.2). The black curve shows the relationship between the damage parameter d and CS, as given by Eq. (C.1), and the black square indicates the measured CS value of the Didymos surface, from which the surface exposure age is estimated. |
All Tables
Band parameters and mineralogical parameters inferred from seven spectra of the Didymos system, as well as their mean values.
All Figures
|
Fig. 1 Seven VNIR spectra (obtained by Polishook et al. 2023) of the Didymos system before and after the DART impact. The de León spectrum is also plotted for comparison. All spectra were normalized at 0.77 μm. |
| In the text | |
|
Fig. 2 Linear regression of ol/(ol + px) as a function of BAR. The linear fit derived in this work is also shown in the figure. |
| In the text | |
|
Fig. 3 Cubic polynomial regression of BIC vs. Fa and Fs. |
| In the text | |
|
Fig. 4 Ratio spectra of the other six Didymos system spectra relative to 0927 spectrum. |
| In the text | |
|
Fig. 5 Ratio spectra of ordinary chondrites with different grain sizes, obtained by dividing the spectrum of the smaller grain size fraction by that of the larger grain size fraction, and fit using the weathering function defined by Eq. (5). (a) Thirteen ratio spectra of H chondrites from 10 meteorites; (b) fourteen ratio spectra of L chondrites from 9 meteorites; (c) sixteen ratio spectra of LL chondrites from 15 meteorites. For clearer visualization, the spectra are appropriately scaled and vertically offset. The CSa − CS0927 values derived from Eq. (5) are labeled beside each ratio spectrum. The poor fit indicates that the weathering function is not suitable for describing grain size effects. |
| In the text | |
|
Fig. 6 Projection of mineralogical parameters derived from seven spectra of the Didymos system. (a) Projection in the Fa vs. ol/(ol + px) space. (b) Projection in the Fs vs. ol/(ol + px) space. The mean values of these parameters are also shown, with error bars representing the standard deviations of the seven individual estimates derived from the seven spectra. The solid-line boxes in the figure represent the ranges of measured mineralogical parameters for the three subtypes (Brearley & Jones 1998; Dunn et al. 2010b), while the dashed-line boxes denote the ranges considering the RMSE values given by the calibration equations, with RMSEs of 0.035 for ol/(ol + px), 1.60 for Fa, and 1.26 for Fs. |
| In the text | |
|
Fig. 7 Absorption depth ratios at 1.05 and 1.15 μm relative to 0.9 μm of the Didymos spectra. (a) Comparison with H (red), L (blue), and LL (green) chondrites. (b) Detailed comparison with L chondrites, where L6, L5, and L4 are shown in red, orange, and yellow, respectively, indicating increasing degrees of thermal metamorphism. |
| In the text | |
|
Fig. C.1 Damage curve and surface exposure age of Didymos. The top axis shows the corresponding surface exposure age at 1.64 AU, while the bottom axis shows the damage parameter d in 1018 displacements/cm2, which is related to the top axis via Eq. (C.2). The black curve shows the relationship between the damage parameter d and CS, as given by Eq. (C.1), and the black square indicates the measured CS value of the Didymos surface, from which the surface exposure age is estimated. |
| In the text | |
Current usage metrics show cumulative count of Article Views (full-text article views including HTML views, PDF and ePub downloads, according to the available data) and Abstracts Views on Vision4Press platform.
Data correspond to usage on the plateform after 2015. The current usage metrics is available 48-96 hours after online publication and is updated daily on week days.
Initial download of the metrics may take a while.