


Fig. C.1
Download original image
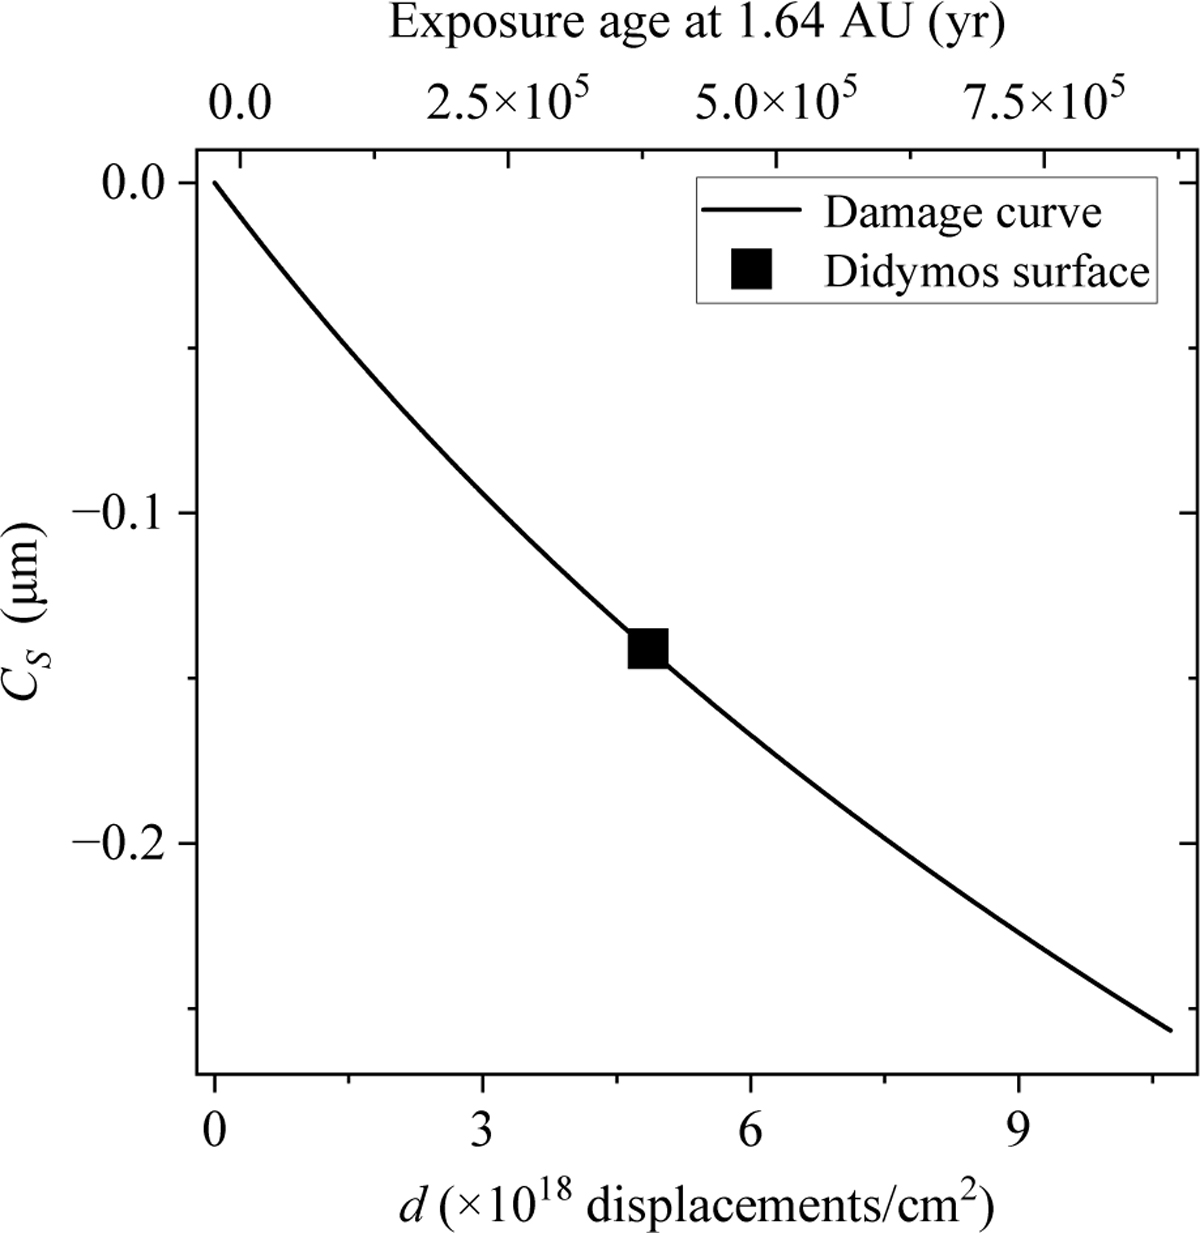
Damage curve and surface exposure age of Didymos. The top axis shows the corresponding surface exposure age at 1.64 AU, while the bottom axis shows the damage parameter d in 1018 displacements/cm2, which is related to the top axis via Eq. (C.2). The black curve shows the relationship between the damage parameter d and CS, as given by Eq. (C.1), and the black square indicates the measured CS value of the Didymos surface, from which the surface exposure age is estimated.
Current usage metrics show cumulative count of Article Views (full-text article views including HTML views, PDF and ePub downloads, according to the available data) and Abstracts Views on Vision4Press platform.
Data correspond to usage on the plateform after 2015. The current usage metrics is available 48-96 hours after online publication and is updated daily on week days.
Initial download of the metrics may take a while.