| Issue |
A&A
Volume 709, May 2026
|
|
|---|---|---|
| Article Number | A261 | |
| Number of page(s) | 8 | |
| Section | Planets, planetary systems, and small bodies | |
| DOI | https://doi.org/10.1051/0004-6361/202557332 | |
| Published online | 22 May 2026 | |
Near-Earth asteroids in main belt-crossing orbits
1
Instituto de Astrofísica de La Plata,
CCT La Plata-CONICET-UNLP. Paseo del Bosque S/N (1900),
La Plata,
Argentina
2
Facultad de Ciencias Astronómicas y Geofísicas, Universidad Nacional de La Plata,
Paseo del Bosque S/N (1900),
La Plata,
Argentina
3
Grupo de Ciencias Planetarias, Dpto. de Geofísica y Astronomía,
FCEFyN, UNSJ - CONICET, Av. J. I. de la Roza 590 oeste, J5402DCS Rivadavia,
San Juan,
Argentina
★ Corresponding author: This email address is being protected from spambots. You need JavaScript enabled to view it.
Received:
19
September
2025
Accepted:
1
April
2026
Abstract
Aims. We study the dynamical and collisional evolution of Near-Earth asteroids (NEAs) in main belt-crossing orbits (NEACs).
Methods. We selected NEACs with H < 18 and integrated their orbits for 107 yr with N-body simulations. Objects were grouped based on their initial semi-major axis (G1: a < 2.06 au; G2: 2.06 < a < 2.5 au; G3: a > 2.5 au). We computed the fraction of each orbit spent within the main belt (MB), dynamical occupancy maps in the (a, e) plane, and median lifetimes. Using collisional evolution, we obtained size-dependent timescales and the change in the NEA size-frequency distribution (SFD) over 1 Myr, along with the impactor and crater SFDs on 150 m to 1 km targets, representative of NEAs visited by space missions.
Results. Median dynamical lifetimes decrease with increasing a : ∼1.3 × 10⁷ yr (G1), ∼2.1 × 10⁶ yr (G2), and ∼0.9 × 10⁶ yr (G3). NEACs in G2-G3 maintain nearly constant MB residence fractions, with short intervals of full containment, while G1 exhibits stronger 0-0.8 oscillations (median ∼0.55 for ∼106 yr). DART-analog impacts occur on ∼105 yr timescales for targets ≲300 m (rising to ∼106 yr for larger bodies), whereas catastrophic collisions are negligible within NEAC lifetimes. Over a timescale of 1 Myr, collisional erosion reduces the metre-sized NEA population by only 0.1-1.4%, depending on Q*D. Comparisons with the observed crater SFDs on Bennu, Didymos, and Ryugu indicate target strengths of Y ≈ 100 Pa for Bennu, young effective surface ages for Didymos, and short craterretention times of the order of 104-105 yr for craters with diameters < 100 m on Ryugu, consistent with rapid resurfacing.
Conclusions. NEACs spend a substantial fraction of their lifetimes inside the MB and undergo frequent small-scale impacts; however, collisions weakly modify the global NEA SFD on Myr timescales. Our combined dynamical-collisional framework constrains NEAC lifetimes, orbital pathways, collisional timescales, and surface processing.
Key words: methods: numerical / methods: statistical / minor planets, asteroids: general
© The Authors 2026
 Open Access article, published by EDP Sciences, under the terms of the Creative Commons Attribution License (https://creativecommons.org/licenses/by/4.0), which permits unrestricted use, distribution, and reproduction in any medium, provided the original work is properly cited.
This article is published in open access under the Subscribe to Open model. This email address is being protected from spambots. You need JavaScript enabled to view it. to support open access publication.
1 Introduction
Near-Earth asteroids (NEAs) are a population of asteroids whose orbits have a perihelion distance, q, of less than 1.3 au. The proximity of NEAs implies that their orbits can intersect Earth’s orbit, which could eventually lead to an impact with our planet.
The source of NEAs is the main belt (MB) located between the orbits of Mars and Jupiter, at distances ranging from ≈2 to ≈4 au. Due to the combined effect of the Yarkovsky effect and orbital resonances with the giant planets, these asteroids have experienced increases in their eccentricities that led them to migrate into the inner Solar System, where they frequently undergo close encounters with the rocky planets (Granvik et al. 2017, 2018). NEAs have lifetimes of up to a few million years and their typical final destinations are impacting the Sun, either by being ejected hyperbolically or colliding with a terrestrial planet (Bottke et al. 2001; Granvik et al. 2018).
Recently, the Double Asteroid Redirection Test (DART) mission was carried out to test the orbital deflection technique through a high-velocity impact. The target of the mission was a binary NEA system, whose primary component is Didymos, a 750 m asteroid and whose secondary component and impact target is Dimorphos (a 150 m asteroid). The DART mission has proven to be highly effective, as it reduced Dimorphos’ orbital period around Didymos by approximately 30 minutes (Thomas et al. 2023) and increased its momentum by a factor of between two and five times the incident momentum of the impact (Cheng et al. 2023).
Within the MB, mutual collisions between asteroids represent an important part of their evolution (Bottke et al. 2015). Depending on the impact energy, these collisions can be cratering or catastrophic. Collisional activity among NEAs is much less intense since their collisional lifetimes, particularly the catastrophic ones, are much longer than their dynamical lifetimes. However, Didymos is an asteroid that spends one-third of its orbit within the MB. In this context, Campo Bagatin et al. (2024) calculated the timescale of potential MB asteroid impacts endured by Didymos and Dimorphos.
In this work, we extend the study conducted by Campo Bagatin et al. (2024) to the entire population of NEAs that cross the MB (hereafter, NEACs), using N -body simulations and collisional evolution calculations. This paper is organised as follows. In Section 2, we analyse the dynamical evolution of NEACs through N -body simulations. In Section 3, we present a collisional study of NEACs, including calculations of collisional timescales and the evolution of the NEA SFD distribution. Section 4 presents an estimation of the impactor flux and cratering rates over 1 Myr on representative targets, such as Bennu and Ryugu. Finally, our main conclusions are summarised in Section 5.
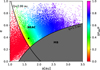 |
Fig. 1 Distribution of semi-major axes a and eccentricities e of NEAs. The colour bar indicates the fraction of time that NEAs spend within the MB relative to their orbital period. The curve q = 1.3 au marks the boundary between NEAs and the MB (gray region), while NEACs correspond to the region to the right of the curve Q = 2.06 au. The black dot indicates the a and e values of Didymos. |
2 Incursions in the MB
In this section, we analyse the dynamical evolution of NEAC orbits. In Fig. 1, we show the semi-major axes, a, and eccentricities, e, of all NEAs, obtained from the Minor Planet Center1. We formally define NEACs as those having an aphelion at a distance of Q > 2.06 au, which corresponds to the inner boundary of the MB. For each NEAC, we computed the time its orbit ventures into the MB using Kepler’s equation,
 (1)
(1)
where E is the eccentric anomaly when the orbit crosses the MB (i.e. r = 2.06), n is the mean orbital motion, P is the orbital period of the asteroid, and ∆PMB is the time inside the MB. The fraction ∆PMB/P is represented by the colourbar in Fig. 1. We found that NEACs spend a mean fraction of 0.6 of their orbital periods within the MB. However, these fractions are calculated using the two-body problem with their current orbital elements. To determine how NEAC orbits and their incursions into the MB evolve over their lifetimes, we performed N-body simulations using the MERCURY code (Chambers 1999).
In these simulations, we considered NEACs with an absolute magnitude of H < 18, where the population is believed to be complete (Tricarico 2017), and we include the eight planets of the Solar System as massive bodies. We classified NEACs into three groups according to the value of a: Group 1 (G1) includes those with a < 2.06 au, Group 2 (G2) those with 2.06 < a < 2.5 au, and Group 3 (G3) those with a > 2.5 au. The number of NEACs in each group is 325, 282, and 290, respectively.
The chosen boundaries, a = 2.06 and a = 2.5 au, correspond to the inner edge of the MB and the location of the 3:1 mean-motion resonance with Jupiter, which separates the inner and middle MB regions (de Elía & Brunini 2007; Zain et al. 2020) and constitutes one of the main sources of NEAs (Bottke et al. 2001 ; Granvik et al. 2018). We used the hybrid integrator of MERCURY and evolve each group of NEACs as massless particles for a maximum time of 3 × 10⁷ years.
Figure 2 shows the percentage of NEACs that escape the simulation as a function of time for each of the three groups defined previously. Escapes are identified when an NEAC either reaches a heliocentric distance greater than 100 au or collides with the Sun or a planet. The vertical lines and solid markers indicate the median dynamical lifetime for each group. A clear dependence on the initial semi-major axis is observed: NEACs from G3 are the most dynamically short-lived, with a median lifetime of ~1 × 10⁶ years, followed by G2 with ~3 × 10⁶ years. In contrast, NEACs from G1 show significantly longer dynamical lifetimes, with a median value close to 2 × 10⁷ years. The shorter lifetimes of NEACs in G2 and G3 can be attributed to stronger gravitational perturbations from the giant planets, particularly Jupiter.
Figure 3 displays the dynamical occupancy maps for all three NEAC groups in the a - e plane over the full integration. The left panel shows that the G1 objects occupy a broadly dispersed region extending from a ≈ 0.5 au up to 3 au and spanning the full eccentricity range. Their orbits are initially belt-crossing and along their evolution, individual G1 objects can reach configurations entirely contained within the MB (q > 1.3 au) or entirely interior to the belt, namely, outside the MB region (Q < 2.06 au). In contrast, G2 NEACs (middle panel of Fig. 3) predominantly act as belt-crossers, yet they can also transiently reach orbits entirely contained within the MB. Survivors beyond 1 Myr end up clustering around a stable region near a ≈ 2.2 au and q ≈ 1.3 au, where they oscillate between belt-crossing and fully confined trajectories; this is a behaviour to resembles that found for G3 (shown in the right panel of Fig. 3). This orbital picture is consistent with the evolution of the fraction of time spent in the MB relative to the orbital period, ∆PMB/P, illustrated in Fig. 4. NEACs from groups G2 (middle panel) and G3 (right panel) maintain a roughly constant fraction of their orbit within the MB over their lifetimes, with median values of ≈0.75 and ≈0.8, respectively. The short vertical segments, where individual curves spike up to ∆PMB/P = 1, highlight intervals where bodies remain fully confined to the MB region for several consecutive time steps before reverting to belt-crossing orbits. In contrast, the evolution is more chaotic for NEACs from G1 (left panel), where the fraction oscillates between 0 (orbits entirely interior to the MB, outside the belt region) and values up to 0.8 (belt-crossing trajectories), with a median that remains at ≈0.55 for approximately 106 yr. Overall, NEACs in our sample can travel back and forth between the MB and the inner Solar System several times, as their orbits alternate between configurations interior to the MB, belt-crossing trajectories, and orbits entirely contained within the belt.
From this first part of the study, we can conclude that NEACs indeed spend a large portion of their time within the MB and, therefore, they can indeed be impacted by MB asteroids. This collisional activity is analysed in the next section.
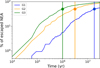 |
Fig. 2 Cumulative percentage of escaped NEACs as a function of time for Groups 1-3. Escapes are defined as reaching a heliocentric distance > 100 au or colliding with the Sun or a planet. Solid lines show the evolution for G1 (blue), G2 (orange), and G3 (green), while vertical dashed lines and markers indicate the median lifetime. |
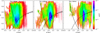 |
Fig. 3 Dynamical occupancy maps in the a - e plane for G1 (left panel), G2 (middle panel) and G3 (right panel). Colours indicate the fraction of total integration time spent in each of the 1000 grid cells. Solid black curves mark perihelion q = 1.3 au and aphelion Q = 2.06 au. Dashed vertical lines denote the group boundaries at a = 2.06 au and a = 2.5 au. |
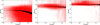 |
Fig. 4 Evolution of the fraction of time spent in the MB relative to the orbital period, ∆PMB/P, for each NEAC (red) and the median at each time step (black) for G1 (left panel), G2 (middle panel), and G3 (right panel). |
3 Collisional activity
3.1 Collisional lifetimes
In this section, we analyse the collisional activity between targets that are NEACs and impactors that are MBAs. A relevant quantity for studying this activity is Q*D, defined as the energy per unit mass required to disperse half of the mass of a target. This quantity marks the energy threshold between cratering and catastrophic collisions.
In this part of the study, we used the formulation proposed by Raducan et al. (2024), who calculated and calibrated Q*D for rubble-piles with different bulk densities and spherical large rock distributions, employing data from the DART mission. These functions are presented in Fig. 5 and show that the energy required to catastrophically break an asteroid varies significantly depending on the volume occupied by large rocks. It is important to note that this property of Dimorphos’ internal structure will remain unknown until the arrival of the Hera mission, which will study the asteroid’s state after the impact. However, to establish a lower bound for catastrophic collisions, we considered the value of Q*D with a large rock bulk density of 30% of the target’s volume. With this value and the impact energy of the DART mission, EDART = 1.094 × 10¹⁰ J (Daly et al. 2023), we can scale QDART, a function that approximates the specific energy required for an impact on an NEA of a given size to be analog to that of DART. The values of Q*D can be converted to the diameters of impactors using  (Bottke et al. 2005), where v is the impact velocity. We adopted v = 7.5 km s−1, as calculated for Didymos by Campo Bagatin et al. (2024).
The impact frequency between a target of size, dtgt, and an impactor of size, dimp, is given by
 (2)
(2)
where P = 1 × 10⁻¹⁷ km-2 yr-1 (Campo Bagatin et al. 2024) is the assumed intrinsic collision probability and the diameters are expressed in km. From this, the characteristic timescale for a collision by an impactor with diameter, dimp, onto a target with diameter, dtgt, is given by
 (3)
(3)
where N(dimp) is the SFD of MB asteroids from Bottke et al. (2020).
We adopted a single representative value of P equal to that derived by Campo Bagatin et al. (2024) for the Didymos system, a NEAC belonging to our G1 group. The intrinsic collision probability depends on the detailed orbital elements of each target, and for Didymos, Campo Bagatin et al. (2024) estimated P = 1 × 10⁻¹⁷ km−2 yr−1 with an uncertainty of about 10%. Since the collision rates scale linearly with P and the collisional lifetimes as τ ∝ P−1, this uncertainty may translate into variations of only ±10% in the derived timescales of this work.
The colour bar in Fig. 6 shows the orders of magnitude governing the collisional timescales for different target-impactor pairs as a function of impactor diameter in the upper panel. The impact energies relative to the DART mission energy are given in the lower panel. Since the dynamic lifetimes of NEAs reach at most a few million years (Granvik et al. 2018), events located below the light blue band, corresponding to 105 years, can occur multiple times during this period. In particular, impacts with the exact DART energy (horizontal line in the lower panel) are frequent in NEACs of all sizes, occurring as often as every 105 years in objects up to 300 m, with shorter timescales as the target diameter increases. In contrast, events located within the blue band, corresponding to 106 years would be limited to a few cases depending on the exact dynamic lifetime of the NEACs. If we consider impacts with energy comparable to DART, these occur on timescales of 105 years for NEACs up to 300 metres; for larger sizes, the timescales increase to 106 years. Likewise, we can rule out the occurrence of catastrophic collisions in NEACs larger than 100 m, as the characteristic timescales for these events exceed 107 years.
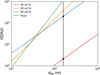 |
Fig. 5 Q*D as a function of target diameter, dtgt, for rubble-pile asteroids with different large-boulder volume fractions (Raducan et al. 2024) and QDART corresponds to the 30% boulder-volume case scaled to the DART impact energy. |
3.2 Change in the NEA SFD
Here, we estimate how the NEA2 SFD evolves due to catastrophic collisions with the MB population over a period of 1 Myr. To do so, we adopted the NEA SFD derived from NEOMOD3 (Nesvorný et al. 2024) and the MB SFD from Bottke et al. (2020). Here, the change in the differential NEA SFD over a single timestep, ∆t, is given by
 (4)
(4)
where the right-hand side represents the number of collisions between targets and projectiles. Here, N(dtgt) and N(dimp) are the differential SFDs of the target and impactor populations, respectively. The negative sign reflects the fact that we only consider the removal of bodies due to catastrophic collisions, defined as those where the specific impact energy Q exceeds the disruption threshold Q*D (i.e. the energy required to disperse more than half the target’s original mass). We did not take into account the fragment generation in collisions, which can increase the number of small bodies in the SFD. We performed simulations using four different prescriptions for the scaling law, Q*D, the basaltic target law from Benz & Asphaug (1999), prescriptions #1 and #8 from Bottke et al. (2020), and the rubble-pile scaling law from Raducan et al. (2024) from Section 3.1.
In Fig. 7, we can see the change in the NEA SFD relative to the NEOMOD3 reference after 1 Myr of collisional evolution. Catastrophic collisions with MB projectiles produce only minor modifications to the NEA population, regardless of the scaling law adopted. In particular, stronger disruption thresholds such as those of Benz & Asphaug (1999) and model #8 from Bottke et al. (2020) result in reductions of up to 0.1% and 0.4%, respectively. Conversely, weaker prescriptions, such as that of Raducan et al. (2024) and model #1 of Bottke et al. (2020), lead to larger decreases of up to 1.4% and 1.1%. The most significant depletion is observed at intermediate diameters (roughly between 10 m and 300 m) and above ∼ 1 km the curves converge to negligible values.
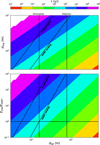 |
Fig. 6 Collisional timescales, τ, shown as a colour bar in years, for NEACs as a function of target diameter, dtgt, and impactor diameter, dimp, (top), and normalised impact energy Eimp/EDART (bottom). Solid black lines in both panels mark the energy thresholds for DART-analog impacts and catastrophic disruption. Vertical lines indicate the diameters of Didymos (750 m) and Dimorphos (150 m). The horizontal line in the lower panel denotes Eimp/EDART = 1, where impact energies equal that of the DART mission. |
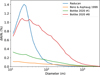 |
Fig. 7 Change in the NEA SFD due to the collisional evolution between NEA targets and MB projectiles over 1 Myr, for different scaling laws considered for Q*D. |
4 Impactors and cratering on specific asteroids
Recent missions to NEAs have delivered detailed measurements of their physical properties and high-precision global crater catalogs. Building on the NEAC-MB collisional activity quantified in the previous section, we estimated the number of impactors striking NEACs across a range of various target sizes representative of specific asteroids targeted by recent space missions, such as Dimorphos, Bennu, Didymos, and Ryugu. We calculate the number of impacts between a target of size, dtgt, and impactors of size, dimp, using Poisson statistics with mean f(dimp, dtgt)N(dimp)∆t, where N(dimp) is the differential SFD of the MB impactors from Bottke et al. (2020). We adopted time steps, ∆t, of 1000 years and simulate the collisional evolution over a total duration of 1 Myr. This process is repeated 1000 times for each target size to capture the statistical variability in the number of impacts.
Figure 8 shows the resulting SFDs of impactors for four representative NEA targets with diameters of 150 m, 500 m, 750 m, and 1 km. Solid curves represent the median number of impactors per diameter bin. The shaded regions enclose the 16th to 84th percentiles, which reflects the statistical dispersion across simulations. The resulting SFDs generally follow a powerlaw trend with slope ≈-2.54. The largest impactors in the median SFDs have diameters of 1.00 m, 2.89 m, 3.65 m, and 5.17 m for target sizes of 150 m, 500 m, 750 m, and 1 km, respectively.
We used the impactors SFDs of 500 m, 750 m, and 1 km sized NEAs to compare with the observed craters on Bennu, Didymos, and Ryugu by the OSIRIS-REx, DART, and Hayabusa2 missions. To do so, we convert impactor diameters to crater diameters using the scaling law for cohesive soil from Holsapple & Housen (2007), expressed as
![Mathematical equation: d_{\mathrm{crat}}=K_{1}\left[ \left( \frac{gd_\mathrm{imp}}{2v^{2}}\right)\left(\frac{\rho_\mathrm{tgt}}{\rho_\mathrm{imp}}\right)^{\frac{2\nu}{\mu}}+\left(\frac{Y}{\rho_\mathrm{tgt}v^{2}} \right)^{\frac{2+\mu}{2}} \left(\frac{\rho_\mathrm{tgt}}{\rho_\mathrm{imp}}\right)^{\frac{\nu \left(2+\mu\right)}{\mu}} \right]^{-\frac{\mu}{2+\mu}}d_\mathrm{imp},](/articles/aa/full_html/2026/05/aa57332-25/aa57332-25-eq6.png) (5)
(5)
with μ = 0.41, ν = 0.4, K = 1.03, and we assume densities of ρimp = 2500 kg m−3 and ρtgt = 1190 kg m−3, while v = 7.5 km s−1 is the impact velocity (Campo Bagatin et al. 2024), dimp is the impactor diameter in metres, and Y and g are the target strengths and surface gravities, respectively.
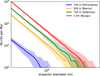 |
Fig. 8 SFDs of impactors onto NEA targets of 150 m, 500 m, 750 m, and 1 km in diameter over 1 Myr. Solid lines indicate the median value in each size bin, while the shaded regions indicate the 16th-84th percentile range across 1000 simulations. |
4.1 Cratering on Bennu
Bennu was the target of the OSIRIS-REx mission, which collected a sample from the asteroid and returned it to Earth on September 24, 2023. Multiple mineralogical analyses were then performed, accurately characterising its mineralogical, chemical, and physical properties. The samples returned from asteroid Bennu confirm it as a highly aqueously altered, carbon-rich body (Lauretta et al. 2024). The OSIRIS-REx mission also mapped Bennu’s global chemistry, mineralogy, physical properties, and geology. Shape modelling from OSIRIS-REx imagery, together with its high macroporosity and abundant surface boulders, confirms the predicted rubble-pile structure (Barnouin et al. 2019). The mission’s global crater survey identified 1560 craters ranging from under 1 m to over 200 m in diameter (Bierhaus et al. 2022). Bierhaus et al. (2022) showed that crater number densities drop sharply below diameters of ∼3 m, which is not due to observational bias or erasure processes, but likely because surface boulders ‘armour’ the regolith and inhibit small-crater formation. This ∼3 m cutoff also constrains Bennu’s small-crater retention age to between 1.6 and 2.2 Myr.
Bierhaus et al. (2022) also reported a decrease in the density of large craters around a diameter of ∼100 m and derived a crater-retention age of 10-65 Myr for the largest craters. The general shape of the SFD of craters observed on Bennu, with decreases near ∼3 m and ∼100 m, together with the fact that the overall crater SFD does not follow a single power law, suggests that the majority of Bennu’s crater population reflects two epochs: large craters that accumulated while Bennu resided in the MB and small craters produced during Bennu’s residence as an NEA. In this regard, our calculation of collisions on Bennu while it has been an NEA in a belt-crossing orbit could help constrain some presently undefined properties of this body, such as the target strength value, as we explain below.
Bennu has been an NEA for 1.75 ± 0.75 Myr (Ballouz et al. 2020). Although its present orbit does not cross the MB, its semi-major axis places it within our Group 1 (G1; a < 2.06 au), whose members frequently undergo temporary incursions into and out of the belt, as shown in Sect. 2. Objects in this group have a median fraction of orbital period spent inside the belt of ∆PMB/P ~ 0.55, but with large object-to-object variability. Therefore, we computed the fraction ∆PMB/P specifically for Bennu. To do this, we generated 99 clones by randomly sampling Bennu’s orbital elements within their observational uncertainties. The nominal orbit and its clones were then integrated for 3 × 10⁷ years as massless particles under the gravitational influence of the Sun and the eight planets of the Solar System. For each particle and at each time step, we computed ∆PMB/P and then we derived the median value of this quantity, obtaining ∆PMB/P = 0.36. Adopting Bennu’s estimated NEA residence time of 1.75 Myr, this corresponds to an effective MB exposure time of approximately 0.63 Myr. Furthermore, because Bennu’s current orbit differs from that of Didymos, which was adopted as a reference for the collisional calculations performed in this work, we computed the intrinsic collision probability for Bennu following the same method and prescriptions of Campo Bagatin et al. (2024), obtaining Pi = 1.918 × 10⁻¹⁷km−2yr−1.
The median crater SFDs for a 500 m diameter asteroid representative of Bennu over an exposure time of 0.63 Myr are shown in the left panel of Fig. 9 for three target strengths, Y = 100,50, and 25 Pa. These strengths were selected based on the findings of Perry et al. (2022), who used OSIRIS-REx observations of ejecta deposits surrounding a crater to determine that Bennu’s surface strength is likely lower than 100 Pa. We compare these results with the observed Bennu crater SFD from Bierhaus et al. (2022). For crater diameters of D ≳ 100 m, the observations lie between the Y = 25 Pa and Y = 50 Pa curves. However, crater retention ages for features larger than 100 m on Bennu exceed 10 Myr (Bierhaus et al. 2022), indicating that these craters most likely formed prior to Bennu’s residence as an NEA. We therefore consider Y ≈ 100 Pa to be the most appropriate target strength for Bennu, as the observed crater distribution between 50 m and 100 m lies closest to the Y = 100 Pa curve and shows a similar slope. It remains within the uncertainty associated with Bennu’s residence time as an NEA (blue shaded region in Fig. 9). At smaller diameters, the model overpredicts crater counts, as expected given that our calculations do not include resurfacing or armoring processes that could erase small craters on rubble-pile asteroids.
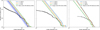 |
Fig. 9 SFDs of craters produced on NEA targets with diameters of 500 m (left panel), 1 km (middle panel), and 750 m (right panel), corresponding to Bennu, Ryugu, and Didymos, respectively. Coloured solid curves show the median number of craters per Myr larger than a given diameter D for different values of the target strength Y. Black curves represent the observed crater SFDs on Bennu (Bierhaus et al. 2022), Ryugu Hirata et al. (2020), and Didymos (Barnouin et al. 2024). Shaded area in the left panel indicates the uncertainty in Bennu’s lifetime as a NEA (Ballouz et al. 2020). |
4.2 Cratering on Ryugu
Asteroid Ryugu was the target of the Hayabusa2 mission, which returned surface samples from this NEA to Earth. Ryugu’s surface is covered by boulders from metre-scale up to ≈160 m. The morphology and physical properties of these boulders indicate formation by catastrophic disruption and partial reaccumulation of a relatively homogeneous parent body, implying that Ryugu is a rubble-pile asteroid (Watanabe et al. 2019). Its bulk chemical composition is extremely primitive, close to solar and CI chondrites (Nakamura et al. 2025). Spacecraft spectral observations revealed a global abundance of hydrated minerals and clear evidence of aqueous alteration (Kitazato et al. 2019).
The physical, mechanical, and thermal properties of the returned samples have been characterised in detail, enabling the construction of a model for the formation, evolution, and collisional disruption of Ryugu’s parent body. During the Hayabusa2 mission, a ∼30 cm projectile (the Small Carry-on Impactor, SCI) was released at ∼2 km s−1, producing an artificial crater >10 m in diameter. Crater scaling indicates formation in the gravity regime; together with a low surface cohesion of 140-670 Pa, this implies a surface age of ∼9 Myr (Arakawa et al. 2020). Hirata et al. (2020) identified 77 impact craters larger than 20 m in diameter in images acquired by the Hayabusa2 spacecraft. Their analysis shows that the spatial distribution is heterogeneous: crater densities vary with longitude and latitude, while craters occur in clusters rather than being uniformly distributed.
As with Bennu, we computed the intrinsic collision probability between Ryugu and projectiles crossing its orbit obtaining Pi = 1.41 × 10⁻¹⁷km−2yr−1. The middle panel of Fig. 9 shows the derived crater SFD over an exposure time of 1 Myr on a 1 km, Ryugu-like target for three target cohesion values, Y = 140, 300 and 670 Pa (Arakawa et al. 2020), together with the observed crater SFD on Ryugu’s surface (Hirata et al. 2020). For D ≳ 100 m, the observed population lies between the curves for Y = 300-670 Pa. Those large craters, however, were likely produced before Ryugu entered the NEA population (Takaki et al. 2022). At D ≲ 100 m, all three Y values overpredict the observed counts. Interpreting the model curves as crater production functions, the crater retention times can be estimated as t(> D) = Nobs(> D)/Nprod (> D). For Ryugu, this implies retention times t ~ 104-105 yr for D < 100 m craters, consistent with rapid resurfacing (Takaki et al. 2022).
4.3 Cratering on Didymos
(65803) Didymos was the target of the DART mission. It is a binary asteroid system composed of a primary asteroid of the same name and its satellite Dimorphos. Images obtained by the DRACO camera during the final minutes of DART’s approach provided unprecedented coverage of both bodies, revealing surfaces covered in blocks, consistent with a rubble-pile structure.
Barnouin et al. (2024) studied the surface geology of both components of the system. At higher latitudes, Didymos displays a rugged and undulating terrain, characterised by the presence of large boulders up to 160 m in length, degraded craters, and large-scale structures that may correspond to fossae or depressions. In the vicinity of the equator, a smooth region was identified that appears featureless at the resolution of the available images and lacks visible craters. This area may be composed of fine regolith or accumulations of blocks smaller than the resolution threshold, and its morphology suggests modification by surface mass-movement processes. It is likely associated with the asteroid’s rapid rotation, which promotes downslope transport of material toward the equator. In intermediate regions, evidence of surface transport processes is observed, such as tracks left by displaced blocks or small landslides (Bigot et al. 2024).
Overall, only 16 craters larger than 30 m have been identified, most of them located in higher-elevation regions. Barnouin et al. (2024) found that the cohesive strength of the surface should be <2 Pa, although at the centre of Didymos the overburden stresses would exceed 100 Pa. They estimated a surface age of ∼12.5 Myr using values of Y = 1 Pa and Y = 10 Pa, which is slightly longer than the average lifetime in the NEA region. Therefore, the craters observed on Didymos should correspond not only to its time as a NEA, but it should also include craters formed when it was a MB asteroid. It is not possible use our method to to extrapolate with what occurred during the period when this asteroid belonged to the MB. However, when calculating the cratering over a time interval of 12.5 Myr, the number of craters predicted by our model is significantly larger than the number observed. According to our model, the calculated number of craters is consistent with the observations if the surface age is of the order of 1 Myr for strengths, Y, of 1 Pa and 10 Pa, as shown in the right panel of Fig. 9. If this is the case, erosion processes on Didymos must be very efficient. Mass movements and even mass detachment associated with the asteroid’s rapid rotation would play a major role.
Barnouin et al. (2024) also suggested that Didymos likely formed in near-Earth space, experiencing a major mass-shedding event about 0.09-0.3 Myr ago. In this scenario, Didymos would have retained its largest craters, so the surface would not have been completely reset, although such an event could have modified the crater population. Furthermore, the presence of large surface blocks affects crater formation by inhibiting crater production (Bierhaus et al. 2022) and the magnitude of this effect is still poorly understood. In the case of Didymos, the relationship between impactor size and crater size may therefore be altered by the abundance of blocks, so our estimates based on Eq. (5) might not fully capture the actual cratering process. Also, it is worth noting that the low number of identified craters on Didymos limits the level of analysis that can be performed and the conclusions that can be obtained using our method. Further observations and modelling efforts are required to accurately reproduce these effects. More detailed observations of the surface, such as those provided by the HERA mission, will be crucial in improving constraints on both the cratering record and the surface processes operating on this asteroid.
5 Conclusions
In this study, we combined N-body simulations with statistical collisional modelling to investigate the dynamical and collisional evolution of Near-Earth asteroids in main belt-crossing orbits (NEACs). These incursions represent a mean value of 60% of their current orbital periods. By classifying these objects into three groups based on their initial semi-major axis (G1: a < 2.06 au; G2: 2.06 < a < 2.5 au; G3: a > 2.5 au), we drew the following main conclusions:
G3 asteroids show the shortest median lifetimes (∼1 Myr), followed by G2 (∼3 Myr) and G1 (∼20 Myr), demonstrating that more compact orbits survive longer under planetary perturbations;
G1 objects exhibit highly chaotic trajectories, frequently transitioning between belt-crossing and belt-confined orbits. Meanwhile, G2 and G3 predominantly act as belt-crossers and can transiently occupy orbits completely contained within the MB;
The time NEACs spend in the MB with respect to their orbital period remains approximately constant during their lifetimes. Therefore, NEACs are susceptible to collisions with MB asteroids;
Collisional timescales for DART-analog impacts are as short as 105 yr for targets up to ∼300 m, increasing to 106 yr for larger bodies. Catastrophic collisions on bodies larger than 100 m occur on timescales larger than 107 yr and, thus, they are negligible in the scope of NEAC dynamical lifetimes;
Collisional evolution of the NEAC population with MB asteroids over 1 Myr can erode between 0.1% and 1.4% of the size-frequency distribution in the metre-size range, depending on the Q*D prescription adopted;
We derived the impactor SFDs for targets with diameters of 150 m, 500 m, 750 m, and 1 km, using the 500 m, 750 m, and 1 km cases to construct crater SFDs for Bennu, Didymos, and Ryugu, respectively. For Bennu, the observations between 50 m and 100 m are best reproduced by a target strength of Y ~ 100 Pa, while the model overproduction of small craters is consistent with unmodeled resurfacing and armoring processes. For Ryugu, the modeled crater SFD implies short crater-retention times of the order of 104105 yr for D < 100 m, in agreement with the resurfacing inferred by Takaki et al. (2022). For Didymos, our results suggest that the observed crater population is consistent with effective surface ages shorter than the nominal NEA residence time, likely influenced by surface-modification processes such as mass movement and block-dominated terrains on a rapidly rotating rubble-pile asteroid.
The results indicate that the collisional activity of NEACs is too low to significantly alter the global properties of the population, such as its size distribution. Nevertheless, the study of collisional processes at the scale of small impacts remains important because of their implications for the asteroids’ physical, dynamical, and surface properties, as well as the potential consequences for planetary defence strategies. These effects include changes in rotation rate, internal structure, crater formation, and dust ejection. Such processes will be examined in greater detail by the Hera mission, set to investigate the consequences of the DART impact on Dimorphos’s surface.
Acknowledgements
This research was performed using computational resources of Facultad de Ciencias Astronómicas y Geofísicas de La Plata (FCAGLP) and Instituto de Astrofísica de La Plata (IALP), and received partial funding from Universidad Nacional de La Plata (UNLP) under PID G172. Ricardo Gil-Hutton gratefully acknowledges financial support by CONICET through PIP 112-202001-01227.
References
- Arakawa, M., Saiki, T., Wada, K., et al. 2020, Science, 368, 67 [NASA ADS] [CrossRef] [Google Scholar]
- Ballouz, R. L., Walsh, K. J., Barnouin, O. S., et al. 2020, Nature, 587, 205 [NASA ADS] [CrossRef] [Google Scholar]
- Barnouin, O. S., Daly, M. G., Palmer, E. E., et al. 2019, Nat. Geosci., 12, 247 [Google Scholar]
- Barnouin, O., Ballouz, R.-L., Marchi, S., et al. 2024, Nat. Commun., 15, 6202 [Google Scholar]
- Benz, W., & Asphaug, E. 1999, Icarus, 142, 5 [NASA ADS] [CrossRef] [Google Scholar]
- Bierhaus, E., Trang, D., Daly, R., et al. 2022, Nat. Geosci., 15, 440 [Google Scholar]
- Bigot, J., Lombardo, P., Murdoch, N., et al. 2024, Nat. Commun., 15, 6204 [Google Scholar]
- Bottke, W. F., Vokrouhlický, D., Broz, M., Nesvorný, D., & Morbidelli, A. 2001, Science, 294, 1693 [NASA ADS] [CrossRef] [Google Scholar]
- Bottke, W. F., Durda, D. D., Nesvorný, D., et al. 2005, Icarus, 175, 111 [Google Scholar]
- Bottke, W. F., Vokrouhlický, D., Walsh, K. J., et al. 2015, Icarus, 247, 191 [CrossRef] [Google Scholar]
- Bottke, W. F., Vokrouhlický, D., Ballouz, R. L., et al. 2020, AJ, 160, 14 [Google Scholar]
- Campo Bagatin, A., Dell’Oro, A., Parro, L. M., et al. 2024, Nat. Commun., 15, 3714 [Google Scholar]
- Chambers, J. E. 1999, MNRAS, 304, 793 [Google Scholar]
- Cheng, A. F., Agrusa, H. F., Barbee, B. W., et al. 2023, Nature, 616, 457 [NASA ADS] [CrossRef] [Google Scholar]
- Daly, R. T., Ernst, C. M., Barnouin, O. S., et al. 2023, Nature, 616, 443 [CrossRef] [Google Scholar]
- de Elía, G. C., & Brunini, A. 2007, A&A, 466, 1159 [NASA ADS] [CrossRef] [EDP Sciences] [Google Scholar]
- Granvik, M., Morbidelli, A., Vokrouhlický, D., et al. 2017, A&A, 598, A52 [NASA ADS] [CrossRef] [EDP Sciences] [Google Scholar]
- Granvik, M., Morbidelli, A., Jedicke, R., et al. 2018, Icarus, 312, 181 [CrossRef] [Google Scholar]
- Hirata, N., Morota, T., Cho, Y., et al. 2020, Icarus, 338, 113527 [Google Scholar]
- Holsapple, K. A., & Housen, K. R. 2007, Icarus, 187, 345 [NASA ADS] [CrossRef] [Google Scholar]
- Kitazato, K., Milliken, R. E., Iwata, T., et al. 2019, Science, 364, 272 [Google Scholar]
- Lauretta, D. S., Connolly, H. C., Aebersold, J. E., et al. 2024, maps, 59, 2453 [Google Scholar]
- Nakamura, T., Engrand, C., Zolensky, M., Hamilton, V. E., & Fraeman, A. A. 2025, Space Sci. Rev., 221, 44 [Google Scholar]
- Nesvorný, D., Vokrouhlický, D., Shelly, F., et al. 2024, Icarus, 417, 116110 [Google Scholar]
- Perry, M. E., Barnouin, O. S., Daly, R. T., et al. 2022. Nature Geoscience, 15, 447 [Google Scholar]
- Raducan, S., Jutzi, M., Merrill, C., et al. 2024, PSJ, 5, 79 [Google Scholar]
- Takaki, N., Cho, Y., Morota, T., et al. 2022, Icarus, 377, 114911 [Google Scholar]
- Thomas, C. A., Naidu, S. P., Scheirich, P., et al. 2023, Nature, 616, 448 [NASA ADS] [CrossRef] [Google Scholar]
- Tricarico, P. 2017, Icarus, 284, 416 [Google Scholar]
- Watanabe, S., Hirabayashi, M., Hirata, N., et al. 2019, Science, 364, 268 [NASA ADS] [Google Scholar]
- Zain, P. S., de Elia, G. C., & Di Sisto, R. P. 2020, A&A, 639, A9 [NASA ADS] [CrossRef] [EDP Sciences] [Google Scholar]
For simplicity, in this section we use the SFD of the entire NEA population instead of the NEACs defined in previous sections.
All Figures
|
Fig. 1 Distribution of semi-major axes a and eccentricities e of NEAs. The colour bar indicates the fraction of time that NEAs spend within the MB relative to their orbital period. The curve q = 1.3 au marks the boundary between NEAs and the MB (gray region), while NEACs correspond to the region to the right of the curve Q = 2.06 au. The black dot indicates the a and e values of Didymos. |
| In the text | |
|
Fig. 2 Cumulative percentage of escaped NEACs as a function of time for Groups 1-3. Escapes are defined as reaching a heliocentric distance > 100 au or colliding with the Sun or a planet. Solid lines show the evolution for G1 (blue), G2 (orange), and G3 (green), while vertical dashed lines and markers indicate the median lifetime. |
| In the text | |
|
Fig. 3 Dynamical occupancy maps in the a - e plane for G1 (left panel), G2 (middle panel) and G3 (right panel). Colours indicate the fraction of total integration time spent in each of the 1000 grid cells. Solid black curves mark perihelion q = 1.3 au and aphelion Q = 2.06 au. Dashed vertical lines denote the group boundaries at a = 2.06 au and a = 2.5 au. |
| In the text | |
|
Fig. 4 Evolution of the fraction of time spent in the MB relative to the orbital period, ∆PMB/P, for each NEAC (red) and the median at each time step (black) for G1 (left panel), G2 (middle panel), and G3 (right panel). |
| In the text | |
|
Fig. 5 Q*D as a function of target diameter, dtgt, for rubble-pile asteroids with different large-boulder volume fractions (Raducan et al. 2024) and QDART corresponds to the 30% boulder-volume case scaled to the DART impact energy. |
| In the text | |
|
Fig. 6 Collisional timescales, τ, shown as a colour bar in years, for NEACs as a function of target diameter, dtgt, and impactor diameter, dimp, (top), and normalised impact energy Eimp/EDART (bottom). Solid black lines in both panels mark the energy thresholds for DART-analog impacts and catastrophic disruption. Vertical lines indicate the diameters of Didymos (750 m) and Dimorphos (150 m). The horizontal line in the lower panel denotes Eimp/EDART = 1, where impact energies equal that of the DART mission. |
| In the text | |
|
Fig. 7 Change in the NEA SFD due to the collisional evolution between NEA targets and MB projectiles over 1 Myr, for different scaling laws considered for Q*D. |
| In the text | |
|
Fig. 8 SFDs of impactors onto NEA targets of 150 m, 500 m, 750 m, and 1 km in diameter over 1 Myr. Solid lines indicate the median value in each size bin, while the shaded regions indicate the 16th-84th percentile range across 1000 simulations. |
| In the text | |
|
Fig. 9 SFDs of craters produced on NEA targets with diameters of 500 m (left panel), 1 km (middle panel), and 750 m (right panel), corresponding to Bennu, Ryugu, and Didymos, respectively. Coloured solid curves show the median number of craters per Myr larger than a given diameter D for different values of the target strength Y. Black curves represent the observed crater SFDs on Bennu (Bierhaus et al. 2022), Ryugu Hirata et al. (2020), and Didymos (Barnouin et al. 2024). Shaded area in the left panel indicates the uncertainty in Bennu’s lifetime as a NEA (Ballouz et al. 2020). |
| In the text | |
Current usage metrics show cumulative count of Article Views (full-text article views including HTML views, PDF and ePub downloads, according to the available data) and Abstracts Views on Vision4Press platform.
Data correspond to usage on the plateform after 2015. The current usage metrics is available 48-96 hours after online publication and is updated daily on week days.
Initial download of the metrics may take a while.