Fig. 3
Download original image
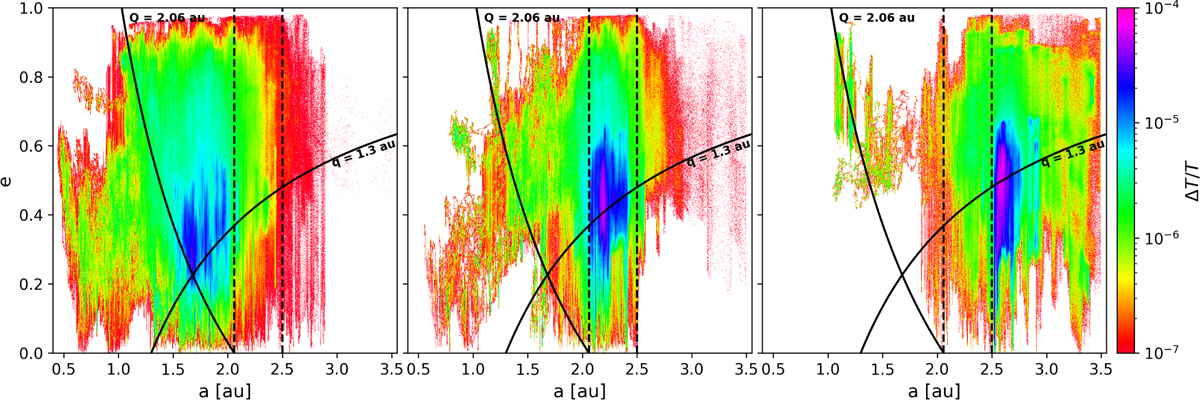
Dynamical occupancy maps in the a - e plane for G1 (left panel), G2 (middle panel) and G3 (right panel). Colours indicate the fraction of total integration time spent in each of the 1000 grid cells. Solid black curves mark perihelion q = 1.3 au and aphelion Q = 2.06 au. Dashed vertical lines denote the group boundaries at a = 2.06 au and a = 2.5 au.
Current usage metrics show cumulative count of Article Views (full-text article views including HTML views, PDF and ePub downloads, according to the available data) and Abstracts Views on Vision4Press platform.
Data correspond to usage on the plateform after 2015. The current usage metrics is available 48-96 hours after online publication and is updated daily on week days.
Initial download of the metrics may take a while.