Open Access
Fig. 2
Download original image
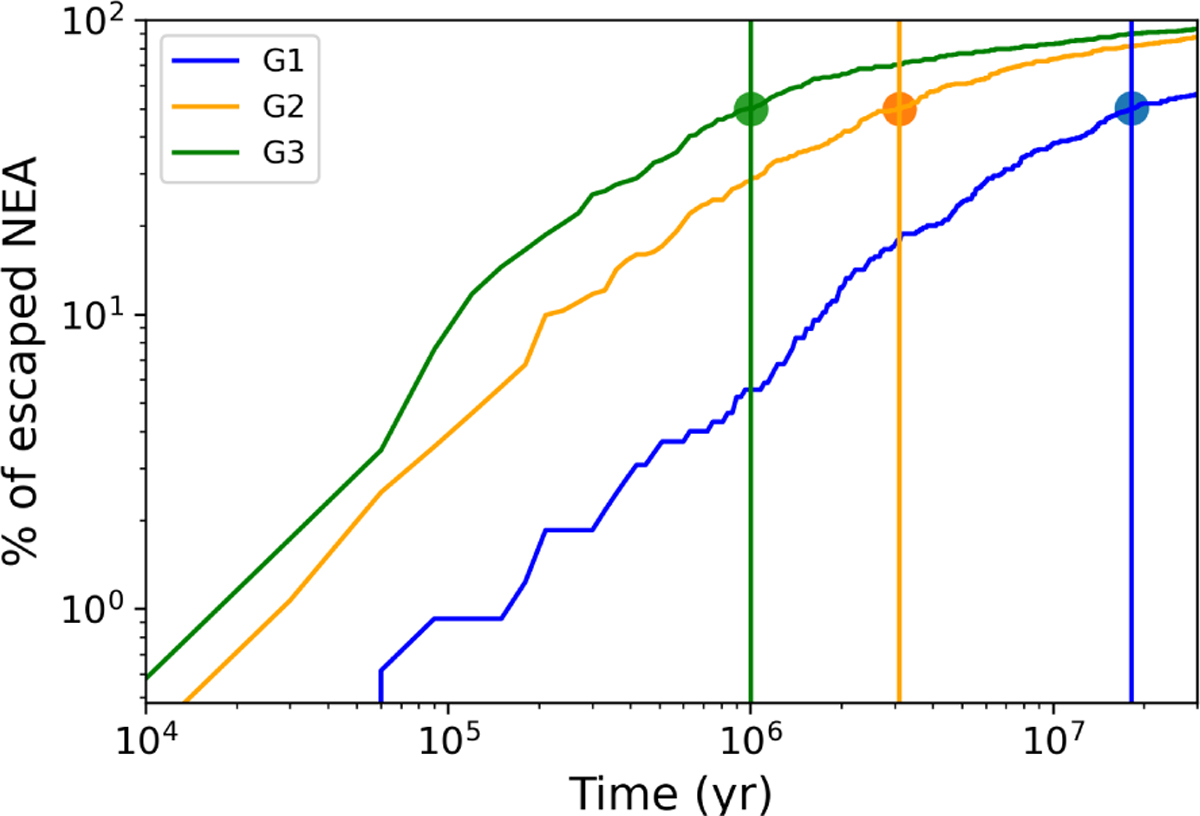
Cumulative percentage of escaped NEACs as a function of time for Groups 1-3. Escapes are defined as reaching a heliocentric distance > 100 au or colliding with the Sun or a planet. Solid lines show the evolution for G1 (blue), G2 (orange), and G3 (green), while vertical dashed lines and markers indicate the median lifetime.
Current usage metrics show cumulative count of Article Views (full-text article views including HTML views, PDF and ePub downloads, according to the available data) and Abstracts Views on Vision4Press platform.
Data correspond to usage on the plateform after 2015. The current usage metrics is available 48-96 hours after online publication and is updated daily on week days.
Initial download of the metrics may take a while.