| Issue |
A&A
Volume 708, April 2026
|
|
|---|---|---|
| Article Number | A361 | |
| Number of page(s) | 7 | |
| Section | Extragalactic astronomy | |
| DOI | https://doi.org/10.1051/0004-6361/202556655 | |
| Published online | 27 April 2026 | |
A NOEMA pilot survey of [C II] line emission in luminous galaxies at z ≈ 6
1
Departamento de Astronomía, Universidad de Concepción, Barrio Universitario, Concepción, Chile
2
Millenium Nucleus for Galaxies (MINGAL), Concepción, Chile
3
Max-Planck-Institut für extraterrestrische Physik, Giessenbachstrasse 1, 85748 Garching, Germany
4
Purple Mountain Observatory, Chinese Academy of Sciences, 10 Yuanhua Road, Nanjing 210023, China
5
Institute for Cosmic Ray Research, The University of Tokyo, 5-1-5 Kashiwanoha, Kashiwa, Chiba 277-8582, Japan
6
Institut de Radioastronomie Millimétrique (IRAM), 300 Rue de la Piscine, 38400 Saint-Martin-d’Hères, France
★ Corresponding author: This email address is being protected from spambots. You need JavaScript enabled to view it.
Received:
29
July
2025
Accepted:
21
February
2026
Abstract
We present Northern Extended Millimeter Array (NOEMA) observations of four luminous galaxies at z ∼ 6, when the Universe was less than ∼1 Gyr old. These galaxies are detected in the [C II] 158 μm fine-structure line, and three also exhibit underlying dust continuum emission. The [C II] line velocities are offset by a few hundred kilometers per second relative to the Lyα emission, possibly indicating the presence of outflows or a large reservoir of surrounding atomic gas. From the combination of dust continuum and rest-frame UV emission, we estimate that approximately 50% of the star formation is obscured by dust, consistent with values found in other massive star-forming galaxies at similar redshifts. The [C II]-to-far-infrared (FIR) luminosity ratios of the continuum-detected galaxies are elevated compared to nearby galaxies with similar FIR luminosities. In one system, J163026+4315, the [C II] emission is spatially resolved, allowing us to measure the source size and FIR surface brightness (ΣFIR). We find that the [C II]/FIR as a function of ΣFIR in this source follows the trends observed in both local and high-redshift galaxy populations. A kinematic analysis of the resolved [C II] emission provides tentative evidence for a rotating disk, although higher-angular resolution data are needed to confirm this. These results demonstrate the power of NOEMA to probe the physical conditions and structure of the interstellar medium in galaxies in the first billion years of cosmic history.
Key words: galaxies: high-redshift / galaxies: ISM / galaxies: structure
© The Authors 2026
 Open Access article, published by EDP Sciences, under the terms of the Creative Commons Attribution License (https://creativecommons.org/licenses/by/4.0), which permits unrestricted use, distribution, and reproduction in any medium, provided the original work is properly cited.
This article is published in open access under the Subscribe to Open model. This email address is being protected from spambots. You need JavaScript enabled to view it. to support open access publication.
1. Introduction
Understanding the physical conditions and dynamical state of galaxies in the early Universe is essential to reconstruct the formation and evolution of present-day galaxies. In this study, we focus on luminous star-forming galaxies at redshift z ∼ 6, a period when the Universe was less than 1 Gyr old. This epoch marks a key phase of rapid stellar mass assembly, preceding the peak of the cosmic star formation rate density (e.g., Madau & Dickinson 2014), and provides crucial insights into the early stages of galaxy evolution.
A valuable tracer of the interstellar medium (ISM) in these distant systems is the [C II] 158 μm fine-structure line. As one of the dominant coolants of the neutral ISM (Wolfire et al. 2003), the [C II] line traces a range of gas phases, particularly photodissociation regions (PDRs) surrounding sites of active star formation. Cold gas heated by far-ultraviolet (FUV) photons via the photoelectric effect on dust grains predominantly cools through [C II] emission (e.g., Wolfire et al. 2003; De Looze et al. 2014; Herrera-Camus et al. 2015, 2018a; Schaerer et al. 2020). Compared to CO lines – which are often difficult to detect in normal galaxies at these redshifts due to excitation and sensitivity limitations – the [C II] line provides a more accessible alternative for probing the cold ISM in z ≳ 5 star-forming galaxies (e.g., Carilli & Walter 2013). This is especially relevant in low-metallicity environments, where a significant fraction of the molecular gas may not be traced by CO emission – the so-called CO-faint molecular gas – which can still be detected through [C II] emission (e.g., Wolfire et al. 2010; Jameson et al. 2018).
Recent high-redshift surveys based on [C II] line and dust continuum observations have expanded our understanding of cold gas in early galaxy populations. For example, the surveys ALPINE (Le Fèvre et al. 2020; Béthermin et al. 2020; Faisst et al. 2020), REBELS (Bouwens et al. 2022), and more recently CRISTAL (Herrera-Camus et al. 2025) have contributed significantly to studying the kinematics, outflows, ISM properties, structure, and sizes of normal, star-forming galaxies at z ∼ 4 − 8 (e.g., Fujimoto et al. 2020; Ginolfi et al. 2020; Herrera-Camus et al. 2022; Algera et al. 2023; Ikeda et al. 2025; Mitsuhashi et al. 2024; Li et al. 2024; Rowland et al. 2024; Lee et al. 2025)
Future progress in this field requires spatially resolved observations of both gas and dust in early galaxies. Identifying systems with sufficiently bright and extended [C II] and dust continuum emission is a critical first step toward enabling high-resolution studies of their kinematics and ISM properties. The Northern Extended Millimeter Array (NOEMA), with its high sensitivity and angular resolution, is ideally suited for both the discovery and follow-up of such targets. In addition, it provides access to regions of the sky that are not observable from southern facilities such as ALMA. In this work, we present NOEMA Band 3 observations of the [C II] line emission in four luminous galaxies at z ∼ 6. These observations allow us to investigate the ISM properties and structure of typical star-forming galaxies in the early Universe, as part of a broader effort to build a representative sample at this epoch and identify the most promising candidates for future high-resolution follow-up studies of their gas kinematics.
2. The sample
For this project, we searched the Subaru High-z Exploration of Low-Luminosity Quasars (SHELLQs) survey (Matsuoka et al. 2018, 2019) for systems with reliable spectroscopic redshifts and high rest-frame UV luminosities (at ∼1500 Å) – two conditions necessary for conducting NOEMA observations of the [C II] 158 μm transition, both globally and, in the future, at spatially resolved scales. We identified four luminous galaxies – J152555+4303, J151657+4228, J162833+4312, and J163026+4315 – at redshift z ≈ 6. Two of these systems, J152555+4303 and J151657+4228, show potential evidence for Active Galactic Nuclei (AGN) activity based on the width of the Lyα emission line. Galaxies J162833+4312 and J163026+4315 are also part of the Great Optically Luminous Dropout Research Using Subaru HSC (GOLDRUSH) survey (Harikane et al. 2022).
The main properties of the four galaxies are listed in Table A.1, including their absolute UV magnitudes (MUV) and redshifts derived from the Lyα and [C II] emission lines. Figure 1 places our sample in context by showing their MUV as a function of redshift. Compared to the ALPINE (4 ≲ z ≲ 5.5), CRISTAL (4 ≲ z ≲ 6), and REBELS (6.5 ≲ z ≲ 8) samples, our NOEMA/Band 3 observations of our targets fill an observational redshift gap between these major surveys.
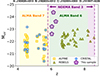 |
Fig. 1. MUV as a function of redshift. The purple markers show the four galaxies in our sample. For comparison, we include galaxies from the ALPINE survey (Cassata et al. 2020), the REBELS survey (Bouwens et al. 2022), and from the CRISTAL survey (Herrera-Camus et al. 2025). The colored bars indicate the bandpasses used in each survey, illustrating their corresponding redshift ranges. Some REBELS sources appear outside the redshift range of Band 6 due to observations targeting other ISM tracers (e.g., the [O III]88μm transition). |
Compared to the ALPINE (Cassata et al. 2020), CRISTAL (Herrera-Camus et al. 2025), and REBELS (Bouwens et al. 2022) samples, our targets formally bridge the redshift ranges of these major surveys. However, as shown in Fig. 1, they are systematically more UV-luminous (MUV ≃ −22.6 to −24.4), indicating that they represent the high-luminosity tail of the population rather than a homogeneous continuation of ALPINE or REBELS. Our NOEMA pilot sample therefore highlights a subset of particularly bright, actively star-forming galaxies well suited for spatially resolved ISM studies – complementary to, rather than directly comparable with, the larger surveys.
3. Observations
We used the NOEMA interferometer in its most compact configuration (D) and Band 3 (νsky = 196.128 − 276.000 GHz) to observe the [C II] 158 μm fine-structure line and underlying dust continuum. The first two targets, J162833+4312 and J163026+4315, were observed on April 6 and 10, 2023, with a total on-source integration time of 19.24 hours for both. For these galaxies, the [C II] line was redshifted to observed frequencies of νobs = 270.322 GHz and 270.511 GHz, respectively. The remaining two galaxies, J152555+4303 and J151657+4228, were observed from April 8 to 9, 2023, with a total on-source time of 10.34 hours for both sources. Their [C II] lines were redshifted to νobs = 261.475 GHz and νobs = 266.785 GHz, respectively.
Data reduction was carried out using the Grenoble Image and Line Data Analysis Software (GILDAS) developed by IRAM (Guilloteau & Lucas 2000), specifically employing the CLIC and MAPPING packages. The resulting synthesized beams have an average size of θbeam ≈ 0.62″ × 0.75″, corresponding to a physical scale of ∼4.5 kpc at z = 6. The achieved sensitivities range from 0.55 to 0.76 mJy beam−1 for the cube (measured in 40 km s−1 channels), and from 36 to 39 μJy beam−1 for the continuum maps. A detailed summary of the synthesized beam sizes and noise levels is provided in Table B.1.
4. Results and discussion
4.1. [C II] line and dust continuum detections
We detect all four galaxies in the [C II] 158 line emission. When integrating the emission over the full velocity range of the line, the total detection significance is S/N ∼ 5–10 (Table A.1). Three of the galaxies are also detected in the dust continuum, with the exception of J152555+4303, which shows no significant continuum emission. This is notable given that all four galaxies have comparable star formation rates (see Table A.2) and were observed to similar depths.
We derived the total far-infrared (FIR; 8–1000 μm) luminosity from the NOEMA Band 3 continuum by assuming a modified blackbody with a dust temperature of Tdust = 45 K and a dust emissivity index of β = 1.8, following Béthermin et al. (2020). We also explored a dust temperature range of 40–60 K to quantify systematic uncertainties, which led to variations of ∼0.2–0.3 dex in LFIR and in SFRFIR. The uncertainties reported in Table A.2 include errors from the continuum flux density measurements and from this range of dust temperatures.
To derive the star formation rates (SFRs), we combined UV- and FIR-based estimates that rely on standard calibrations. The UV-based SFRs were calculated from rest-frame 1500 Å luminosities using the conversion of Wuyts et al. (2008), which assumes a Salpeter Initial Mass Function (IMF) (Salpeter 1955). The FIR-based SFRs were derived from LFIR using the calibration of Murphy et al. (2011), which adopts a Kroupa IMF (Kroupa 2001). For reference, SFRs based on a Salpeter IMF are a factor of ≈1.6 higher than those obtained using a Kroupa IMF. The obscured fraction of star formation was calculated as
The left column of Figure 2 shows the global [C II] spectra for each galaxy, extracted within a circular aperture of 1″ radius (∼6 kpc). The best-fit single Gaussian profiles are overplotted. The dashed lines mark the expected velocity of the Lyα lines based on redshifts from Matsuoka et al. (2018, 2019). The comparison between the [C II] and Lyα lines confirms the significance of the [C II] line detections and reveals velocity offsets between the two lines (see Section 4.3).
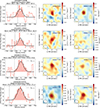 |
Fig. 2. (Left) [CII] 158 μm spectrum of each galaxy, extracted inside a circular aperture of 1″ radius. (Center) Integrated intensity map of each galaxy. The contours show a 2σ detection (dotted line), then increase up to 9σ (solid lines) in 1σ steps. The color scale indicates the [C II]-integrated line flux in units of jansky-kilometre per second per beam. (Right) Dust continuum emission. The contours start at 2σ (dotted line), then increase up to 5σ (solid lines), also in 1σ steps. The color scale indicates the dust continuum flux in units of millijansky per beam. The beam size is shown in the bottom-left corner of both the integrated intensity and continuum maps. J152555+4304 was not detected in the continuum. |
The middle column of Figure 2 presents the [C II] integrated intensity maps. These were obtained by integrating the emission over a velocity range of approximately ±250 km s−1, corresponding to the orange-filled regions shown in the spectra. The right column of Figure 2 displays the dust continuum maps. As noted, J152555+4303 shows no detectable continuum emission at the sensitivity of our observations. The measured [C II] line and continuum flux densities Scont are reported in Table A.1.
Interestingly, for J163026+4315, both the [C II] and dust continuum maps show emission that extends beyond the beam size, with an effective radius of Re ≈ 0.8″, which corresponds to ≈4.6 kpc at the redshift of the source. This is a factor of ∼2 larger than the average size of massive star-forming galaxies at z ∼ 6 (Fudamoto et al. 2020). One possibility is that J163026+4315 is a merger between two or more systems that remain unresolved in our current observations.
Given the bright and extended nature of J163026+4315, we recently conducted deep follow-up NOEMA Band 3 observations (∼35 h) using the extended array configuration (Program ID W23DA, PI Förster Schreiber). The analysis of these data will be presented in a forthcoming paper.
4.2. The [CII]/FIR luminosity ratio
The [C II] line is one of the main coolants of neutral atomic gas (Wolfire et al. 2003). Comparing its luminosity with gas heating indicators such as FIR luminosity allows us to study the heating and cooling balance of the ISM. The [C II]/FIR is therefore linked to the physical conditions of the ISM and tends to decrease around LFIR ∼ 1011 L⊙, as shown in Figure 3. This decrease, known as the [C II] line deficit (e.g., Malhotra et al. 2001; Smith et al. 2017; Herrera-Camus et al. 2018b), may arise from several mechanisms: the destruction or charging of dust grains in strong radiation fields (e.g., Kaufman et al. 1999; Malhotra et al. 2001; Díaz-Santos et al. 2017), high ionization parameters in dusty H II regions (e.g., Graciá-Carpio et al. 2011; Herrera-Camus et al. 2018a), the influence of AGN on the ionization state of the gas (e.g., Langer & Pineda 2015; Herrera-Camus et al. 2018a), the saturation of [C II] line emission in dense PDRs where densities exceed the line critical density (Herrera-Camus et al. 2018a; Bisbas et al. 2022).
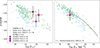 |
Fig. 3. [CII]/FIR as a function of FIR luminosity (left) for the three galaxies detected in the dust continuum, and as a function of ΣFIR (right) for the one extended galaxy where the size can be measured. For comparison, we show galaxies from the SHINING survey (z ∼ 0), galaxies at z ∼ 0 and 3 < z < 6, and from the ALPINE survey (z ∼ 4–6) (Lutz et al. 2016; Spilker et al. 2016; Béthermin et al. 2020), and a scaling relation for z ≳ 3 main-sequence star-forming galaxies from Herrera-Camus et al. (2025). |
The [C II]/FIR values of the three galaxies in our sample with dust continuum detections are show in Figure 3 and listed in Table A.1. The error bars indicate how the ratio would vary if different dust temperatures in the 40 K ≲ Tdust ≲ 60 K range were assumed. For comparison, we include measurements from nearby galaxies (Lutz et al. 2016; Spilker et al. 2016; Herrera-Camus et al. 2018b) and star-forming galaxies at 3 ≲ z ≲ 6 (Spilker et al. 2016; Béthermin et al. 2020). The galaxies in our sample follow the general trend, with two exhibiting higher [C II]/FIR for a given LFIR than nearby galaxies. This has been interpreted as a consequence of high-z galaxies being more gas-rich (e.g., Narayanan & Krumholz 2017; Herrera-Camus et al. 2025).
The right panel of Figure 3 shows the [C II]/FIR line ratio as a function of FIR surface brightness, ΣFIR. The [C II]/FIR−ΣFIR scaling relation derived for main-sequence star-forming galaxies at z ≳ 3 by Herrera-Camus et al. (2025) is shown as a gray line. The correlation between [C II]/FIR and ΣFIR is tighter than with LFIR (e.g., Lutz et al. 2016; Díaz-Santos et al. 2017; Herrera-Camus et al. 2018b), likely because ΣFIR more directly traces the ratio of the FUV radiation field intensity (G0) to the neutral gas density (nH), both of which are key parameters regulating [C II] emission. We observe that for J163026+4315 – the system with extended [C II] and dust continuum emission, for which a source size can be measured – the data point no longer appears offset from the general relation for star-forming galaxies at z ≈ 0 but instead follows the overall trend.
4.3. Comparison between the Lyα and [C II] transitions
Lyα is a resonant line, which often results in a velocity offset relative to nonresonant lines (e.g., Steidel et al. 2010; Erb et al. 2014; Hashimoto et al. 2015; Cassata et al. 2020). Such an offset with respect to the [C II] line may arise from, for example, a large reservoir of atomic gas surrounding the galaxy (e.g., Erb et al. 2014) or from gas expelled in outflows (e.g., Verhamme et al. 2006).
Figure 4 shows the Lyα–[C II] velocity offset for the galaxies in our sample, using Lyα measurements from (Matsuoka et al. 2018, 2019). The left panel presents the velocity offset as a function of the Lyα equivalent width (EW0(Lyα)), excluding J163026+4315 for which no EW(Lyα) measurement is available in the literature; the right panel shows the offset as a function of the absolute UV magnitude (MUV). For comparison, we include observations of high-redshift star-forming galaxies from Hashimoto et al. (2019), Endsley et al. (2022), and Baier-Soto et al. (2022). The galaxies in our sample at z ∼ 6 show Lyα–[C II] velocity offsets in the range ∼200 − 500 km s−1, comparable to those reported in these previous studies.
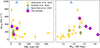 |
Fig. 4. Velocity offset between Lyα and [CII] emission lines as a function of Lyα equivalent width (left) and the absolute UV magnitude (right). We include galaxies from 6 ≲ z ≲ 8, 6.6 ≲ z ≲ 7, and z = 7.2 for comparison (Hashimoto et al. 2019; Endsley et al. 2022; Baier-Soto et al. 2022). The galaxies of this sample are shown in purple in both panels. |
The observed trend of the Lyα–[C II] velocity offset as a function of EW0(Lyα) and MUV can be interpreted as reflecting either higher column densities of atomic gas or outflows driven by intense star formation. Our systems are consistent with the expected relation between ΔvLyα and EW0(Lyα), for which low equivalent widths correspond to larger velocity offsets. In contrast, the trend between ΔvLyα and MUV in Fig. 4 does not follow the positive correlation typically reported for larger samples, where more UV-luminous galaxies exhibit larger Lyα offsets (e.g., Erb et al. 2014; Hashimoto et al. 2019; Endsley et al. 2022). This apparent inversion is not physically significant and likely reflects a combination of (i) the small size of our sample and (ii) the narrow range in UV luminosities (MUV ≃ −22.6 to −24.4). Although Lyα can in some cases not be a reliable tracer of the systemic redshift due to radiative transfer effects and Inter Galactic Medium (IGM) absorption, this does not imply that the centroid of the Lyα line itself is poorly measured. Instead, the uncertainty relevant for the Lyα–[C II] comparison is set by the measurement precision of the Lyα peak position, which depends on the spectral resolution and signal-to-noise ratio of the spectra. The SHELLQs spectra were obtained with GTC/OSIRIS (R ≈ 1500) and Subaru/FOCAS (R ≈ 1200), corresponding to instrumental velocity resolutions of ∼200–250 km s−1. For the Lyα detections considered here (S/N ≳ 8), the statistical uncertainty on the centroid is much smaller, ≲15 km s−1. The observed velocity offsets between Lyα and [C II] (∼200–500 km s−1) therefore exceed the measurement uncertainties by more than an order of magnitude and represent physical differences between the Lyα emission and the systemic redshift traced by [C II], consistent with those observed in other high-redshift star-forming galaxies and quasars (e.g., Hashimoto et al. 2019; Endsley et al. 2022; Baier-Soto et al. 2022).
Adopting the relation ΔvLyα ∼ 2 × vout (e.g., Verhamme et al. 2006), the measured velocity offsets imply potential outflow velocities of ∼100–300 km s−1. Given these limitations, we do not interpret the ΔvLyα–MUV relation for our four galaxies as evidence of a physical deviation from previously reported trends.
4.4. Kinematic analysis of J163026+4315
The [C II] line emission in J163026+4315 extends beyond the NOEMA synthesized beam, enabling a kinematic analysis of the system. To this end, we constructed the velocity map (moment 1) by calculating the intensity-weighted mean velocity along the spectral axis, and the velocity dispersion map (moment 2) by computing the square root of the intensity-weighted second central moment of the velocity distribution.
Figure 5 shows the velocity field (left), the velocity dispersion map (center), and the rotation curve (right) of the galaxy. The kinematic center and the kinematic axis were chosen to coincide with the region where the velocity dispersion peaks and to maximize the velocity gradient and spatial coverage of the [C II] line emission. This yielded a PAkin of 9° east of north. For comparison, the dashed red line in Figure 5 indicates the morphological major axis (PAmorph = 18° east of north), and the red cross marks the morphological center, both derived from a 2D Gaussian fit to the [C II] line-integrated intensity map. We find that the morphological and kinematic major axes are broadly aligned, and the kinematic and morphological centers spatially coincide within the size of the beam.
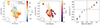 |
Fig. 5. J163026+4315 [CII] velocity field (left), velocity dispersion map (center), and rotation curve (right). The synthesized beam (θ = 0.60″ × 0.76″) is shown in the bottom-left corner of both maps. The solid gray line represents the major kinematic axis with a PA = 9°, where the kinematic center is inside the gray beam-size region at the center. The [CII] morphological major axis is represented with the dashed red line, with the peak of [CII] shown with a red cross. |
To measure the rotation curve, we placed circular apertures with a 0.4″ radius (comparable to the beam size) along the major kinematic axis, spaced by 0.25″. Within each aperture, we measured the central velocity to trace the rotation curve. The rotation curve and the velocity field reveal a gradient from north to south, and the dispersion map shows a centrally peaked velocity dispersion. Altogether, these kinematic characteristics, along with the alignment between the kinematic and morphological center and axes, hint at a rotating disk in J163026+4315 following the criteria described in Förster Schreiber & Wuyts (2020), although a merger cannot be excluded with the current data given the prevalence of merging activity among galaxies at these early epochs. Upcoming high-angular resolution observations with NOEMA will help clarify this scenario.
5. Conclusions
In this paper, we presented results from a NOEMA Band 3 pilot program targeting four luminous galaxies at z ∼ 6.
The main results are summarized as follows:
-
All four galaxies were detected in the [C II] line emission, and three were also detected in the dust continuum (see Fig. 2).
-
From the rest-frame UV and dust continuum emission, we measured obscured star-formation fractions in the fobs ∼ 0.5 − 0.8 range, comparable to that observed in other massive star-forming galaxies at z ≳ 4 (Fudamoto et al. 2020; Mitsuhashi et al. 2024; Algera et al. 2023).
-
We measured [C II]/FIR consistent with those of typical star-forming galaxies at z ≳ 4 (e.g., Spilker et al. 2016; Herrera-Camus et al. 2025) but elevated compared to local galaxies with similar LFIR (e.g., Herrera-Camus et al. 2018b; Lutz et al. 2016), as expected from more gas-rich high-z systems (e.g., Narayanan & Krumholz 2017). For the spatially resolved system J163026+4315, we also examined [C II]/FIR as a function of ΣFIR, which follows the tighter correlation observed in both nearby and high-redshift systems (e.g., Lutz et al. 2016; Herrera-Camus et al. 2018b, 2025).
-
We observe velocity offsets between the Lyα and [C II] lines in the range of ∼200–500 km s−1, consistent with values observed in other high-redshift systems (Baier-Soto et al. 2022; Hashimoto et al. 2019; Endsley et al. 2022) and with the low EW0(Lyα) and/or high MUV measured in our sources.
-
The spatially extended [C II] emission detected in J163026+4315 allows us to study its kinematics. We observe a north–south velocity gradient and a centrally peaked velocity dispersion. The rough alignment between the kinematic and morphological centers and axes provide tentative evidence that this galaxy may already host a rotating disk. Future NOEMA high-angular resolution observations will help confirm this interpretation.
Our study highlights the potential of NOEMA to probe the physical conditions and dynamical states of early galaxies, offering valuable insights into their formation and evolution. An important next step is to identify additional targets in the northern hemisphere and increase the number of high-resolution observations of both gas and dust. This will be essential for studying the physical processes that govern galaxy evolution in the early Universe.
Data availability
The NOEMA [CII] data cubes and dust continuum maps presented in this work are available at the CDS via https://cdsarc.cds.unistra.fr/viz-bin/cat/J/A+A/708/A361.
Acknowledgments
We thank the referee for very helpful comments and suggestions that improved the manuscript. R.H.-C. thanks the Max Planck Society for support under the Partner Group project “The Baryon Cycle in Galaxies” between the Max Planck for Extraterrestrial Physics and the Universidad de Concepción. R.H-C. also gratefully acknowledge financial support from ANID – MILENIO – NCN2024_112 and ANID BASAL FB210003. TN acknowledges the support of the Deutsche Forschungsgemeinschaft (DFG, German Research Foundation) under Germany’s Excellence Strategy – EXC-2094 – 390783311 of the DFG Cluster of Excellence ”ORIGINS”.
References
- Algera, H. S. B., Inami, H., Oesch, P. A., et al. 2023, MNRAS, 518, 6142 [Google Scholar]
- Baier-Soto, R., Herrera-Camus, R., Förster Schreiber, N. M., et al. 2022, A&A, 664, L5 [NASA ADS] [CrossRef] [EDP Sciences] [Google Scholar]
- Béthermin, M., Fudamoto, Y., Ginolfi, M., et al. 2020, A&A, 643, A2 [Google Scholar]
- Bisbas, T. G., Walch, S., Naab, T., et al. 2022, ApJ, 934, 115 [NASA ADS] [CrossRef] [Google Scholar]
- Bouwens, R. J., Smit, R., Schouws, S., et al. 2022, ApJ, 931, 160 [NASA ADS] [CrossRef] [Google Scholar]
- Carilli, C. L., & Walter, F. 2013, ARA&A, 51, 105 [NASA ADS] [CrossRef] [Google Scholar]
- Cassata, P., Morselli, L., Faisst, A., et al. 2020, A&A, 643, A6 [NASA ADS] [CrossRef] [EDP Sciences] [Google Scholar]
- De Looze, I., Cormier, D., Lebouteiller, V., et al. 2014, A&A, 568, A62 [NASA ADS] [CrossRef] [EDP Sciences] [Google Scholar]
- Díaz-Santos, T., Armus, L., Charmandaris, V., et al. 2017, ApJ, 846, 32 [Google Scholar]
- Endsley, R., Stark, D. P., Bouwens, R. J., et al. 2022, MNRAS, 517, 5642 [NASA ADS] [CrossRef] [Google Scholar]
- Erb, D. K., Steidel, C. C., Trainor, R. F., et al. 2014, ApJ, 795, 33 [Google Scholar]
- Faisst, A. L., Schaerer, D., Lemaux, B. C., et al. 2020, ApJS, 247, 61 [NASA ADS] [CrossRef] [Google Scholar]
- Förster Schreiber, N. M., & Wuyts, S. 2020, ARA&A, 58, 661 [Google Scholar]
- Fudamoto, Y., Oesch, P. A., Faisst, A., et al. 2020, A&A, 643, A4 [NASA ADS] [CrossRef] [EDP Sciences] [Google Scholar]
- Fujimoto, S., Silverman, J. D., Bethermin, M., et al. 2020, ApJ, 900, 1 [Google Scholar]
- Ginolfi, M., Jones, G. C., Béthermin, M., et al. 2020, A&A, 633, A90 [NASA ADS] [CrossRef] [EDP Sciences] [Google Scholar]
- Graciá-Carpio, J., Sturm, E., Hailey-Dunsheath, S., et al. 2011, ApJ, 728, L7 [Google Scholar]
- Guilloteau, S., & Lucas, R. 2000, in Imaging at Radio through Submillimeter Wavelengths, eds. J. G. Mangum, & S. J. E. Radford, ASP Conf. Ser., 217, 299 [Google Scholar]
- Harikane, Y., Ono, Y., Ouchi, M., et al. 2022, ApJS, 259, 20 [NASA ADS] [CrossRef] [Google Scholar]
- Hashimoto, T., Inoue, A. K., Mawatari, K., et al. 2019, PASJ, 71, 71 [Google Scholar]
- Hashimoto, T., Verhamme, A., Ouchi, M., et al. 2015, ApJ, 812, 157 [Google Scholar]
- Herrera-Camus, R., Bolatto, A. D., Wolfire, M. G., et al. 2015, ApJ, 800, 1 [Google Scholar]
- Herrera-Camus, R., Förster Schreiber, N. M., Price, S. H., et al. 2022, A&A, 665, L8 [NASA ADS] [CrossRef] [EDP Sciences] [Google Scholar]
- Herrera-Camus, R., González-López, J., Förster Schreiber, N., et al. 2025, A&A, 699, A80 [NASA ADS] [CrossRef] [EDP Sciences] [Google Scholar]
- Herrera-Camus, R., Sturm, E., Graciá-Carpio, J., et al. 2018a, ApJ, 861, 95 [Google Scholar]
- Herrera-Camus, R., Sturm, E., Graciá-Carpio, J., et al. 2018b, ApJ, 861, 94 [Google Scholar]
- Ikeda, R., Tadaki, K.-I., Mitsuhashi, I., et al. 2025, A&A, 693, A237 [NASA ADS] [CrossRef] [EDP Sciences] [Google Scholar]
- Jameson, K. E., Bolatto, A. D., Wolfire, M., et al. 2018, ApJ, 853, 111 [Google Scholar]
- Kaufman, M. J., Wolfire, M. G., Hollenbach, D. J., & Luhman, M. L. 1999, ApJ, 527, 795 [Google Scholar]
- Kroupa, P. 2001, MNRAS, 322, 231 [NASA ADS] [CrossRef] [Google Scholar]
- Langer, W. D., & Pineda, J. L. 2015, A&A, 580, A5 [NASA ADS] [CrossRef] [EDP Sciences] [Google Scholar]
- Le Fèvre, O., Béthermin, M., Faisst, A., et al. 2020, A&A, 643, A1 [Google Scholar]
- Lee, L. L., Förster Schreiber, N. M., Herrera-Camus, R., et al. 2025, A&A, 701, A260 [NASA ADS] [CrossRef] [EDP Sciences] [Google Scholar]
- Li, J., Da Cunha, E., González-López, J., et al. 2024, ApJ, 976, 70 [NASA ADS] [CrossRef] [Google Scholar]
- Lutz, D., Berta, S., Contursi, A., et al. 2016, A&A, 591, A136 [NASA ADS] [CrossRef] [EDP Sciences] [Google Scholar]
- Madau, P., & Dickinson, M. 2014, ARA&A, 52, 415 [Google Scholar]
- Malhotra, S., Kaufman, M. J., Hollenbach, D., et al. 2001, ApJ, 561, 766 [Google Scholar]
- Matsuoka, Y., Iwasawa, K., Onoue, M., et al. 2019, ApJ, 883, 183 [Google Scholar]
- Matsuoka, Y., Onoue, M., Kashikawa, N., et al. 2018, PASJ, 70, S35 [Google Scholar]
- Mitsuhashi, I., Tadaki, K.-I., Ikeda, R., et al. 2024, A&A, 690, A197 [NASA ADS] [CrossRef] [EDP Sciences] [Google Scholar]
- Murphy, E. J., Condon, J. J., Schinnerer, E., et al. 2011, ApJ, 737, 67 [Google Scholar]
- Narayanan, D., & Krumholz, M. R. 2017, MNRAS, 467, 50 [NASA ADS] [CrossRef] [Google Scholar]
- Rowland, L. E., Hodge, J., Bouwens, R., et al. 2024, MNRAS, 535, 2068 [Google Scholar]
- Salpeter, E. E. 1955, ApJ, 121, 161 [Google Scholar]
- Schaerer, D., Ginolfi, M., Béthermin, M., et al. 2020, A&A, 643, A3 [NASA ADS] [CrossRef] [EDP Sciences] [Google Scholar]
- Smith, J. D. T., Croxall, K., Draine, B., et al. 2017, ApJ, 834, 5 [Google Scholar]
- Spilker, J. S., Marrone, D. P., Aravena, M., et al. 2016, ApJ, 826, 112 [NASA ADS] [CrossRef] [Google Scholar]
- Steidel, C. C., Erb, D. K., Shapley, A. E., et al. 2010, ApJ, 717, 289 [Google Scholar]
- Verhamme, A., Schaerer, D., & Maselli, A. 2006, A&A, 460, 397 [NASA ADS] [CrossRef] [EDP Sciences] [Google Scholar]
- Wolfire, M. G., Hollenbach, D., & McKee, C. F. 2010, ApJ, 716, 1191 [Google Scholar]
- Wolfire, M. G., McKee, C. F., Hollenbach, D., & Tielens, A. G. G. M. 2003, ApJ, 587, 278 [Google Scholar]
- Wuyts, S., Labbé, I., Förster Schreiber, N. M., et al. 2008, ApJ, 682, 985 [NASA ADS] [CrossRef] [Google Scholar]
Appendix A: The sample
Table A.1 lists the main properties of the galaxies in our sample, including those derived from our NOEMA Band 3 observations. The Lyα redshifts listed in the table follow the numerical format of the discovery papers (Matsuoka et al. 2018, 2019), where values are reported with two decimal places. This rounding does not reflect the true measurement precision. As discussed in those works, Lyα can be significantly offset from the systemic redshift due to radiative transfer effects and IGM absorption. This scatter reflects a physical velocity difference rather than uncertainty in determining the Lyα peak position. The velocity offsets measured in this work therefore quantify the difference between Lyα and the systemic redshift traced by [C II], rather than being dominated by measurement errors in the Lyα redshift.
Characteristics of the target sources.
Table A.2 list the estimated values of star formation rate based on the UV and IR.
Appendix B: NOEMA observation summary
Table B.1 list a summary of the NOEMA observation properties.
All Tables
All Figures
|
Fig. 1. MUV as a function of redshift. The purple markers show the four galaxies in our sample. For comparison, we include galaxies from the ALPINE survey (Cassata et al. 2020), the REBELS survey (Bouwens et al. 2022), and from the CRISTAL survey (Herrera-Camus et al. 2025). The colored bars indicate the bandpasses used in each survey, illustrating their corresponding redshift ranges. Some REBELS sources appear outside the redshift range of Band 6 due to observations targeting other ISM tracers (e.g., the [O III]88μm transition). |
| In the text | |
|
Fig. 2. (Left) [CII] 158 μm spectrum of each galaxy, extracted inside a circular aperture of 1″ radius. (Center) Integrated intensity map of each galaxy. The contours show a 2σ detection (dotted line), then increase up to 9σ (solid lines) in 1σ steps. The color scale indicates the [C II]-integrated line flux in units of jansky-kilometre per second per beam. (Right) Dust continuum emission. The contours start at 2σ (dotted line), then increase up to 5σ (solid lines), also in 1σ steps. The color scale indicates the dust continuum flux in units of millijansky per beam. The beam size is shown in the bottom-left corner of both the integrated intensity and continuum maps. J152555+4304 was not detected in the continuum. |
| In the text | |
|
Fig. 3. [CII]/FIR as a function of FIR luminosity (left) for the three galaxies detected in the dust continuum, and as a function of ΣFIR (right) for the one extended galaxy where the size can be measured. For comparison, we show galaxies from the SHINING survey (z ∼ 0), galaxies at z ∼ 0 and 3 < z < 6, and from the ALPINE survey (z ∼ 4–6) (Lutz et al. 2016; Spilker et al. 2016; Béthermin et al. 2020), and a scaling relation for z ≳ 3 main-sequence star-forming galaxies from Herrera-Camus et al. (2025). |
| In the text | |
|
Fig. 4. Velocity offset between Lyα and [CII] emission lines as a function of Lyα equivalent width (left) and the absolute UV magnitude (right). We include galaxies from 6 ≲ z ≲ 8, 6.6 ≲ z ≲ 7, and z = 7.2 for comparison (Hashimoto et al. 2019; Endsley et al. 2022; Baier-Soto et al. 2022). The galaxies of this sample are shown in purple in both panels. |
| In the text | |
|
Fig. 5. J163026+4315 [CII] velocity field (left), velocity dispersion map (center), and rotation curve (right). The synthesized beam (θ = 0.60″ × 0.76″) is shown in the bottom-left corner of both maps. The solid gray line represents the major kinematic axis with a PA = 9°, where the kinematic center is inside the gray beam-size region at the center. The [CII] morphological major axis is represented with the dashed red line, with the peak of [CII] shown with a red cross. |
| In the text | |
Current usage metrics show cumulative count of Article Views (full-text article views including HTML views, PDF and ePub downloads, according to the available data) and Abstracts Views on Vision4Press platform.
Data correspond to usage on the plateform after 2015. The current usage metrics is available 48-96 hours after online publication and is updated daily on week days.
Initial download of the metrics may take a while.