| Issue |
A&A
Volume 698, June 2025
|
|
|---|---|---|
| Article Number | C1 | |
| Number of page(s) | 5 | |
| Section | Astrophysical processes | |
| DOI | https://doi.org/10.1051/0004-6361/202554679e | |
| Published online | 29 May 2025 | |
Towards multi-messenger observations of core-collapse supernovae harbouring choked jets (Corrigendum)
1
Ruhr University Bochum, Faculty of Physics and Astronomy, Astronomical Institute (AIRUB), Universitätsstraße 150, 44801 Bochum, Germany
2
Department of Physics, Ariel University, Ariel, Israel
3
Istituto Nazionale di Fisica Nucleare, Sezione di Roma, P. le Aldo Moro 2, I-00185 Rome, Italy
4
Dipartimento di Fisica dell’Università La Sapienza, P. le Aldo Moro 2, I-00185 Rome, Italy
5
Department of Physics, University of Florida, Gainesville, FL 32611-8440, USA
⋆ Corresponding author:This email address is being protected from spambots. You need JavaScript enabled to view it.
Key words: errata, addenda / methods: observational / surveys / stars: jets / supergiants / supernovae: general
1. Introduction
This erratum addresses a miscalculation of the limiting flux density per unit wavelength accessible by the ULTRASAT and Zwicky Transient Facility (ZTF) instruments. According to our new calculations, it is an order of magnitude lower than what we initially reported.
This revision impacts key conclusions regarding the detectability of core-collapse supernovae (CCSNe) with these instruments. In particular, while timing considerations for optimised combined detections remain unchanged, the maximum redshift at which these instruments can detect ultraviolet (UV) and optical signals from such explosions, which had been underestimated, is revised, leading to a more optimistic detection outlook. This correction suggests that a greater number of sources can be observed. The revised estimate of the maximum number of detectable sources has implications for the contribution of CCSNe to the diffuse high-energy neutrino flux, which may be higher than previously estimated. In the following, we summarise the key points related to this erratum and then rewrite the corresponding sections of the paper.
2. Key points
Regarding Eq. (7), the original manuscript reported  erg cm−3 s−1, but the correct value is
  erg cm−3 s−1. This implies that the detectability of UV and optical emissions from CCSNe was underestimated in the original paper. As result, Figs. 2 and 3 and the Appendix figures require updates, as do the conclusions of Sects. 3.1, 4, and 5.
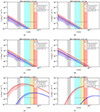 |
Fig. 2. Extinction-corrected specific intensities, fλ, observable at Earth from a RSG (in red) and BSG (in blue) located at z = 0.01, as expected from the model in Eq. (3). The fiducial parameters used in the computation for RSGs are R* = 722 R⊙, E = 1051 erg, Mej = 2.8 M⊙, and fρ = 1.455, and for BSGs R* = 50 R⊙, Mej = 10 M⊙, fρ = 0.0465, and E = 1051 erg. The solid lines show the expected emission with a median Galactic extinction EB − V = 0.04, and the corresponding shaded region the minimum and maximum extinction values, i.e. EB − V = 0.01 and EB − V = 0.25, respectively (see Fig. 1 in the original manuscript). The vertical shaded bands represent the wavelength range covered by each instrument: ULTRASAT (in grey) and ZTF with the g filter (in cyan), r filter (in yellow), and i filter (in red). The horizontal dashed grey and black lines define the |

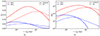 |
Fig. 3. Capability of detecting UV and optical emission from RSGs and BSGs with ULTRASAT and ZTF. (a) Maximum redshift at which RSGs and BSGs would have UV and optical emissions detectable by ULTRASAT and ZTF as a function of the emission time, t. (b) Rate of SNe II per year from RSGs and BSGs detectable with ULTRASAT and ZTF as a function of the emission time, t. In both panels, the following fiducial parameters are adopted: for RSGs R* = 722 R⊙, E = 1051 erg, Mej = 2.8 M⊙, and fρ = 1.455; for BSGs R* = 50 R⊙, Mej = 10 M⊙, fρ = 0.0465, and E = 1051 erg. The emission time corresponds to the time elapsed since the SBO. Results for RSGs and BSGs are shown in red and blue, respectively. The solid and dashed lines show ULTRASAT and ZTF results, respectively. |
Regarding the results, the number of Type II supernovae (SNe II) expected to be observable by ULTRASAT increases by ∼50%. Furthermore, up to 20% of detectable CCSNe from red supergiants (RSGs) could host choked jets, which could potentially contribute to the diffuse high-energy neutrinoflux.
Regarding the detectability estimates, RSG SNe are visible up to 1.2 Gpc (z ≃ 0.24) in the UV (ULTRASAT) and 920 Mpc (z ≃ 0.19) in the optical (ZTF). Blue supergiant (BSG) SNe are detectable up to 310 Mpc (z ≃ 0.07; ULTRASAT) and 220 Mpc (z ≃ 0.05; ZTF). ULTRASAT can detect ∼1300 RSGs and 65 BSGs per year, with 650 (20) RSGs (BSGs) detected in UV+optical with ULTRASAT+ZTF.
This implies that up to 20% of the detectable CCSNe from RSGs produce TeV neutrinos, meaning their their potential contribution to the cosmic diffuse neutrino flux is significantly higher. By optimising UV, optical, and neutrino follow-ups, the necessary local rate of CCSNe from RSGs harbouring choked jets, if these are the main sources responsible for the total IceCube neutrino flux, could be reached within four years of observations.
3. Updated sections
3.1. Abstract
In light of these realisations, we rewrite the abstract results as follows:
Results. We find that ULTRASAT will double the volume of the sky that is currently visible by ZTF for the same emitting sources. This will enlarge the sample of observed SNe II by ∼50%. For optimised multi-messenger detections, the delay between neutrinos produced at the shock breakout (SBO; during the jet propagation inside the stellar envelope) and ULTRASAT observations should be ∼4(5) days, with subsequent follow-up by instruments such as ZTF about one week later. We estimate that at most ∼20% of the CCSNe from RSG stars that are detectable in the UV with ULTRASAT host a choked jet and release TeV neutrinos. Electromagnetic and neutrino detections, if accompanied by additional photometric and spectroscopic follow-up with compelling evidence of a relativistic jet launched by the central engine of the source, would suggest that CCSNe harbouring choked jets are the main contributors to the diffuse astrophysical high-energy neutrino flux.
3.2. Section 3.1
As shown in Fig. 2, the lower value of  implies that, for representative RSGs and BSGs in an ambient medium with dust properties similar to those of our Galaxy, the UV emission from the SBO of either RSGs or BSGs would become visible to ULTRASAT approximately 5 minutes later, rather than the previously stated 30 minutes and 1 hour for RSGs and BSGs, respectively. Within 15 (30) minutes, the emission from RSGs (BSGs) can also be detected by ZTF. The signal from RSGs remains visible in both the optical and UV bands for approximately 6 months, whereas for BSGs it is expected to last only ∼3 weeks (∼4 months) before dropping below the detection threshold of ULTRASAT (ZTF). As such, the detectability of such sources is significantly higher than what was stated in the original version of the manuscript. Even at the upper end of the 2σ range for EB − V (see Fig. 1 in the original manuscript), the emission from RSGs (BSGs) becomes visible ∼15 (30) minutes after the SBO, instead of ∼1.5 (7) hours. Additionally, BSGs remain visible to ULTRASAT for up to 20 days and can also be detected by ZTF from a few hours to around 2 months after the SBO.
3.3. Section 4.1
Figure 3a allows us to draw the following conclusions: (i) For RSG progenitors, ULTRASAT (ZTF) can detect a UV (optical) signal from SBOs up to z ∼ 0.24 (0.19), corresponding to luminosity distances of ∼ 1.2 Gpc (920 Mpc), assuming the SBO occurs approximately 4 (10) days prior to detection. (ii) For BSG progenitors, ULTRASAT (ZTF) can detect SBO signals from BSGs up to z ∼ 0.07 (0.05), corresponding to luminosity distances of ∼310 (220) Mpc. About three weeks after the SBO, the signal from BSGs is no longer detectable by either instrument, while the signal from RSGs remains detectable for up to six months.
Figure 3b shows the expected rate of detectable SNe II as a function of time after the SBO event. Once ULTRASAT becomes operational, the multi-messenger and multi-wavelength community will benefit from at least as many, if not more, observations as in the optical domain. According to our assumptions, ULTRASAT will be able to detect up to ∼1300 (65) SNe II per year from RSGs (BSGs) if detection occurs within ∼4 (1) day(s) of the SBO. About 50% of those SNe will also be detected in the optical by ZTF, provided it captures optical emission within approximately 10 (2) days of the SBO for RSGs (BSGs).
We note that the ULTRASAT’s 5σ mean limiting magnitude,  , corresponds to a 900 s integration time. However, the nominal exposure time for individual observations is 300 s (Shvartzvald et al. 2023). The decision on whether transient alerts will be issued based on individual 300 s exposures or co-added stacks (i.e. 3 × 300 s) has not yet been finalised. We estimate the limiting magnitude for a 300 s exposure as mAB(300 s) = mAB(900 s)−1.25log10(900/300) = 21.8, which is valid under the assumptions of background-limited observations and Gaussian noise. This corresponds to a ∼0.7 magnitude reduction in sensitivity compared to stacked 900 s exposures, leading to an increase in the limiting flux by a factor of ∼1.7. Consequently, the maximum redshift for different progenitor types decreases; for example, for RSGs (BSGs), the maximum redshift drops from 0.25 (0.07) to 0.2 (0.06). On the other hand, 300 s exposures enable ULTRASAT to cover three times the sky area per unit time. Qualitatively, using the same calculations as for 900 s exposures and assuming the same field of view of 204 deg2, this implies an increase of up to approximately 35% in the number of observed sources. However, this gain comes at the cost of reduced sensitivity, resulting in fewer detections of faint and distant sources.
3.4. Section 4.2
The new results also have implications for neutrino studies. We used the local CCSN rate from RSGs, as estimated by Fasano et al. (2021), to explain the diffuse neutrino flux, rescaled using the CCSN limit set by IceCube, and compared it to the accessible volume for detections with ULTRASAT + ZTF, which we estimated. As the number of RSGs detectable in the UV (UV+optical) band by ULTRASAT (ULTRASAT+ZTF) has increased from ∼40 (20) per year within 360 Mpc to ∼1300 (650) within 1.2 Gpc, approximately 20% could host choked jets that possibly produce high-energy neutrino emissions, in contrast to the previously estimated 1%. These emissions could help explain the origin of the cosmic diffuse neutrino flux.
The local rate of choked jets necessary to account for the observed astrophysical neutrino flux from Fasano et al. (2021), when rescaled using the CCSN limit set by IceCube, could be reached within approximately four years. The new findings mean that the potential contribution of RSG CCSNe to the cosmic diffuse neutrino signal is significantly higher than previously believed.
3.5. Summary and conclusions
We list only the conclusions that differ from those originally published; all other conclusions remain unchanged.
-
The farthest distance at which a UV (optical) signal produced by the cooling emission after SBO in RSGs that can be detected by ULTRASAT (ZTF) is z ∼ 0.24 (0.19), or ∼ 1.2 Gpc (920 Mpc) if the SBO occurred ∼4 (10) days prior to detection.
-
ULTRASAT (ZTF) can detect signals from an SBO that occurred in BSGs located up to z ∼ 0.07 (0.05), or ∼310 (220) Mpc.
-
ULTRASAT will be able to detect up to 1300 (65) SNe II per year from RSGs (BSGs), for a set of exposures with a total duration of 900 s, if the detection occurs within ∼4 (1) days of the SBO.
-
Around 50% of SNe II detected by ULTRASAT can be accompanied by an optical detection by ZTF if it captures optical emission within ∼10 (2) days of the SBO for RSGs (BSGs).
-
Up to approximately 20% of detectable CCSNe from RSGs could host a choked jet that produces high-energy (> TeV) neutrinos. Since ULTRASAT is expected to detect ∼1300 RSGs per year in the UV band (and ULTRASAT+ZTF will detect ∼650 in UV+optical) within 1.2 Gpc, conducting UV, optical, and neutrino follow-ups over several years will be essential to definitively constraining the contribution of RSGs to the cosmic diffuse neutrino flux.
Although our findings suggest that ZTF’s maximum detectable CCSN rate exceeds its actual detection capacity, this discrepancy arises because our prediction assumes that all SNe are observed approximately 10 days after SBO, when their emission peaks according to our model. In reality, this idealised scenario does not fully reflect observational conditions.
More precisely, ZTF detects approximately 300 CCSNe per year, with around 180 being Type II-P and II-L, the focus of this work. This sample primarily includes the most luminous events, but it is worth considering that approximately 200 SNe detected by ZTF as well remain ‘unclassified’ due to their low luminosity, hence the number of Type II-P and II-L might be higher. According to Perley et al. (2020), SNe II account for around 20% of this subsample (see Fig. 6). Even considering this, ZTF is estimated to detect no more than around 200 CCSNe of interest annually. As shown in Fig. 3b, this aligns with current surveys, where ZTF detects up to around 200 CCSNe per year when observations occur within a few days of the event.
Furthermore, we adopted the 5σ median sensitivity across all filters (g, r, and i bands) and lunar phases for a 30-second exposure, finding  (see Sect. 3 in the original paper and Bellm et al. 2019). However, publicly available Transient Name Server classifications (https://sites.astro.caltech.edu/ztf/bts), used to derive the above estimates, indicate that detected SN events often have magnitudes below 19. This is likely due to selection cuts or data limitations that exclude sources based on criteria such as luminosity or signal-to-noise ratio.
4. Data availability
Movie associated to Fig. 2 is available at https://www.aanda.org
Movie
Movie 1 Access Supplementary Material
References
- Bellm, E. C., Kulkarni, S. R., Graham, M. J., et al. 2019, PASP, 131, 018002 [Google Scholar]
- Fasano, M., Celli, S., Guetta, D., et al. 2021, JCAP, 2021, 044 [CrossRef] [Google Scholar]
- Perley, D. A., Fremling, C., Sollerman, J., et al. 2020, ApJ, 904, 35 [NASA ADS] [CrossRef] [Google Scholar]
- Shvartzvald, Y., Waxman, E., Gal-Yam, A., et al. 2023, arXiv e-prints [arXiv:2304.14482] [Google Scholar]
Appendix
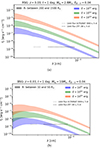 |
Fig. A.1. Model specific intensities, fλ (Eq. 3) observed at Earth from RSGs (a) and BSGs (b) located at z = 0.03 and hosted in a galaxy with extinction value EB − V (median value from Fig. 1). Blue, green, and orange shaded regions show results for explosion energies E = 1051 erg, E = 1052 erg, and E = 1053 erg, respectively. (a) RSG progenitor. The shaded regions reflect the variation in the progenitor radius between 200 and 1500 R⊙ with a fixed ejected mass of Mej = 2.8 M⊙ (the fiducial parameter). (b) BSG progenitor. The shaded regions reflect the variation in the progenitor radius between 10 and 50 R⊙ with a fixed ejected mass of Mej = 10 M⊙ (the fiducial parameter). The |

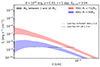 |
Fig. A.2. Model specific intensities, fλ (Eq. 3) observed at Earth from RSGs (in red) and BSGs (in blue) located at z = 0.03 and hosted in a galaxy with extinction value EB − V (the median value from Fig. 1). For each progenitor type, fiducial parameters are used (for RSGs R* = 722 R⊙, E = 1051 erg, and fρ = 1.455; for BSGs R* = 50 R⊙, fρ = 0.0465, and E = 1051 erg,), apart from the ejected mass, Mej, which is allowed to vary between 1 and 10 M⊙. The |

© The Authors 2025
 Open Access article, published by EDP Sciences, under the terms of the Creative Commons Attribution License (https://creativecommons.org/licenses/by/4.0), which permits unrestricted use, distribution, and reproduction in any medium, provided the original work is properly cited.
This article is published in open access under the Subscribe to Open model. This email address is being protected from spambots. You need JavaScript enabled to view it. to support open access publication.
All Figures
|
Fig. 2. Extinction-corrected specific intensities, fλ, observable at Earth from a RSG (in red) and BSG (in blue) located at z = 0.01, as expected from the model in Eq. (3). The fiducial parameters used in the computation for RSGs are R* = 722 R⊙, E = 1051 erg, Mej = 2.8 M⊙, and fρ = 1.455, and for BSGs R* = 50 R⊙, Mej = 10 M⊙, fρ = 0.0465, and E = 1051 erg. The solid lines show the expected emission with a median Galactic extinction EB − V = 0.04, and the corresponding shaded region the minimum and maximum extinction values, i.e. EB − V = 0.01 and EB − V = 0.25, respectively (see Fig. 1 in the original manuscript). The vertical shaded bands represent the wavelength range covered by each instrument: ULTRASAT (in grey) and ZTF with the g filter (in cyan), r filter (in yellow), and i filter (in red). The horizontal dashed grey and black lines define the |
| In the text | |
|
Fig. 3. Capability of detecting UV and optical emission from RSGs and BSGs with ULTRASAT and ZTF. (a) Maximum redshift at which RSGs and BSGs would have UV and optical emissions detectable by ULTRASAT and ZTF as a function of the emission time, t. (b) Rate of SNe II per year from RSGs and BSGs detectable with ULTRASAT and ZTF as a function of the emission time, t. In both panels, the following fiducial parameters are adopted: for RSGs R* = 722 R⊙, E = 1051 erg, Mej = 2.8 M⊙, and fρ = 1.455; for BSGs R* = 50 R⊙, Mej = 10 M⊙, fρ = 0.0465, and E = 1051 erg. The emission time corresponds to the time elapsed since the SBO. Results for RSGs and BSGs are shown in red and blue, respectively. The solid and dashed lines show ULTRASAT and ZTF results, respectively. |
| In the text | |
|
Fig. A.1. Model specific intensities, fλ (Eq. 3) observed at Earth from RSGs (a) and BSGs (b) located at z = 0.03 and hosted in a galaxy with extinction value EB − V (median value from Fig. 1). Blue, green, and orange shaded regions show results for explosion energies E = 1051 erg, E = 1052 erg, and E = 1053 erg, respectively. (a) RSG progenitor. The shaded regions reflect the variation in the progenitor radius between 200 and 1500 R⊙ with a fixed ejected mass of Mej = 2.8 M⊙ (the fiducial parameter). (b) BSG progenitor. The shaded regions reflect the variation in the progenitor radius between 10 and 50 R⊙ with a fixed ejected mass of Mej = 10 M⊙ (the fiducial parameter). The |
| In the text | |
|
Fig. A.2. Model specific intensities, fλ (Eq. 3) observed at Earth from RSGs (in red) and BSGs (in blue) located at z = 0.03 and hosted in a galaxy with extinction value EB − V (the median value from Fig. 1). For each progenitor type, fiducial parameters are used (for RSGs R* = 722 R⊙, E = 1051 erg, and fρ = 1.455; for BSGs R* = 50 R⊙, fρ = 0.0465, and E = 1051 erg,), apart from the ejected mass, Mej, which is allowed to vary between 1 and 10 M⊙. The |
| In the text | |
Current usage metrics show cumulative count of Article Views (full-text article views including HTML views, PDF and ePub downloads, according to the available data) and Abstracts Views on Vision4Press platform.
Data correspond to usage on the plateform after 2015. The current usage metrics is available 48-96 hours after online publication and is updated daily on week days.
Initial download of the metrics may take a while.