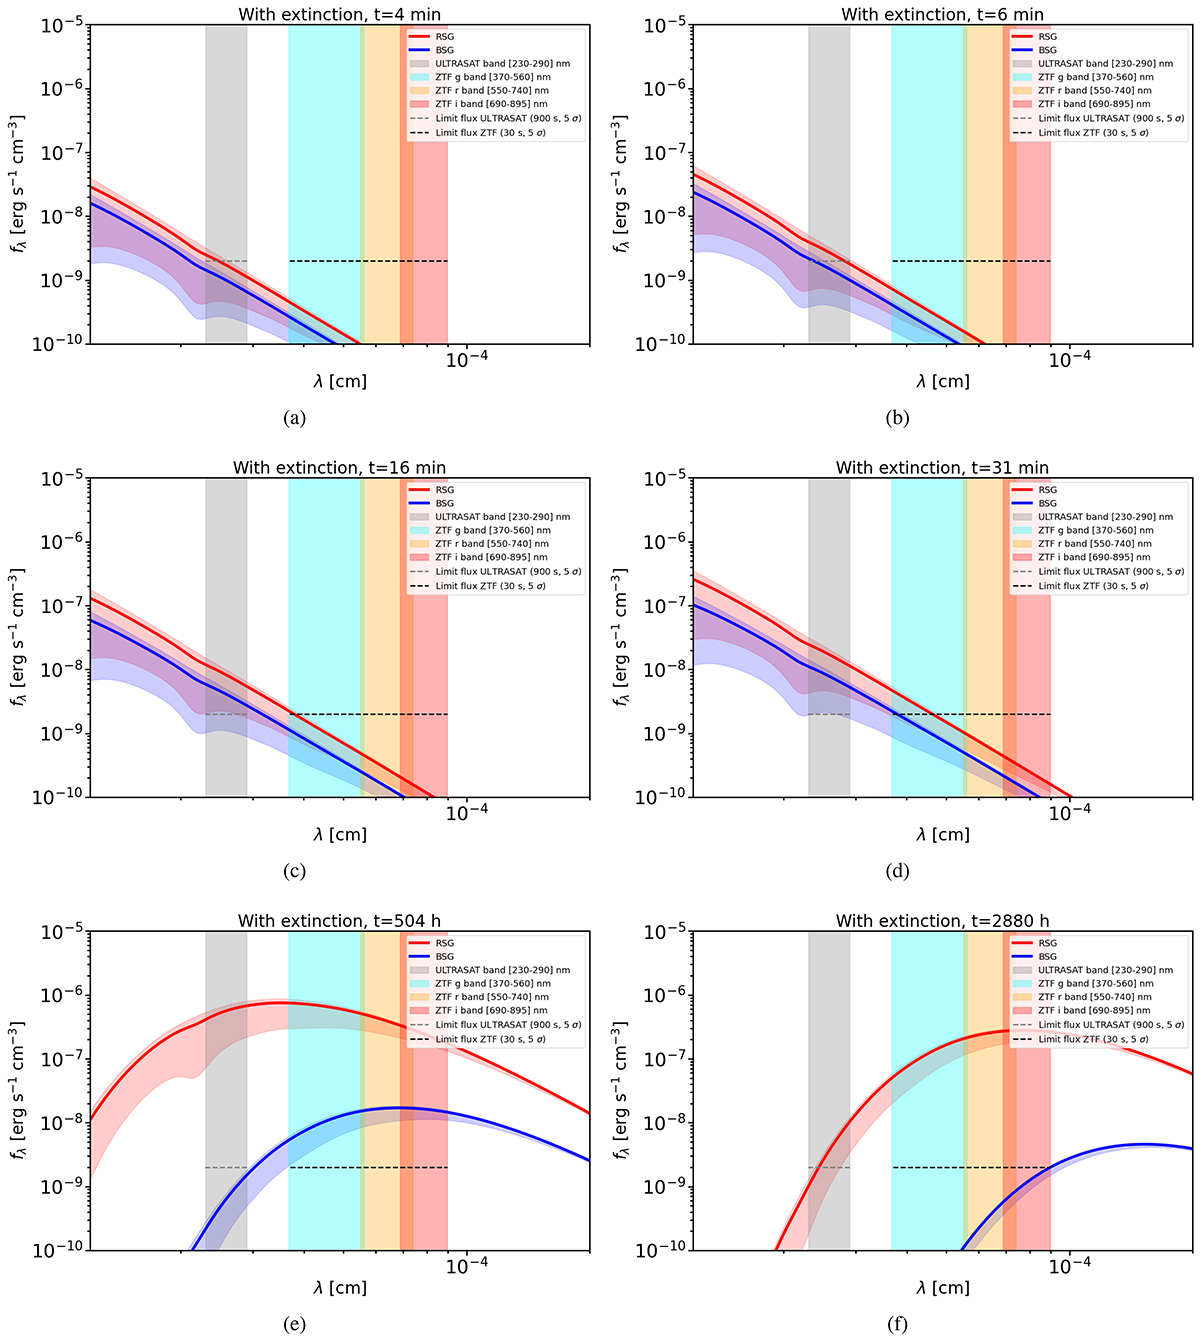
Fig. 2.
Download original image
Extinction-corrected specific intensities, fλ, observable at Earth from a RSG (in red) and BSG (in blue) located at z = 0.01, as expected from the model in Eq. (3). The fiducial parameters used in the computation for RSGs are R* = 722 R⊙, E = 1051 erg, Mej = 2.8 M⊙, and fρ = 1.455, and for BSGs R* = 50 R⊙, Mej = 10 M⊙, fρ = 0.0465, and E = 1051 erg. The solid lines show the expected emission with a median Galactic extinction EB − V = 0.04, and the corresponding shaded region the minimum and maximum extinction values, i.e. EB − V = 0.01 and EB − V = 0.25, respectively (see Fig. 1 in the original manuscript). The vertical shaded bands represent the wavelength range covered by each instrument: ULTRASAT (in grey) and ZTF with the g filter (in cyan), r filter (in yellow), and i filter (in red). The horizontal dashed grey and black lines define the ![]() of the two instruments, obtained following Eq. (7). Panels (a) to (f) show the different evolution times, from ∼5 minutes to ∼4 months after the SBO event, highlighting for each stellar progenitor the time range when the emission was visible to ULTRASAT and ZTF. The temporal evolution from 1 minute to 1 year of fλ coming from RSGs and BSGs shown here is available as an online animation.
of the two instruments, obtained following Eq. (7). Panels (a) to (f) show the different evolution times, from ∼5 minutes to ∼4 months after the SBO event, highlighting for each stellar progenitor the time range when the emission was visible to ULTRASAT and ZTF. The temporal evolution from 1 minute to 1 year of fλ coming from RSGs and BSGs shown here is available as an online animation.
Current usage metrics show cumulative count of Article Views (full-text article views including HTML views, PDF and ePub downloads, according to the available data) and Abstracts Views on Vision4Press platform.
Data correspond to usage on the plateform after 2015. The current usage metrics is available 48-96 hours after online publication and is updated daily on week days.
Initial download of the metrics may take a while.