| Issue |
A&A
Volume 690, October 2024
|
|
|---|---|---|
| Article Number | A18 | |
| Number of page(s) | 14 | |
| Section | Planets and planetary systems | |
| DOI | https://doi.org/10.1051/0004-6361/202451313 | |
| Published online | 26 September 2024 | |
Mass determination of two Jupiter-sized planets orbiting slightly evolved stars: TOI-2420 b and TOI-2485 b
1
INAF – Osservatorio Astrofisico di Torino,
Via Osservatorio 20,
10025
Pino Torinese,
Italy
2
Instituto de Astrofísica de Canarias (IAC),
38205
La Laguna, Tenerife,
Spain
3
Departamento de Astrofísica, Universidad de La Laguna (ULL),
38206
La Laguna, Tenerife,
Spain
4
Sub-department of Astrophysics, Department of Physics, University of Oxford,
Oxford,
OX1 3RH,
UK
5
Chalmers University of Technology, Department of Space, Earth and Environment, Onsala Space Observatory,
439 92
Onsala,
Sweden
6
Leiden Observatory, University of Leiden,
PO Box 9513,
2300
RA,
Leiden,
The Netherlands
7
Institute of Planetary Research, German Aerospace Center (DLR),
Rutherfordstrasse 2,
12489
Berlin,
Germany
8
INAF – Osservatorio Astrofisico di Catania,
Via S. Sofia 78,
95123
Catania,
Italy
9
Dipartimento di Fisica, Università degli Studi di Torino,
via Pietro Giuria 1,
10125
Torino,
Italy
10
Department of Astronomy, The Ohio State University,
4055 McPherson Laboratory, 140 West 18th Avenue,
Columbus,
OH
43210,
USA
11
Mullard Space Science Laboratory, University College London, Holmbury St Mary, Dorking,
Surrey
RH5 6NT,
UK
12
European Southern Observatory,
Karl-Schwarzschild-Straße 2,
85748
Garching bei Munchen,
Germany
13
Facultad de Ingeniera y Ciencias, Universidad Adolfo Ibáñez,
Av. Diagonal las Torres 2640,
Peñalolén, Santiago,
Chile
14
Millennium Institute for Astrophysics,
Chile
15
NASA Exoplanet Science Institute-Caltech/IPAC,
Pasadena,
CA
91125,
USA
16
Center for Astrophysics | Harvard & Smithsonian,
60 Garden Street,
Cambridge,
MA
02138,
USA
17
Department of Astronomy and McDonald Observatory, University of Texas at Austin,
2515 Speedway, Stop C1400,
Austin,
TX
78712,
USA
18
NSF National Optical-Infrared Astronomy Research Laboratory,
950 N. Cherry Ave.,
Tucson,
AZ
85719,
USA
19
Department of Astronomy, California Institute of Technology,
Pasadena,
CA
91125,
USA
20
Thüringer Landessternwarte Tautenburg,
Sternwarte 5,
07778
Tautenberg,
Germany
21
Astrophysics Group, Keele University,
Staffordshire
ST5 5BG,
UK
22
Astronomical Institute, Czech Academy of Sciences,
Fričova 298,
25165
Ondřejov,
Czech Republic
23
Lund Observatory, Division of Astrophysics, Department of Physics, Lund University,
Box 43,
22100
Lund,
Sweden
24
Institute of Astronomy, Faculty of Physics, Astronomy and Informatics, Nicolaus Copernicus University,
Grudziądzka 5,
87-100
Toruń,
Poland
25
Center for Data Intensive and Time Domain Astronomy, Department of Physics and Astronomy, Michigan State University,
East Lansing,
MI
48824,
USA
26
University of Southern Queensland, Centre for Astrophysics, UniSQ Toowoomba,
West Street,
QLD
4350,
Australia
27
Department of Physics, Engineering and Astronomy, Stephen F. Austin State University,
1936 North St,
Nacogdoches,
TX
75962,
USA
28
NASA Goddard Space Flight Center,
Greenbelt,
MD
20771,
USA
29
Jet Propulsion Laboratory, California Institute of Technology,
Pasadena,
CA
91109,
USA
30
Department of Astronomy, University of California Berkeley,
Berkeley,
CA
94720,
USA
31
Max-Planck-Institut für Astronomie,
Königstuhl 17,
69117
Heidelberg,
Germany
32
Space Telescope Science Institute,
3700 San Martin Drive,
Baltimore,
MD
21218,
USA
33
Department of Physics & Astronomy, Texas Tech University,
Lubbock,
TX
79410-1051,
USA
34
Department of Physics and Kavli Institute for Astrophysics and Space Research, Massachusetts Institute of Technology,
77 Massachusetts Avenue,
Cambridge,
MA
02139,
USA
35
Department of Astronomy, University of Florida,
Gainesville,
FL
32611,
USA
36
Observatoire de Genève, Département d’Astronomie, Université de Genève,
Chemin Pegasi 51b,
1290
Versoix,
Switzerland
37
NASA Ames Research Center,
Moffett Field,
CA
94035,
USA
38
Department of Physics and Astronomy, University of New Mexico,
210 Yale Blvd NE,
Albuquerque,
NM,
USA
39
Komaba Institute for Science, The University of Tokyo,
3-8-1 Komaba, Meguro,
Tokyo
153-8902,
Japan
40
Astrobiology Center,
2-21-1 Osawa, Mitaka,
Tokyo
181-8588,
Japan
41
Instituto de Astrofísica, Facultad de Física, Pontificia Universidad Católica de Chile,
Chile
42
Department of Astronomy, University of Maryland,
College Park,
College Park,
MD
20742,
USA
43
Department of Astronomy/Steward Observatory, The University of Arizona,
933 North Cherry Avenue,
Tucson,
AZ
85721,
USA
44
Department of Earth, Atmospheric and Planetary Sciences, Massachusetts Institute of Technology,
77 Massachusetts Avenue,
Cambridge,
MA
02139,
USA
45
Department of Aeronautics and Astronautics, Massachusetts Institute of Technology,
77 Massachusetts Avenue,
Cambridge,
MA
02139,
USA
46
SETI Institute,
339 N Bernardo Ave Suite 200,
Mountain View,
CA
94043,
USA
47
Department of Physics & Astronomy, Vanderbilt University,
Nashville,
TN,
USA
48
Hazelwood Observatory,
Australia
49
Department of Astronomy, Sofia University “St Kliment Ohridski”,
5 James Bourchier Blvd,
BG-1164
Sofia,
Bulgaria
50
Landessternwarte, Zentrum für Astronomie der Universität Heidelberg,
Königstuhl 12,
69117
Heidelberg,
Germany
51
CAS Key Laboratory of Planetary Sciences, Purple Mountain Observatory, Chinese Academy of Sciences,
Nanjing
210008,
China
52
Department of Astrophysical Sciences, Princeton University,
Princeton,
NJ
08544,
USA
Received:
30
June
2024
Accepted:
8
August
2024
Context. Hot and warm Jupiters might have undergone the same formation and evolution path, but the two populations exhibit different distributions of orbital parameters. This challenges our understanding of their actual origin.
Aims. We report the results of our warm Jupiters survey, which was carried out with the CHIRON spectrograph within the KESPRINT collaboration. We addressed the question of the population origin by studying two planets that might help to bridge the gap between the two populations.
Methods. We confirm two planets and determine their mass. One is a hot Jupiter (with an orbital period shorter than 10 days), TOI-2420 b, and the other is a warm Jupiter, TOI-2485 b. We analyzed them using a wide variety of spectral and photometric data in order to characterize these planetary systems.
Results. We found that TOI-2420 b has an orbital period of Pb=5.8 days, a mass of Mb=0.9 MJ, and a radius of Rb=1.3 RJ, with a planetary density of 0.477 g cm−3. TOI-2485 b has an orbital period of Pb=11.2 days, a mass of Mb=2.4 MJ, and a radius of Rb=1.1 RJ with a density of 2.36 g cm−3.
Conclusions. With the current parameters, the migration history for TOI-2420 b and TOI-2485 b is unclear: Scenarios of a high-eccentricity migration cannot be ruled out, and the characteristics of TOI-2485 b even support this scenario.
Key words: planets and satellites: detection / planets and satellites: gaseous planets
© The Authors 2024
 Open Access article, published by EDP Sciences, under the terms of the Creative Commons Attribution License (https://creativecommons.org/licenses/by/4.0), which permits unrestricted use, distribution, and reproduction in any medium, provided the original work is properly cited.
This article is published in open access under the Subscribe to Open model. Subscribe to A&A to support open access publication.
1 Introduction
Almost 30 years after the discovery of the first hot Jupiter (HJ), 51 Peg b (Mayor & Queloz 1995), the formation and migration history of close-in giant planets is still debated. The orbit of 51 Peg b was a great surprise to astronomers at the time (see e.g. Guillot et al. 1996, who state that the newly discovered planet ‘is surely the most problematic find in recent memory’). A planet with a mass comparable to that of Jupiter that moved on an orbit extremely close to its host star contradicted the prevailing understanding of planet formation at the time, which was based solely on our knowledge of the Solar System1.
The planet 51 Peg b was the first of a population that quickly became known as hot Jupiters (e.g. Schilling 1996). They are giant planets orbiting their host stars with periods shorter than about 10 days. In the years that followed, more exoplanets were discovered, and a number of warm Jupiters (WJs) were also found. These are giant planets with orbital periods between 10 and 200 days (e.g., Dawson & Johnson 2018). This is again dramatically different to the planets in our own Solar System. The origin of both HJs and WJs has been heavily debated.
The two populations could have originated through in situ formation (Boss 1997), disk migration (Lin & Papaloizou 1986), or high-eccentricity migration (Wu & Murray 2003). However, the two populations present differences in some of their properties that we list below.
- a)
The occurrence rate of WJs per log interval of period is lower than that for HJs (see the histogram in Fig. 4 of Dawson & Johnson 2018), but the total occurrence rate of WJs is higher (i.e., Wittenmyer et al. 2010; Zink & Howard 2023).
- b)
Most HJs present low eccentricities, but WJs present a wide range of eccentricities (i.e., Correia et al. 2020; Zink & Howard 2023);
- c)
Hot Jupiters generally lack nearby companions, but super-Earths have been found nearby WJs (Huang et al. 2016), even though recent studies have demonstrated that a fraction of the HJs ⩾12±6% have nearby small (1–4 R⊕) companions (Wu et al. 2023) and ~30% of the HJs have at least one warm- or cold-Jupiter companion (Zink & Howard 2023).
These differences are likely related to the formation site and migration history of the planets involved. For example, disk migration is thought to be the primary mechanism that produces HJs, but cannot explain the wide eccentricity distribution of WJs. On the other hand, WJs might have experienced high-eccentricity tidal migration, but this mechanism is more efficient for closer WJs because the tidal dissipation strongly depends on the semimajor axis. It is thus important to study HJs and WJs and assess the relative effectiveness of the different formation scenarios proposed for these planets (for a more comprehensive overview of the different theories of the formation and evolution of close-in giant planets as well as of the similarities and dissimilarities of HJs and WJs, see Sect. 4.3 in Dawson & Johnson 2018).
In the past few years, the Transiting Exoplanet Survey Satellite (TESS; Ricker et al. 2014) released data for thousands of planetary candidates, and the exoplanetary community have put substantial effort into the radial velocity (RV) follow-up with ground-based spectrographs in order to confirm the planetary nature and determine the mass of the candidates. With this effort, many HJs and WJs have been confirmed (144 in total), allowing us to greatly improve the statistical significance of our sample and thus to improve our understanding of the difference between these two populations.
In this paper, we present the mass determination of two close-in giant planets, one HJ, TOI-2420 b, and one WJ, TOI-2485 b. We present the observations of the two targets, including TESS photometry, ground-based photometry, and spectroscopy, in Section 2 and the stellar characterization in Section 3. We model the planetary systems with the transit and RV joint fit by analyzing the photometry together with the transit fit and RV modeling in Section 4. Finally, we discuss our results and present our conclusions in Section 5.
2 Observations
2.1 TESS photometry
TOI-2420 (TIC 268532343, Table 1) was observed by TESS between 2018 September 20 and 2019 January 24 in sector 3 on CCD1 of Camera 1 and between 2020 September 23 and 2020 November 20 in sector 30 on CCD1 of Camera 1. The alert went out on 2020 November 25. TOI-2485 (TIC 328934463, Table 1) was observed between 2020 March 19 and 2020 May 04 in sector 23 on CCD4 of Camera 2 and between 2022 March 26 and 2022 May 11 in sector 50 on CCD3 of Camera 2. The alert went out on 2021 February 11. The data taken in each sector were observed with cadences of 30 min, 10 min, 30 min, and 2 min, respectively. The data were reduced with both the MIT Quick-Look Pipeline (QLP; Huang et al. 2020; Kunimoto et al. 2021) and the pipeline of the TESS Science Processing Operations Center (SPOC; Jenkins et al. 2010). The SPOC pipeline was adapted from the Kepler mission pipeline at NASA Ames Research Center. The pipeline uses simple-aperture photometry (SAP; Twicken et al. 2010) to produce time-series light curves. A further presearch data conditioning (PDCSAP) algorithm was subsequently used to correct for common instrumental systematics in the data (Stumpe et al. 2012; Smith et al. 2012). For the sector 50 short-cadence data of TOI-2485, we downloaded the SPOC light curve from the Mikulski Archive for Space Telescopes (MAST2). For the other data, we downloaded light curves extracted from the TESS-SPOC pipeline (Caldwell et al. 2020), which followed the same reduction routines as SPOC, but were processed from TESS full-frame images.
Transit searches and signal assessments were performed with both the SPOC and the QLP pipelines. The light curves were further analyzed using the transit-search algorithm, DST (Détection Spécialisée de Transits; Cabrera et al. 2012). In the QLP and DST pipelines, a transit signal was detected in the TOI-2420 data with a period P = 5.84115 ± 0.00257 days, an epoch T0,btjd = 1388.41352 ± 0.00280 (where BTJD is defined as BJD-7000), a transit duration T14 = 4.33 ± 0.16 h, and a transit depth df = 0.3023 ± 0.0185%. In the TOI-2485 light curves, a transit signal with P = 11.23702 ± 0.00654 days, T0,btjd = 1939.78211 ± 0.00327, T14 = 6.94 ± 0.19 h, and df = 0.5328 ± 0.0231% was detected.
We iteratively searched for further transit signatures in both datasets after transit signals of the first planet candidates were filtered out. No additional transiting candidates were detected in either system. No clear periodic variability was found in the TESS light curves either.
2.2 Ground-based photometry
The TESS pixel scale is ~21″ pixel−1, and photometric apertures typically extend out to roughly one arcminute, which generally causes multiple stars to blend in the TESS photometric aperture. To attempt to determine the true source of the TESS detection, we acquired ground-based time-series follow-up photometry of the fields around TOI-2420 and TOI-2485 as part of the TESS Follow-up Observing Program (TFOP; Collins 2019)3. We used the TESS Transit Finder, which is a customized version of the Tapir software package (Jensen 2013), to schedule our transit observations.
2.2.1 WASP
The Wide-Angle Search for Planets (WASP-South) was the southern station of the WASP transit-search survey (Pollacco et al. 2006) and consisted of an array of eight wide-field cameras that observed the fields with a typical cadence of 10 min. The field of TOI-2420 was observed over spans of 160 to 180 nights in each year from 2006 to 2011. In all, 21 150 photometric observations were obtained, using an extraction aperture of 48″, within which TOI-2420 was the only bright star.
While TOI-2420b was not a WASP candidate with hindsight, we note that the standard WASP transit-search algorithm finds the 0.3% deep transit and reports an ephemeris of
![$\[\text { TDB }(\text {JD})=2454432.934 \pm 0.012+N \times 5.84265 \pm 0.00014.\]$](/articles/aa/full_html/2024/10/aa51313-24/aa51313-24-eq1.png)
We also searched the WASP light curve for any rotational modulation. We computed the generalized Lomb–Scargle (GLS) periodograms (Zechmeister & Kürster 2009) and estimated the false-alarm probability (FAP) via a bootstrap method (Murdoch et al. 1993; Hatzes 2016) that generated 1000 artificial photometric datasets obtained from the real data by making random permutations in the photometry values. We found the maximum period at ~ 36 days with an FAP lower than 10−6 (see Fig. 1).
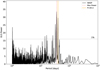 |
Fig. 1 GLS periodogram of the WASP-South data for TOI-2420 from 2006 to 2011. There is a possible signal near 40 days, along with aliases from the yearly sampling. The dotted horizontal line is the 1% likelihood false-alarm level. |
2.2.2 Las Cumbres Observatory Global Telescope
We observed a partial transit window of the planet candidate TOI-2420.01 in Sloan i′ on UTC 2020 December 11 from the Las Cumbres Observatory Global Telescope (LCOGT) (Brown et al. 2013) 1 m network node at Cerro Tololo Inter-American Observatory in Chile (CTIO). We also observed a full transit window by alternating in Sloan g′ and Sloan i′ on UTC 2021 September 29 from another LCOGT 1 m network node at McDonald Observatory near Fort Davis, Texas, United States (McD). The 1 m telescopes are equipped with a 4096 × 4096 SINISTRO camera with an image scale of ![$\[0^{\prime\prime}_\cdot389\]$](/articles/aa/full_html/2024/10/aa51313-24/aa51313-24-eq2.png) per pixel, resulting in a 26′ × 26′ field of view, the images were calibrated by the standard LCOGT BANZAI pipeline (McCully et al. 2018), and differential photometric data were extracted using AstroImageJ (Collins et al. 2017). We used circular photometric apertures with a radius of
per pixel, resulting in a 26′ × 26′ field of view, the images were calibrated by the standard LCOGT BANZAI pipeline (McCully et al. 2018), and differential photometric data were extracted using AstroImageJ (Collins et al. 2017). We used circular photometric apertures with a radius of ![$\[7^{\prime\prime}_\cdot0\]$](/articles/aa/full_html/2024/10/aa51313-24/aa51313-24-eq3.png) . The target star aperture excluded all of the flux from the nearest known neighbor in the Gaia DR3 catalog (Gaia DR3 2356241534150962944), which is ~49″ south of TOI-2420. The light-curve data are available on the EXOFOP-TESS website4 and are included in the global modeling described in Section 4.
. The target star aperture excluded all of the flux from the nearest known neighbor in the Gaia DR3 catalog (Gaia DR3 2356241534150962944), which is ~49″ south of TOI-2420. The light-curve data are available on the EXOFOP-TESS website4 and are included in the global modeling described in Section 4.
2.2.3 KeplerCam
We observed a partial transit window of the planetary candidate TOI-2485.01 in Sloan i′ on UTC 2021 April 17 with KeplerCam, which is installed on the 1.2 m telescope at the Fred Lawrence Whipple Observatory. The 4096 × 4096 Fairchild CCD 486 detector has an image scale of ![$\[0^{\prime\prime}_\cdot672\]$](/articles/aa/full_html/2024/10/aa51313-24/aa51313-24-eq4.png) per 2 × 2 binned pixel, resulting in a field of view of
per 2 × 2 binned pixel, resulting in a field of view of ![$\[23^{\prime\prime}_\cdot1 \times23^{\prime\prime}_\cdot1\]$](/articles/aa/full_html/2024/10/aa51313-24/aa51313-24-eq5.png) . The images were calibrated, and photometric data were extracted with AstroImageJ using a circular aperture with a radius of
. The images were calibrated, and photometric data were extracted with AstroImageJ using a circular aperture with a radius of ![$\[6^{\prime\prime}_\cdot7\]$](/articles/aa/full_html/2024/10/aa51313-24/aa51313-24-eq6.png) . The target star aperture excluded all of the flux from the nearest known neighbor in the Gaia DR3 catalog (Gaia DR3 1443530261849361152), which is ~16″ north of TOI-2485. The light-curve data are available on the EXOFOP-TESS website5 and are included in the global modeling described in Section 4.
. The target star aperture excluded all of the flux from the nearest known neighbor in the Gaia DR3 catalog (Gaia DR3 1443530261849361152), which is ~16″ north of TOI-2485. The light-curve data are available on the EXOFOP-TESS website5 and are included in the global modeling described in Section 4.
2.3 Ground-based spectroscopy
We collected RVs with different ground-based instruments.
2.3.1 CHIRON
We observed TOI-2420 and TOI-2485 with the spectrograph CHIRON at the SMARTS 1.5-m telescope at Cerro Tololo Inter-American Observatory, Chile (Tokovinin et al. 2013), within the large observing program (ID: CARL-20B-3081, PI: Carleo) that surveys a sample of ~20 WJs within the KESPRINT collaboration6 (i.e., de Leon et al. 2021; Smith et al. 2022; Tran et al. 2022; Kabáth et al. 2022; Korth et al. 2023) with the aim to confirm and characterize planet candidates from the space missions K2 and TESS. The CHIRON observations were performed in Slicer mode and reached a spectral resolving power of R = 80000 over the wavelength range of 4100 to 8700 Å. We collected 18 CHIRON spectra for TOI-2420 and 14 spectra for TOI-2485. The data reduction was performed through the official spectral extraction pipeline of CHIRON (Paredes et al. 2021). Radial velocities were obtained via a least-squares deconvolution of the observation against a synthetic nonrotating ATLAS9 model atmosphere spectrum (Castelli & Hubrig 2004). The least-squares deconvolution kernel was modeled via a broadening kernel in order to include the effects of radial velocity shift and rotational, instrumental, and macroturbulent broadening (Zhou et al. 2021). The average RV precision obtained for TOI-2420 is 21 m s−1, and it is 19 m s−1 for TOI-2485.
We computed the GLS periodograms for both targets (Fig. 2). They exhibit a highly significant periodicity at 5.8 days and 11.2 days for TOI-2420 and TOI-2485, respectively, which corresponds to the planetary signals. The resulting FAP estimated via bootstrap is lower than 10−6.
2.3.2 Minerva-Australis
TOI-2420 was observed between 2021 June 5 and 2021 October 4 using the MINERVA-Australie telescope array (Addison et al. 2019), located at Mt. Kent Observatory, Australia. Minerva-Australis is an array of four identical 0.7 m telescopes that are linked via fiber feeds to a single KiwiSpec echelle spectrograph at a spectral resolving power of R ~80 000 over the wavelength region of 5000–6300 Å. The array is entirely dedicated to RV follow-up of TESS planet candidates (e.g., Nielsen et al. 2019; Addison et al. 2021; Wittenmyer et al. 2022; Rodriguez et al. 2023; Clark et al. 2023). Two simultaneous fibres provide wavelength calibration and correct for instrumental variations. The calibration fibres are illuminated by a quartz lamp through an iodine cell, which eliminates contamination by saturated Argon lines. The RVs for the observations are derived for each telescope from a least-squares deconvolution against a synthetic nonrotating template, similar to the CHIRON pipeline. Each epoch consists of 30–60 min exposures from up to four individual telescopes. Fibres 3, 4, 5, and 6 obtained 45, 16, 6, and 37 epochs, respectively. The radial velocities from each telescope were treated as coming from separate instruments to account for small velocity offsets between the fibres.
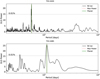 |
Fig. 2 Periodograms of the RVs data for TOI-2420 (upper panel) and TOI-2485 (lower panel). The dotted horizontal line represents the 0.01% false-alarm level, and the vertical green line is the maximum power, which corresponds to the planetary period. |
2.3.3 Tull Coudé spectrometer
We observed TOI-2420 with the Tull Coudé Spectrometer (TS23) (Tull et al. 1995) of the McDonald Observatory 2.7 m Harlan J. Smith Telescope. TS23 is a cross-dispersed echelle white-pupil spectrograph with a Tektoronix 2048 × 2048 CCD detector. A 1.2 arcsec wide slit gave a spectral resolving power of R = λ/δλ = 60 000. We focused the stellar image onto the slit with a wave-front sensor. This instrumental configuration gives complete spectral coverage from 3400 Å to 5800 Å, and then increasingly large inter-order gaps exist out to 10 800 Å. We inserted an I2 gas absorption cell in front of the spectrograph entrance slit in order to impose a stable set of fixed absorption lines on the stellar spectrum before it entered the spectrograph. This enabled us to measure precise radial velocity variations of the target star with respect to the I2 lines (cf. Butler et al. 1996). At the start of each night, the spectrograph was automatically repositioned to within 0.2 pixels of a standard reference position. We obtained 21 separate visits to TOI-2420 between 2021 July 18 and 2022 December 13. We used an exposure meter to terminate each exposure level at a preset signal-to-noise ratio level. The exposure meter data were then used to compute an accurate flux-weighted barycentric velocity correction for each spectrum. All of the CCD frames were reduced, and the echelle spectra were extracted using a script of standard IRAF procedures. We then computed the radial velocities from the extracted spectra using the AUSTRAL code (Endl et al. 2000).
2.3.4 Fiber-fed Extended Range Optical Spectrograph
TOI-2485 was monitored with the Fiber-fed Extended Range Optical Spectrograph (Kaufer et al. 1999, FEROS) mounted to the MPG2.2 m telescope at the ESO La Silla Observatory, in Chile. FEROS has a spectral resolution of R = 48 000 and uses a second fibre to trace instrument-induced spectral displacements. The observations of TOI-2485 were obtained in the context of the Warm gIaNts with tEss (WINE) collaboration, which focuses on the systematic discovery of transiting WJs (Brahm et al. 2019, 2020, 2023; Jordán et al. 2020; Schlecker et al. 2020; Hobson et al. 2021; Trifonov et al. 2021, 2023; Bozhilov et al. 2023; Hobson et al. 2023; Eberhardt et al. 2023; Jones et al. 2024). We obtained 15 FEROS spectra between February 2021 and July 2023 using an exposure time of 1200 s and obtained spectra with signal-to-noise ratios between 70 and 110 per resolution element depending on the weather and observing conditions. FEROS data were proccessed with the ceres pipeline, which generates the 2D spectrum as final outputs, and the determination of precise radial velocities and bisector span measurements using the cross-correlation technique. The mean error of these radial velocity measurements was 9 m/s. ceres also performs a rough estimation of the stellar parameters, and for the case of TOI-2485, we obtained Teff=5900 ± 100 K, log g*=4.2 ± 0.2 dex [Fe/H] = 0 ± 0.1, and V sin i = 5 ± 1 km s−1.
2.3.5 Tillinghast Reflector Echelle Spectrograph
TOI-2485 was observed 11 times from UT 2021 February 17 to February 27 using the Tillinghast Reflector Echelle Spectrograph (TRES; Fűrész et al. 2008)7 on the 1.5 m Tillinghast Reflector at the Fred L. Whipple Observatory (FLWO) on Mt. Hopkins, AZ. TRES has a resolution of R = 44 000 and covers a spectral wavelength range of 3850–9096 Å. The reduction process for TRES was described in detail in Buchhave et al. (2010), and the RV extraction process using a median combined template was presented in Quinn et al. (2012). To better understand the host star parameters, the spectra were analyzed using the Stellar Parameter Classification (SPC) package (Buchhave et al. 2012), which provided a comparison constraint on the [Fe/H], Teff, and rotational velocity of TOI-2485 of 0.005±0.008 dex, 5982±50 K, and 6.01±0.0 km s−1.
2.4 High-resolution imaging
As part of our standard process for validating transiting exoplanets to assess the possible contamination of bound or unbound companions on the derived planetary radii (Ciardi et al. 2015), we observed TOI 2420 and TOI 2485 with optical speckle observations at SOAR and WIYN and near-infrared adaptive optics (AO) imaging at the Palomar and Lick Observatories.
2.4.1 Optical speckle imaging
We searched for stellar companions to TOI-2420 and TOI-2485 with speckle imaging on the 4.1m Southern Astrophysical Research (SOAR) telescope (Tokovinin 2018) on UT 2020 December 3 and 2021 February 27, respectively, observing in Cousins I-band, which is a similar visible bandpass as TESS. These observations were both sensitive to a 5.0-magnitude fainter star at an angular distance of one arcsec from the target. More details of the observations within the SOAR TESS survey are available in Ziegler et al. (2020). No nearby stars were detected within 3″ of either TOI-2420 or TOI-2485 in the SOAR observations.
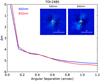 |
Fig. 3 NESSI speckle imaging results from observations of TOI-2485 on 2021 April 1. Sensitivity curves and reconstructed images are shown for each filter (central wavelengths 562 and 832 nm). No nearby companions have been detected. |
2.4.2 NN-EXPLORE Exoplanet Stellar Speckle Imager
We observed TOI-2485 on UT 2021 April 1 and UT 2022 April 18 using the NN-EXPLORE Exoplanet Stellar Speckle Imager (NESSI; Scott et al. 2018), a speckle imager employed at the WIYN 3.5 m telescope on Kitt Peak. NESSI was used to obtain simultaneous speckle imaging in two filters with central wavelengths λc = 562 and 832 nm for the 2021 observation, but only the 832 nm was available for the 2022 observation. Each observation consisted of a set of nine 1000-frame 40 ms exposures. The NESSI field of view was limited to a 256 × 256 pixel subarray readout, resulting in a field of 4.6 × 4.6 arcsec. However, our speckle measurements were further confined to an outer radius of 1.2 arcseconds from the target star. Speckle imaging of a point source standard star was taken in conjunction to each observation of the TOI. The standard observation consisted of a single 1000-frame image set and was used to calibrate the intrinsic PSF. These speckle data were reduced using the pipeline process described in Howell et al. (2011). The pipeline products include reconstructed images of the field around TOI-2485 in each filter. We used these to measure contrast curves, setting detection limits on point sources close to the TOI. No companion sources were detected for TOI-2485 (Fig. 3).
2.4.3 Near-infrared adaptive optics imaging
Observations of TOI-2485 were made on UT 2023 June 7 with the PHARO instrument (Hayward et al. 2001) on the Palomar Hale (5 m) behind the P3K natural guide star AO system (Dekany et al. 2013) in the narrowband Br-Γ filter (λ0 = 2.1686; Δλ = 0.0326 μm). The PHARO pixel scale is 0.025″ per pixel. A standard five-point quincunx dither pattern with steps of 5″ was repeated twice, and each repeat was separated by 0.5″. The reduced science frames were combined into a single mosaiced image with a final resolution of 0.21″. The sensitivity of the final combined AO image was determined by injecting simulated sources azimuthally around the primary target every 20° at separations of integer multiples of the central source FWHM (Furlan et al. 2017). The brightness of each injected source was scaled until standard aperture photometry detected it with 5σ significance. The final 5σ limit at each separation was determined from the average of all the determined limits at that separation, and the uncertainty on the limit was set by the rms dispersion of the azimuthal slices at a given radial distance. The Palomar sensitivities are shown in Fig. 4.
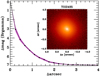 |
Fig. 4 NIR AO imaging and sensitivity curves for the Paloamr Observations of TOI-2485. Inset: image of the central portion of the image. No nearby companions have been detected. |
2.4.4 Shane Ao infraRed Camera-Spectrograph
TOI-2485 was observed on UT 2021 March 04 using the Shane Ao infraRed Camera-Spectrograph (ShARCS) camera on the Shane 3-m telescope at the Lick Observatory (Kupke et al. 2012; Gavel et al. 2014; McGurk et al. 2014). Observations were taken with the Shane adaptive optics system in natural guide-star mode in order to search for nearby unresolved stellar companions. Sequences of observations were collected using a Ks filter (λ0 = 2.150 μm, Δλ = 0.320 μm) and a J filter (λ0 = 1.238 μm, Δλ = 0.271 μm). The data were reduced using the publicly available SImMER pipeline (Savel et al. 2020, 2022)8. No stellar companions were found within the detection limits. We refer to Dressing et al. (in prep.) for more information about these observations.
3 Stellar modeling
3.1 Spectroscopic modeling of the host stars
We modeled the spectra of the two exoplanet host stars using our coadded CHIRON spectra with Spectroscopy Made Easy9 (SME; Valenti & Piskunov 1996; Piskunov & Valenti 2017) version 5.2.2. This software fits spectral observations to synthetic spectra computed with atomic and molecular line data from VALD10 (Ryabchikova et al. 2015) and different stellar atmosphere grids for a chosen set of parameters. We used the Atlas12 (Kurucz 2013) atmospheric model for both host stars. A more detailed description of the SME modeling can be found in (Persson et al. 2018). In summary, we fit spectral lines sensitive to different parameters: the line wings of Hα at 6563Å to model Teff, and the line wings of the Ca I lines at 6102 Å, 6122 Å, and 6162 Å for log g*. The abundances of iron, calcium, and sodium, and the projected rotational velocity (V sin i*) were fit to narrow and unblended spectral lines between 5900 Å and 6600 Å. As a final check of the model, we fit the Na doublet at 5888 Å and 5895 Å, which is sensitive to both gravity and effective temperature. We fixed the microturbulent velocity Vmic to 1 km s−1 (Bruntt et al. 2008) for both host stars, and the macroturbulent velocity, Vmac to 4.1 km s−1 for TOI-2420 and 4.4 km s−1 for TOI-2485 (Doyle et al. 2014).
All SME results for the two host stars are listed in Table 2 and were adopted as the final spectroscopic parameters.
The surface gravities combined with the effective temperatures suggests a G7 IV and G0 IV spectral type for TOI-2420 and TOI-2485, respectively (Pecaut & Mamajek 2013).
3.2 Modeling stellar masses and radii
The derived spectroscopic parameters from SME were used as priors in a spectral energy distribution (SED) fit (Fig. 5) with the publicly available Python package ARIADNE11 (Vines & Jenkins 2022). This software fits the observed broadbad photometry to the SED from grids of four stellar models, constrained by the Gaia DR3 parallax and the dust maps of Schlegel et al. (1998), to obtain an upper limit on AV. We included the Johnson V and B from APASS, GGbpGrp from Gaia DR3, JHKs from 2MASS, and the WISE W1 and W2 photometry. The atmospheric model grids that were used in the fit were Phoenix v2 (Husser et al. 2013), BtSettl (Allard et al. 2012), Castelli & Kurucz (2004), and Kurucz (1993). The final stellar parameters were computed with Bayesian model averaging from the averaged posterior distributions of all four stellar models weighted by the respective Bayesian evidence estimate. To account for an underestimation of the uncertainties, an excess noise term was added in ARIADNE to each set of parameters.
The stellar mass was computed in two ways in ARIADNE. The first method determined a gravitational mass from a combination of the posterior log g*, and the computed R*. The second technique used by ARIADNE is an interpolation from the MIST (Choi et al. 2016) isochrones. We note that the posteriors of Teff, log g*, and [Fe/H] in the ARIADNE model agree well with the results from SME for both targets (listed in Table 2).
The resulting stellar masses and radii were checked with the online applet PARAM1.312 (da Silva et al. 2006) based on a Bayesian computation and the PARSEC isochrones. Input was the Gaia DR3 parallax, Teff, [Fe/H], and the V magnitude. The results agree well within 1 σ with the ARIADNE models for both host stars.
All results are listed in Table 3, including the luminosity and stellar age derived with ARIADNE and PARAM1.3. To model the planets in Sec. 4, we used the ARIADNE results.
4 Planetary system modeling: Joint fit
We performed a joint RV and transit modeling for TOI-2420b and TOI-2485 b. We used the code pyaneti XXX (Barragán et al. 2019; Barragán et al. 2022) to model all of our data.
For the transit analyses, we used the quadratic limb-darkening framework by Mandel & Agol (2002). We used the q1 and q2 parameterization given by Kipping (2013) to account for realistic limb-darkening parameter values. We note that the FFI data were taken with long cadence of 30 and 10 min in different TESS sectors. For these cases, we resampled the model to account for the data integration (Kipping 2010), using one integration step for every minute of integration of the data. For each planet, we sampled for the time of transit, T0, the orbital period, Porb, the polar parameterization of the orbital eccentricity, the e and angle of periastron, ω given as ![$\[\sqrt{e} \cos \omega\]$](/articles/aa/full_html/2024/10/aa51313-24/aa51313-24-eq7.png) and
and ![$\[\sqrt{e} \sin \omega\]$](/articles/aa/full_html/2024/10/aa51313-24/aa51313-24-eq8.png) (see Anderson et al. 2011), the scaled planetary radius Rp/R*, and stellar density ρ* (which is connected with the scaled semimajor axis a/R* via Kepler’s third law). We also sampled for a photometric jitter term per band to penalize the imperfections of our transit model.
(see Anderson et al. 2011), the scaled planetary radius Rp/R*, and stellar density ρ* (which is connected with the scaled semimajor axis a/R* via Kepler’s third law). We also sampled for a photometric jitter term per band to penalize the imperfections of our transit model.
For the RV data, we used one Keplerian signal for each system. This Keplerian signal was modeled with a time of minimum conjunction (or time of transit for transiting planets), T0, the orbital period, Porb, the orbital eccentricity, ![$\[\sqrt{e} \cos \omega\]$](/articles/aa/full_html/2024/10/aa51313-24/aa51313-24-eq9.png) and
and ![$\[\sqrt{e} \sin \omega\]$](/articles/aa/full_html/2024/10/aa51313-24/aa51313-24-eq10.png) , and the Doppler semi-amplitude, K. We also included one offset to account for the systemic offset and a jitter term for every instrument in the corresponding dataset. For TOI-2485, we also included a slope to model the trend that is visible in the FEROS time series.
, and the Doppler semi-amplitude, K. We also included one offset to account for the systemic offset and a jitter term for every instrument in the corresponding dataset. For TOI-2485, we also included a slope to model the trend that is visible in the FEROS time series.
Tables A.1 and A.2 show the sampled parameters and priors used to model TOI-2420 b and TOI-2485 b, respectively. In all our runs, we sampled the parameter space with 250 walkers using a Markov chain Monte Carlo (MCMC) ensemble sampler algorithm (as implemented in pyaneti Barragán et al. 2019; Foreman-Mackey et al. 2013). We created the posterior distributions using the last 5000 iterations of converged chains, thinned with a thin factor of 10. This gives a distribution of 125 000 points for each sampled parameter.
We ran different model combinations to model TOI-2420 b and TOI-2485 b, including circular and eccentric orbits and linear and quadratic trends. We used the difference of the Akaike information criterion (Δ AIC) to determine the best model. We decided to use the AIC because it is more appropriate than the Bayesian information criterion (BIC) to determine the best model when the true model is unknown (see discussion in Barragán et al. 2023). Table 4 summarizes the results. We can conclude that the best model for TOI-2420 is an eccentric orbit with no trends on the RVs. For TOI-2485, the best model has a quadratic trend and an eccentric orbit. We also tested a two-planet model, but the fit did not converge to any significant results.
The inferred and derived parameters of TOI-2420 b and TOI-2485 b are shown in Tables A.1 and A.2. Figures 6 and 7 show the inferred transit and RV models for both planets, and Fig. 8 displays the RVs time series for TOI-2485, where a linear trend is evident. We note that the TESS 2 min data in Fig. 7 appear to be flat-bottomed. However, we underline that we accounted for the limb-darkening coefficients in the modeling, using uniform priors In this particular case, the best solution is consistent with a flat-bottom transit, suggesting that we cannot constrain the limb darkening of the star on the TESS band with this transit dataset. However, we note that this does not affect the inferred transit depth.
Stellar properties of TOI-2420 and TOI-2485.
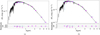 |
Fig. 5 SED for TOI-2420 (left) and TOI-2485 (right) and the best-fit models from (Phoenix v2, Husser et al. 2013). The magenta and blue diamonds show the synthetic and the observed photometry, respectively. The 1σ uncertainties of the magnitudes are marked with vertical bars, and the horizontal bars show the effective width of the respective passband. The lower panels show the residuals normalized to the photometry errors. |
Spectroscopic parameters for TOI-2420 and TOI-2485 modeled with SME.
Stellar parameters of TOI-2420 and TOI-2485 modeled with ARIADNE and PARAM 1.3.
Model comparison for different models of TOI-2420 and TOI-2485.
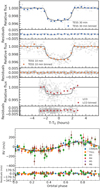 |
Fig. 6 Resulting fit from the TOI-2420 b joint model. Top panel: phase-folded transit light curve TOI-2420 b. Nominal TESS and LCO observations are shown in light gray. The solid coloured circles represent the binned data. The transit models are shown with a solid black line. Bottom panel: phase-folded RV signal for TOI-2420 b following the subtraction of the systemic velocity. The blue circles and triangles show the CHIRON and TULL RV data, respectively, and green squares, red pentagons, purple hexagons, and brown circles show the MINERVA RVs, split into four different datasets. |
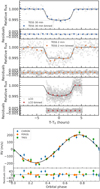 |
Fig. 7 Resulting fit from the TOI-2485 b joint model. Top panel: phase-folded transit light curve TOI-2485 b. Nominal TESS and LCO observations are shown in light gray. The solid coloured circles represent the binned data. The transit models are shown with a solid black line. Bottom panel: phase-folded RV signal for TOI-2485 b following the subtraction of the systemic velocities. The orange circles, diamonds, and squares show CHIRON, FEROS, and TRES RV data, respectively. |
5 Discussion
5.1 Inferred formation mechanism of TOI-2420 b and TOI-2485 b
Considering the orbital period of 10 days as the boundary between HJs and WJs, TOI-2420 b falls in the HJ category and TOI-2485 b in the WJ category. Both planets are common outcomes in core accretion models, including disk migration (e.g., Ida et al. 2013; Emsenhuber et al. 2021; Schlecker et al. 2021a,b). To place them in the context of the close-in giant planet population, we selected Jupiter-sized planets from the NASA Exoplanet Archive13 (mass between 0.20 and 12 MJ) with orbital periods shorter than 200 days, planetary masses with a precision better than 20% and eccentricities with a precision lower than 0.1. With these criteria, we found 158 Jupiter-sized planets in 5595 exoplanets (as of March 13), 131 of which are in single systems and 27 of which are in multiplanet systems. Fig. 9 presents the eccentricity distribution of these two populations as a function of the orbital period and shows that most HJs that orbit within 3 days have circular orbits, while for longer periods, there is a wide variety of low and high eccentricities. This distribution challenges the evolution theories: Disk migration cannot explain high eccentricities (i.e., Bitsch et al. 2013; Petrovich 2015b; Duffell & Chiang 2015), but high-eccentricity tidal migration (Wu & Murray 2003) can explain the intermediate-high eccentricities of WJs with small pericenter distances because tidal migration strongly depends on the distance from the star. Highly eccentric WJs might be the results of Kozai–Lidov oscillations or other secular oscillations caused by a third body (i.e., Dong et al. 2014; Petrovich & Tremaine 2016).
An important facet to consider in constraining the dynamical histories of these planets is the tidal dissipation. The orbits of both planets are nearly circular ([] for TOI-2420 b and [] for TOI-2485 b). The question is whether they could have migrated by high-eccentricity migration and undergone tidal damping of the eccentricity within the main-sequence lifetimes of the stars. If this is not the case, we can exclude this migration method.
For our purposes, we pursued a simple computation. We used the eccentricity tidal damping timescales presented in Eq. (1) of Dobbs-Dixon et al. (2004),
![$\[\tau_{e p} \simeq 5\left(\frac{Q_P^{\prime}}{10^6}\right)\left(\frac{M_P}{M_J}\right)\left(\frac{M_{\star}}{M_{\odot}}\right)^{2 / 3}\left(\frac{P}{1 \text { day }}\right)^{13 / 3}\left(\frac{R_P}{R_J}\right)^{-5} \mathrm{Myr}.\]$](/articles/aa/full_html/2024/10/aa51313-24/aa51313-24-eq16.png) (1)
(1)
The tidal quality factor ![$\[Q_P^{\prime}\]$](/articles/aa/full_html/2024/10/aa51313-24/aa51313-24-eq17.png) is significantly unknown, but with a nominal value of 105, eccentricity damping timescales of 250 Myr and 32 Gyr are predicted for TOI-2420 and TOI-2485, respectively. This suggests that the former planet could have quickly tidally damped out any eccentricity for a range of tidal quality factors, while TOI-2485 would have required a low-quality factor to damp out a high eccentricity within the age of the system.
is significantly unknown, but with a nominal value of 105, eccentricity damping timescales of 250 Myr and 32 Gyr are predicted for TOI-2420 and TOI-2485, respectively. This suggests that the former planet could have quickly tidally damped out any eccentricity for a range of tidal quality factors, while TOI-2485 would have required a low-quality factor to damp out a high eccentricity within the age of the system.
We can also consider whether any initial orbital obliquity, as predicted by some high-eccentricity migration models, could have been damped out. Albrecht et al. (2012) presented a formula (Eq. (2) of that work) for the obliquity tidal dissipation timescale of a convective-envelope star such as TOI-2420 or TOI-2485, based upon the theory of Zahn (1977) and calibrated using binary stars. This is
![$\[\frac{1}{\tau_{\mathrm{CE}}}=\frac{1}{10 \times 10^9 \mathrm{yr}} q^2\left(\frac{a / R_{\star}}{40}\right)^{-6},\]$](/articles/aa/full_html/2024/10/aa51313-24/aa51313-24-eq18.png) (2)
(2)
where τCE is the tidal damping timescale, and q is the planetary-to-stellar mass ratio.
With the current parameters for the two systems, the estimated obliquity damping timescales are >1011 years, which is well in excess of the main-sequence lifetimes in either system. Additionally, considering that both stars are slightly evolved and the current value of a/R* is lower than it was on the main sequence, these estimated tidal damping timescales may be underestimates. Further information on their history can be obtained from the observations of the Rossiter–McLaughlin (RM) effect, as the long tidal obliquity timescales suggest that any initial orbital obliqity should be retained. The expected semi-amplitude of the RM is ~5 m s−1 and ~15 m s−1 for TOI-2420 b and TOI-2485 b, respectively. Wang et al. (2024) presented the RM for TOI-2485 b, which showed that the system is well aligned. This implies a quiet formation history.
 |
Fig. 8 TOI-2485 RV time series. The trend in the data is clear and was modeled with a quadratic trend, whose significance is higher than in a linear trend model. |
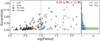 |
Fig. 9 Eccentricity distribution as a function of the orbital period for Jupiter-sized planets (data taken as of UT 2024 March 13). The dashed blue line represents the 10-day boundary between HJs and WJs. The orange point represents TOI-2420 b, and the cyan point represents TOI-2485 b. The red triangles represent the planets in multiplanet systems. |
5.2 Evidence for a long-period companion to TOI-2485
When we assume that the linear acceleration of TOI-2485 (−0.389 ± 0.009 m/s/days from the linear trend model) is caused by another orbiting body, we can place some constraints on the nature of that body and its orbit. Following equation (2) of Smith et al. (2017) (which is derived from equation (2) of Liu et al. 2002), we can place the following constraint on the mass and orbital separation of planet ‘c’:
![$\[\frac{M_{\mathrm{c}}}{a_{\mathrm{c}}^2}>2.06 ~M_{\mathrm{Jup}} ~\mathrm{au}^{-2}.\]$](/articles/aa/full_html/2024/10/aa51313-24/aa51313-24-eq19.png) (3)
(3)
Furthermore, assuming an approximately circular orbit for c implies an orbital period greater than twice our RV baseline, that is, Pc > 1800 days. This corresponds to ac > 3 au and leads to (from Eq. (3)) a lower mass limit of 18 MJup. For circular orbits, the third body would lie in the brown dwarf mass regime for 3 < a/au < 6.3. Alternative possibilities are a low-mass star orbiting farther out or a more massive object on a highly eccentric orbit. Using equation (4) of Jackson et al. (2021), we are able to assess whether this putative third body is capable of inducing high-eccentricity tidal migration. A perturber at 3 au whose orbit is aligned with that of TOI-2485 b, must have a mass greater than 7.3 MJup; in other words, a 3 au, 18 MJup object meets the minimum requirement for high-eccentricity tidal migration.
Radial velocity surveys of WJs aimed at detecting long-term trends would be highly valuable in determining whether perturber-coupled high-eccentricity migration is the dominant mechanism. TOI-2485 b, exhibiting a significant long-term trend, provides a promising connection to this hypothesis, as suggested by Jackson et al. (2021).
5.3 Planets orbiting evolved stars
Both TOI-2420 b and TOI-2485 b orbit slightly evolved stars. When a main-sequence star exhausts the hydrogen in its core, the core contracts, while the temperature rises enough to ignite hydrogen fusion in a shell surrounding the core (see, e.g., Lamers & Levesque 2017). Prior to becoming a red giant, the evolving star undergoes a transition phase called subgiant phase, during which the star lies between the main-sequence turn-off and the base of the red giant branch in the HR diagram (see, e.g., Pinsonneault & Ryden 2023). During the subgiant phase, the outer layers of the star expand while the effective temperature decreases, which profoundly affects the evolution and the fate of the surrounding planetary system. The strong tidal interaction between a close-in planet and its expanding host star is expected to play a crucial role in shaping the structure of the inner region of a planetary system (Villaver & Livio 2009; Veras 2016; Grunblatt et al. 2018; MacLeod et al. 2018).
Based on radial velocity follow-up observations of about 500 bright (V < 8.5) subgiant stars, the Lick, Keck, and California planet-search programs (Johnson et al. 2006; Sato et al. 2008; Peek et al. 2009; Luhn et al. 2019) found a paucity of hot Jupiters orbiting subgiant stars with respect to main-sequence stars. This result suggests that close-in planets might be engulfed by their evolving host star during the subgiant/giant phase (e.g., Bowler et al. 2010; Villaver et al. 2014). Grunblatt et al. (2019) carried out a search for transiting planets in a sample of nearly 2500 low-luminosity red giant branch stars observed by the NASA K2 mission and found that short-period (P < 10 days) planets larger than Jupiter seem to be more common around evolved stars than main-sequence stars. This would suggest that close-in planets larger than Jupiter can survive the subgiant phase, at least while their host stars have radii smaller than 5–6 R⊙.
Only a few transiting planets with measured masses and radii around subgiant stars have been discovered so far from both ground- (e.g., Lillo-Box et al. 2016; Pepper et al. 2017; Grieves et al. 2021; Kabáth et al. 2022; Smith et al. 2022) and space-based transit-search surveys (e.g., Borucki et al. 2010; Rowe et al. 2014; Ortiz et al. 2015; Morton et al. 2016; Wang et al. 2019). To increase our knowledge of the evolution of planetary systems during the post-main-sequence phase of their host stars, it is crucial to increase the sample of well-characterized planets orbiting evolved stars.
6 Conclusions
We presented the discovery of two Jupiter-sized planets. TOI-2420 b has been observed by TESS in Sectors 3 and 30 and was followed-up through LCO ground-based photometry and CHIRON, TULL, and MINERVA-Australis spectroscopy. We found TOI-2420 b to have an orbital period of 5.8 days, a mass of 0.9 MJ, and a radius of 1.3 RJ. TOI-2485 b has been observed by TESS during Sectors 23 and 50. We collected LCO photometry and CHIRON, FEROS, and TRES RVs data in order to constrain the orbital properties. TOI-2485 b has an orbital period of 11.2 days, a mass of 2.4 MJ, and a radius of 1.1 RJ.
The observed characteristics of the two planetary systems and the calculation of the tidal damping timescale indicates that the high-eccentricity migration (HEM) scenario cannot be ruled out for either system, especially due to the large uncertainties in the tidal quality factor. Moreover, regarding TOI-2485 b, the possible nonzero eccentricity and the evidence for a long-period companion may support some HEM scenarios, such as coplanar high-eccentricity migration (Petrovich 2015a).
Data Availibility
Radial velocity data is available at the CDS via anonymous ftp to cdsarc.cds.unistra.fr (130.79.128.5) or via https://cdsarc.cds.unistra.fr/viz-bin/cat/J/A+A/690/A18
Acknowledgements
C.M.P. and M.F. gratefully acknowledge the support of the Swedish National Space Agency (DNR 65/19 and 177/19). O.B. acknowledges that has received funding from the European Research Council (ERC) under the European Union’s Horizon 2020 research and innovation programme (Grant agreement No. 865624). G.N. thanks to the research funding from the Ministry of Education and Science programme the “Excellence Initiative – Research University” conducted at the Centre of Excellence in Astrophysics and Astrochemistry of the Nicolaus Copernicus University in Toruń, Poland. P.K. acknowledges funding from LTT-20015 project. D.G. gratefully acknowledges the financial support from the grant for internationalization (GAND_GFI_23_01) provided by the University of Turin (Italy). M.T.P. acknowledges support from the Fondecyt-ANID Post-doctoral fellowship 3210253 and from the ANID Project ASTRO21-0037. A.J. and R.B. acknowledge support from ANID – Millennium Science Initiative – ICN12_009. R.B. acknowledges support from FONDECYT Project 1241963. A.J. acknowledges support from FONDECYT project 1210718. This work makes use of observations from the LCOGT network. Part of the LCOGT telescope time was granted by NOIRLab through the Mid-Scale Innovations Program (MSIP). MSIP is funded by NSF. This research has made use of the Exoplanet Follow-up Observation Program (ExoFOP; DOI: 10.26134/Exo-FOP5) website, which is operated by the California Institute of Technology, under contract with the National Aeronautics and Space Administration under the Exoplanet Exploration Program. Funding for the TESS mission is provided by NASA’s Science Mission Directorate. KAC and CNW acknowledge support from the TESS mission via subaward s3449 from MIT. D.R.C. and C.A.C. acknowledge partial support from NASA Grant 18-2XRP18_2-0007. This research has made use of the Exoplanet Follow-up Observation Program (ExoFOP; DOI: 10.26134/ExoFOP5) website, which is operated by the California Institute of Technology, under contract with the National Aeronautics and Space Administration under the Exoplanet Exploration Program. MINERVA-Australis is supported by Australian Research Council LIEF Grant LE160100001, Discovery Grants DP180100972 and DP220100365, Mount Cuba Astronomical Foundation, and institutional partners University of Southern Queensland, UNSW Sydney, MIT, Nanjing University, George Mason University, University of Louisville, University of California Riverside, University of Florida, and The University of Texas at Austin. We respectfully acknowledge the traditional custodians of all lands throughout Australia, and recognise their continued cultural and spiritual connection to the land, waterways, cosmos, and community. We pay our deepest respects to all Elders, ancestors and descendants of the Giabal, Jarowair, and Kambuwal nations, upon whose lands the MINERVA-Australis facility at Mt Kent is situated. This research was carried out at the Jet Propulsion Laboratory, California Institute of Technology, under a contract with the National Aeronautics and Space Administration (80NM0018D0004). The results reported herein benefitted from collaborations and/or information exchange within NASA’s Nexus for Exoplanet System Science (NExSS) research coordination network sponsored by NASA’s Science Mission Directorate under Agreement No. 80NSSC21K0593 for the program “Alien Earths”. This work is partly supported by JSPS KAKENHI Grant Number JPJP24H00017 and JSPS Bilateral Program Number JPJSBP120249910.
Appendix A Additional tables
Model parameters and priors for TOI-2420 b’s joint fit
Model parameters and priors for TOI-2485 b’s joint fit
References
- Addison, B., Wright, D. J., Wittenmyer, R. A., et al. 2019, PASP, 131, 115003 [NASA ADS] [CrossRef] [Google Scholar]
- Addison, B. C., Wright, D. J., Nicholson, B. A., et al. 2021, MNRAS, 502, 3704 [NASA ADS] [CrossRef] [Google Scholar]
- Albrecht, S., Winn, J. N., Johnson, J. A., et al. 2012, ApJ, 757, 18 [NASA ADS] [CrossRef] [Google Scholar]
- Allard, F., Homeier, D., & Freytag, B. 2012, Philos. Trans. Roy. Soc. Lond. Ser. A, 370, 2765 [NASA ADS] [Google Scholar]
- Anderson, D. R., Collier Cameron, A., Hellier, C., et al. 2011, ApJ, 726, L19 [NASA ADS] [CrossRef] [Google Scholar]
- Barragán, O., Gandolfi, D., & Antoniciello, G. 2019, MNRAS, 482, 1017 [Google Scholar]
- Barragán, O., Aigrain, S., Rajpaul, V. M., & Zicher, N. 2022, MNRAS, 509, 866 [Google Scholar]
- Barragán, O., Gillen, E., Aigrain, S., et al. 2023, MNRAS, 522, 3458 [CrossRef] [Google Scholar]
- Bitsch, B., Crida, A., Libert, A. S., & Lega, E. 2013, A&A, 555, A124 [NASA ADS] [CrossRef] [EDP Sciences] [Google Scholar]
- Borucki, W. J., Koch, D. G., Brown, T. M., et al. 2010, ApJ, 713, L126 [NASA ADS] [CrossRef] [Google Scholar]
- Boss, A. P. 1997, Science, 276, 1836 [Google Scholar]
- Bowler, B. P., Johnson, J. A., Marcy, G. W., et al. 2010, ApJ, 709, 396 [Google Scholar]
- Bozhilov, V., Antonova, D., Hobson, M. J., et al. 2023, ApJ, 946, L36 [NASA ADS] [CrossRef] [Google Scholar]
- Brahm, R., Espinoza, N., Jordán, A., et al. 2019, AJ, 158, 45 [Google Scholar]
- Brahm, R., Nielsen, L. D., Wittenmyer, R. A., et al. 2020, AJ, 160, 235 [Google Scholar]
- Brahm, R., Ulmer-Moll, S., Hobson, M. J., et al. 2023, AJ, 165, 227 [NASA ADS] [CrossRef] [Google Scholar]
- Brown, T. M., Baliber, N., Bianco, F. B., et al. 2013, PASP, 125, 1031 [Google Scholar]
- Bruntt, H., De Cat, P., & Aerts, C. 2008, A&A, 478, 487 [NASA ADS] [CrossRef] [EDP Sciences] [Google Scholar]
- Buchhave, L. A., Bakos, G. Á., Hartman, J. D., et al. 2010, ApJ, 720, 1118 [NASA ADS] [CrossRef] [Google Scholar]
- Buchhave, L. A., Latham, D. W., Johansen, A., et al. 2012, Nature, 486, 375 [NASA ADS] [Google Scholar]
- Butler, R. P., Marcy, G. W., Williams, E., et al. 1996, PASP, 108, 500 [Google Scholar]
- Cabrera, J., Csizmadia, S., Erikson, A., Rauer, H., & Kirste, S. 2012, A&A, 548, A44 [NASA ADS] [CrossRef] [EDP Sciences] [Google Scholar]
- Caldwell, D. A., Tenenbaum, P., Twicken, J. D., et al. 2020, RNAAS, 4, 201 [NASA ADS] [Google Scholar]
- Castelli, F., & Hubrig, S. 2004, VizieR Online Data Catalog: Spectroscopic atlas of HD175640 (Castelli+, 2004), VizieR On-line Data Catalog: J/A+A/425/263. Originally published in: 2004A&A...425..263C [Google Scholar]
- Castelli, F., & Kurucz, R. L. 2004, arXiv e-prints [arXiv:astro-ph/0405087] [Google Scholar]
- Choi, J., Dotter, A., Conroy, C., et al. 2016, ApJ, 823, 102 [Google Scholar]
- Ciardi, D. R., Beichman, C. A., Horch, E. P., & Howell, S. B. 2015, ApJ, 805, 16 [NASA ADS] [CrossRef] [Google Scholar]
- Clark, J. T., Addison, B. C., Okumura, J., et al. 2023, AJ, 165, 207 [NASA ADS] [CrossRef] [Google Scholar]
- Collins, K. 2019, in American Astronomical Society Meeting Abstracts, 233, 140.05 [NASA ADS] [Google Scholar]
- Collins, K. A., Kielkopf, J. F., Stassun, K. G., & Hessman, F. V. 2017, AJ, 153, 77 [Google Scholar]
- Correia, A. C. M., Bourrier, V., & Delisle, J. B. 2020, A&A, 635, A37 [NASA ADS] [CrossRef] [EDP Sciences] [Google Scholar]
- Cutri, R. M., Skrutskie, M. F., van Dyk, S., et al. 2003, 2MASS All Sky Catalog of point sources. [Google Scholar]
- da Silva, L., Girardi, L., Pasquini, L., et al. 2006, A&A, 458, 609 [NASA ADS] [CrossRef] [EDP Sciences] [Google Scholar]
- Dawson, R. I., & Johnson, J. A. 2018, ARA&A, 56, 175 [Google Scholar]
- de Leon, J. P., Livingston, J., Endl, M., et al. 2021, MNRAS, 508, 195 [NASA ADS] [CrossRef] [Google Scholar]
- Dekany, R., Roberts, J., Burruss, R., et al. 2013, ApJ, 776, 130 [CrossRef] [Google Scholar]
- Dobbs-Dixon, I., Lin, D. N. C., & Mardling, R. A. 2004, ApJ, 610, 464 [NASA ADS] [CrossRef] [Google Scholar]
- Dong, S., Katz, B., & Socrates, A. 2014, ApJ, 781, L5 [Google Scholar]
- Doyle, A. P., Davies, G. R., Smalley, B., Chaplin, W. J., & Elsworth, Y. 2014, MNRAS, 444, 3592 [Google Scholar]
- Duffell, P. C., & Chiang, E. 2015, ApJ, 812, 94 [NASA ADS] [CrossRef] [Google Scholar]
- Eberhardt, J., Hobson, M. J., Henning, T., et al. 2023, AJ, 166, 271 [NASA ADS] [CrossRef] [Google Scholar]
- Emsenhuber, A., Mordasini, C., Burn, R., et al. 2021, A&A, 656, A70 [NASA ADS] [CrossRef] [EDP Sciences] [Google Scholar]
- Endl, M., Kürster, M., & Els, S. 2000, A&A, 362, 585 [Google Scholar]
- Fűrész, G., Szentgyorgyi, A. H., & Meibom, S. 2008, in Precision Spectroscopy in Astrophysics, eds. N. C. Santos, L. Pasquini, A. C. M. Correia, & M. Romaniello, 287 [Google Scholar]
- Foreman-Mackey, D., Hogg, D. W., Lang, D., & Goodman, J. 2013, PASP, 125, 306 [Google Scholar]
- Furlan, E., Ciardi, D. R., Everett, M. E., et al. 2017, AJ, 153, 71 [NASA ADS] [CrossRef] [Google Scholar]
- Gaia Collaboration (Vallenari, A., et al.) 2023, A&A, 674, A1 [NASA ADS] [CrossRef] [EDP Sciences] [Google Scholar]
- Gavel, D., Kupke, R., Dillon, D., et al. 2014, SPIE Conf. Ser., 9148, 914805 [NASA ADS] [Google Scholar]
- Gregory, P. C. 2005, ApJ, 631, 1198 [NASA ADS] [CrossRef] [Google Scholar]
- Grieves, N., Nielsen, L. D., Vines, J. I., et al. 2021, A&A, 647, A180 [NASA ADS] [CrossRef] [EDP Sciences] [Google Scholar]
- Grunblatt, S. K., Huber, D., Gaidos, E., et al. 2018, ApJ, 861, L5 [Google Scholar]
- Grunblatt, S. K., Huber, D., Gaidos, E., et al. 2019, AJ, 158, 227 [Google Scholar]
- Guillot, T., Burrows, A., Hubbard, W. B., Lunine, J. I., & Saumon, D. 1996, ApJ, 459, L35 [Google Scholar]
- Hatzes, A. P. 2016, Space Sci. Rev., 205, 267 [Google Scholar]
- Hayward, T. L., Brandl, B., Pirger, B., et al. 2001, PASP, 113, 105 [NASA ADS] [CrossRef] [Google Scholar]
- Henden, A. A., Templeton, M., Terrell, D., et al. 2016, VizieR Online Data Catalog: II/336. [NASA ADS] [Google Scholar]
- Hobson, M. J., Brahm, R., Jordán, A., et al. 2021, AJ, 161, 235 [NASA ADS] [CrossRef] [Google Scholar]
- Hobson, M. J., Trifonov, T., Henning, T., et al. 2023, AJ, 166, 201 [NASA ADS] [CrossRef] [Google Scholar]
- Horner, J., Kane, S. R., Marshall, J. P., et al. 2020, PASP, 132, 102001 [NASA ADS] [CrossRef] [Google Scholar]
- Howell, S. B., Everett, M. E., Sherry, W., Horch, E., & Ciardi, D. R. 2011, AJ, 142, 19 [Google Scholar]
- Huang, C., Wu, Y., & Triaud, A. H. M. J. 2016, ApJ, 825, 98 [NASA ADS] [CrossRef] [Google Scholar]
- Huang, C. X., Vanderburg, A., Pál, A., et al. 2020, RNAAS, 4, 206 [NASA ADS] [Google Scholar]
- Husser, T. O., Wende-von Berg, S., Dreizler, S., et al. 2013, A&A, 553, A6 [NASA ADS] [CrossRef] [EDP Sciences] [Google Scholar]
- Ida, S., Lin, D. N., & Nagasawa, M. 2013, ApJ, 775 [Google Scholar]
- Jackson, J. M., Dawson, R. I., Shannon, A., & Petrovich, C. 2021, AJ, 161, 200 [NASA ADS] [CrossRef] [Google Scholar]
- Jenkins, J. M., Caldwell, D. A., Chandrasekaran, H., et al. 2010, ApJ, 713, L87 [Google Scholar]
- Jensen, E. 2013, Tapir: A web interface for transit/eclipse observability, Astrophysics Source Code Library [record ascl:1306.007] [Google Scholar]
- Johnson, J. A., Marcy, G. W., Fischer, D. A., et al. 2006, ApJ, 652, 1724 [Google Scholar]
- Jones, M. I., Reinarz, Y., Brahm, R., et al. 2024, A&A, 683, A192 [NASA ADS] [CrossRef] [EDP Sciences] [Google Scholar]
- Jordán, A., Brahm, R., Espinoza, N., et al. 2020, AJ, 159, 145 [Google Scholar]
- Kabáth, P., Chaturvedi, P., MacQueen, P. J., et al. 2022, MNRAS, 513, 5955 [CrossRef] [Google Scholar]
- Kaufer, A., Stahl, O., Tubbesing, S., et al. 1999, The Messenger, 95, 8 [Google Scholar]
- Kipping, D. M. 2010, MNRAS, 408, 1758 [Google Scholar]
- Kipping, D. M. 2013, MNRAS, 435, 2152 [Google Scholar]
- Korth, J., Gandolfi, D., Šubjak, J., et al. 2023, A&A, 675, A115 [NASA ADS] [CrossRef] [EDP Sciences] [Google Scholar]
- Kunimoto, M., Huang, C., Tey, E., et al. 2021, RNAAS, 5, 234 [NASA ADS] [Google Scholar]
- Kupke, R., Gavel, D., Roskosi, C., et al. 2012, SPIE Confe. Ser., 8447, 84473G [NASA ADS] [Google Scholar]
- Kurucz, R. L. 1993, VizieR Online Data Catalog, VI/39 [NASA ADS] [Google Scholar]
- Kurucz, R. L. 2013, ATLAS12: Opacity sampling model atmosphere program, Astrophysics Source Code Library [record ascl:1303.024] [Google Scholar]
- Lamers, H. J. G. L. M., & Levesque, E. M. 2017, Understanding Stellar Evolution [Google Scholar]
- Lillo-Box, J., Demangeon, O., Santerne, A., et al. 2016, A&A, 594, A50 [NASA ADS] [CrossRef] [EDP Sciences] [Google Scholar]
- Lin, D. N. C., & Papaloizou, J. 1986, ApJ, 309, 846 [Google Scholar]
- Lissauer, J. J. 1993, ARA&A, 31, 129 [NASA ADS] [CrossRef] [Google Scholar]
- Liu, M. C., Fischer, D. A., Graham, J. R., et al. 2002, ApJ, 571, 519 [Google Scholar]
- Luhn, J. K., Bastien, F. A., Wright, J. T., et al. 2019, AJ, 157, 149 [NASA ADS] [CrossRef] [Google Scholar]
- MacLeod, M., Cantiello, M., & Soares-Furtado, M. 2018, ApJ, 853, L1 [NASA ADS] [CrossRef] [Google Scholar]
- Mandel, K., & Agol, E. 2002, ApJ, 580, L171 [Google Scholar]
- Mayor, M., & Queloz, D. 1995, Nature, 378, 355 [Google Scholar]
- McCully, C., Volgenau, N. H., Harbeck, D.-R., et al. 2018, SPIE Conf. Ser., 10707, 107070K [Google Scholar]
- McGurk, R., Rockosi, C., Gavel, D., et al. 2014, SPIE Conf. Ser., 9148, 91483A [NASA ADS] [Google Scholar]
- Morton, T. D., Bryson, S. T., Coughlin, J. L., et al. 2016, ApJ, 822, 86 [Google Scholar]
- Murdoch, K. A., Hearnshaw, J. B., & Clark, M. 1993, ApJ, 413, 349 [CrossRef] [Google Scholar]
- Nielsen, L. D., Bouchy, F., Turner, O., et al. 2019, A&A, 623, A100 [NASA ADS] [CrossRef] [EDP Sciences] [Google Scholar]
- Ortiz, M., Gandolfi, D., Reffert, S., et al. 2015, A&A, 573, A6 [Google Scholar]
- Paredes, L. A., Henry, T. J., Quinn, S. N., et al. 2021, AJ, 162, 176 [NASA ADS] [CrossRef] [Google Scholar]
- Pecaut, M. J., & Mamajek, E. E. 2013, ApJS, 208, 9 [Google Scholar]
- Peek, K. M. G., Johnson, J. A., Fischer, D. A., et al. 2009, PASP, 121, 613 [NASA ADS] [CrossRef] [Google Scholar]
- Pepper, J., Rodriguez, J. E., Collins, K. A., et al. 2017, AJ, 153, 215 [NASA ADS] [CrossRef] [Google Scholar]
- Persson, C. M., Fridlund, M., Barragán, O., et al. 2018, A&A, 618, A33 [NASA ADS] [CrossRef] [EDP Sciences] [Google Scholar]
- Petrovich, C. 2015a, ApJ, 805, 75 [NASA ADS] [CrossRef] [Google Scholar]
- Petrovich, C. 2015b, ApJ, 808, 120 [NASA ADS] [CrossRef] [Google Scholar]
- Petrovich, C., & Tremaine, S. 2016, ApJ, 829, 132 [NASA ADS] [CrossRef] [Google Scholar]
- Pinsonneault, M. H., & Ryden, B. S. 2023, Stellar structure and evolution [CrossRef] [Google Scholar]
- Piskunov, N., & Valenti, J. A. 2017, A&A, 597, A16 [NASA ADS] [CrossRef] [EDP Sciences] [Google Scholar]
- Pollacco, D. L., Skillen, I., Collier Cameron, A., et al. 2006, PASP, 118, 1407 [NASA ADS] [CrossRef] [Google Scholar]
- Quinn, S. N., Bakos, G. Á., Hartman, J., et al. 2012, ApJ, 745, 80 [NASA ADS] [CrossRef] [Google Scholar]
- Ricker, G. R., Winn, J. N., Vanderspek, R., et al. 2014, SPIE Conf. Ser., 9143, 914320 [Google Scholar]
- Rodriguez, J. E., Quinn, S. N., Vanderburg, A., et al. 2023, MNRAS, 521, 2765 [NASA ADS] [CrossRef] [Google Scholar]
- Rowe, J. F., Bryson, S. T., Marcy, G. W., et al. 2014, ApJ, 784, 45 [Google Scholar]
- Ryabchikova, T., Piskunov, N., Kurucz, R. L., et al. 2015, Phys. Scr, 90, 054005 [Google Scholar]
- Sato, B., Toyota, E., Omiya, M., et al. 2008, PASJ, 60, 1317 [NASA ADS] [Google Scholar]
- Savel, A. B., Dressing, C. D., Hirsch, L. A., et al. 2020, AJ, 160, 287 [NASA ADS] [CrossRef] [Google Scholar]
- Savel, A. B., Hirsch, L. A., Gill, H., Dressing, C. D., & Ciardi, D. R. 2022, PASP, 134, 124501 [Google Scholar]
- Schilling, G. 1996, Science, 273, 429 [NASA ADS] [CrossRef] [Google Scholar]
- Schlecker, M., Kossakowski, D., Brahm, R., et al. 2020, AJ, 160, 275 [Google Scholar]
- Schlecker, M., Mordasini, C., Emsenhuber, A., et al. 2021a, A&A, 656, A71 [NASA ADS] [CrossRef] [EDP Sciences] [Google Scholar]
- Schlecker, M., Pham, D., Burn, R., et al. 2021b, A&A, 656, A73 [NASA ADS] [CrossRef] [EDP Sciences] [Google Scholar]
- Schlegel, D. J., Finkbeiner, D. P., & Davis, M. 1998, ApJ, 500, 525 [Google Scholar]
- Scott, N. J., Howell, S. B., Horch, E. P., & Everett, M. E. 2018, PASP, 130, 054502 [Google Scholar]
- Smith, J. C., Stumpe, M. C., Van Cleve, J. E., et al. 2012, PASP, 124, 1000 [Google Scholar]
- Smith, A. M. S., Gandolfi, D., Barragán, O., et al. 2017, MNRAS, 464, 2708 [Google Scholar]
- Smith, A. M. S., Breton, S. N., Csizmadia, S., et al. 2022, MNRAS, 510, 5035 [NASA ADS] [CrossRef] [Google Scholar]
- Stumpe, M. C., Smith, J. C., Van Cleve, J. E., et al. 2012, PASP, 124, 985 [Google Scholar]
- Tokovinin, A. 2018, PASP, 130, 035002 [Google Scholar]
- Tokovinin, A., Fischer, D. A., Bonati, M., et al. 2013, PASP, 125, 1336 [NASA ADS] [CrossRef] [Google Scholar]
- Tran, Q. H., Bowler, B. P., Endl, M., et al. 2022, AJ, 163, 225 [NASA ADS] [CrossRef] [Google Scholar]
- Trifonov, T., Brahm, R., Espinoza, N., et al. 2021, AJ, 162, 283 [NASA ADS] [CrossRef] [Google Scholar]
- Trifonov, T., Brahm, R., Jordán, A., et al. 2023, AJ, 165, 179 [NASA ADS] [CrossRef] [Google Scholar]
- Tull, R. G., MacQueen, P. J., Sneden, C., & Lambert, D. L. 1995, PASP, 107, 251 [NASA ADS] [CrossRef] [Google Scholar]
- Twicken, J. D., Chandrasekaran, H., Jenkins, J. M., et al. 2010, SPIE Conf. Ser., 7740, 77401U [Google Scholar]
- Valenti, J. A., & Piskunov, N. 1996, A&AS, 118, 595 [NASA ADS] [CrossRef] [EDP Sciences] [Google Scholar]
- Veras, D. 2016, Roy. Soc. Open Sci., 3, 150571 [NASA ADS] [CrossRef] [Google Scholar]
- Villaver, E., & Livio, M. 2009, ApJ, 705, L81 [Google Scholar]
- Villaver, E., Livio, M., Mustill, A. J., & Siess, L. 2014, ApJ, 794, 3 [NASA ADS] [CrossRef] [Google Scholar]
- Vines, J. I., & Jenkins, J. S. 2022, MNRAS, 513, 2719 [NASA ADS] [CrossRef] [Google Scholar]
- Wang, S., Jones, M., Shporer, A., et al. 2019, AJ, 157, 51 [Google Scholar]
- Wang, X.-Y., Rice, M., Wang, S., et al. 2024, arXiv e-prints [arXiv:2408.10038] [Google Scholar]
- Wittenmyer, R. A., O’Toole, S. J., Jones, H. R. A., et al. 2010, ApJ, 722, 1854 [NASA ADS] [CrossRef] [Google Scholar]
- Wittenmyer, R. A., Clark, J. T., Trifonov, T., et al. 2022, AJ, 163, 82 [NASA ADS] [CrossRef] [Google Scholar]
- Wu, Y., & Murray, N. 2003, ApJ, 589, 605 [Google Scholar]
- Wu, D.-H., Rice, M., & Wang, S. 2023, AJ, 165, 171 [NASA ADS] [CrossRef] [Google Scholar]
- Zahn, J. P. 1977, A&A, 57, 383 [Google Scholar]
- Zechmeister, M., & Kürster, M. 2009, A&A, 496, 577 [CrossRef] [EDP Sciences] [Google Scholar]
- Zhou, G., Quinn, S. N., Irwin, J., et al. 2021, AJ, 161, 2 [Google Scholar]
- Ziegler, C., Tokovinin, A., Briceño, C., et al. 2020, AJ, 159, 19 [Google Scholar]
- Zink, J. K., & Howard, A. W. 2023, ApJ, 956, L29 [Google Scholar]
For a detailed overview of our knowledge of the Solar System and a discussion of how it has influenced our understanding and knowledge of planet formation, we refer to Horner et al. (2020) and references therein; the review by Lissauer (1993) describes our understanding of planet formation in the years before the dawn of the exoplanet era.
All Tables
All Figures
|
Fig. 1 GLS periodogram of the WASP-South data for TOI-2420 from 2006 to 2011. There is a possible signal near 40 days, along with aliases from the yearly sampling. The dotted horizontal line is the 1% likelihood false-alarm level. |
| In the text | |
|
Fig. 2 Periodograms of the RVs data for TOI-2420 (upper panel) and TOI-2485 (lower panel). The dotted horizontal line represents the 0.01% false-alarm level, and the vertical green line is the maximum power, which corresponds to the planetary period. |
| In the text | |
|
Fig. 3 NESSI speckle imaging results from observations of TOI-2485 on 2021 April 1. Sensitivity curves and reconstructed images are shown for each filter (central wavelengths 562 and 832 nm). No nearby companions have been detected. |
| In the text | |
|
Fig. 4 NIR AO imaging and sensitivity curves for the Paloamr Observations of TOI-2485. Inset: image of the central portion of the image. No nearby companions have been detected. |
| In the text | |
|
Fig. 5 SED for TOI-2420 (left) and TOI-2485 (right) and the best-fit models from (Phoenix v2, Husser et al. 2013). The magenta and blue diamonds show the synthetic and the observed photometry, respectively. The 1σ uncertainties of the magnitudes are marked with vertical bars, and the horizontal bars show the effective width of the respective passband. The lower panels show the residuals normalized to the photometry errors. |
| In the text | |
|
Fig. 6 Resulting fit from the TOI-2420 b joint model. Top panel: phase-folded transit light curve TOI-2420 b. Nominal TESS and LCO observations are shown in light gray. The solid coloured circles represent the binned data. The transit models are shown with a solid black line. Bottom panel: phase-folded RV signal for TOI-2420 b following the subtraction of the systemic velocity. The blue circles and triangles show the CHIRON and TULL RV data, respectively, and green squares, red pentagons, purple hexagons, and brown circles show the MINERVA RVs, split into four different datasets. |
| In the text | |
|
Fig. 7 Resulting fit from the TOI-2485 b joint model. Top panel: phase-folded transit light curve TOI-2485 b. Nominal TESS and LCO observations are shown in light gray. The solid coloured circles represent the binned data. The transit models are shown with a solid black line. Bottom panel: phase-folded RV signal for TOI-2485 b following the subtraction of the systemic velocities. The orange circles, diamonds, and squares show CHIRON, FEROS, and TRES RV data, respectively. |
| In the text | |
|
Fig. 8 TOI-2485 RV time series. The trend in the data is clear and was modeled with a quadratic trend, whose significance is higher than in a linear trend model. |
| In the text | |
|
Fig. 9 Eccentricity distribution as a function of the orbital period for Jupiter-sized planets (data taken as of UT 2024 March 13). The dashed blue line represents the 10-day boundary between HJs and WJs. The orange point represents TOI-2420 b, and the cyan point represents TOI-2485 b. The red triangles represent the planets in multiplanet systems. |
| In the text | |
Current usage metrics show cumulative count of Article Views (full-text article views including HTML views, PDF and ePub downloads, according to the available data) and Abstracts Views on Vision4Press platform.
Data correspond to usage on the plateform after 2015. The current usage metrics is available 48-96 hours after online publication and is updated daily on week days.
Initial download of the metrics may take a while.