| Issue |
A&A
Volume 692, December 2024
|
|
|---|---|---|
| Article Number | A168 | |
| Number of page(s) | 12 | |
| Section | Stellar structure and evolution | |
| DOI | https://doi.org/10.1051/0004-6361/202449699 | |
| Published online | 09 December 2024 | |
A photometric and spectroscopic study of eight semi-detached eclipsing binaries
1
National Astronomical Observatories, Chinese Academy of Sciences, Beijing, 100101, People’s Republic of China
2
State Key Laboratory of Solar Activity and Space Weather, Beijing, 100190, China
3
School of Astronomy and Space Science, University of Chinese Academy of Sciences, Beijing, 100049, People’s Republic of China
4
Nanjing Institute of Astronomical Optics & Technology, Chinese Academy of Sciences, Nanjing, 210042, China
5
CAS Key Laboratory of Astronomical Optics & Technology, Nanjing Institute of Astronomical Optics & Technology, Nanjing, 210042, China
6
Key laboratory of Space Astronomy and Technology, National Astronomical Observatories, Chinese Academy of Sciences, Beijing, 100101, China
7
Shandong Key Laboratory of Optical Astronomy and Solar-Terrestrial Environment, School of Space Science and Physics, Institute of Space Sciences, Shandong University, Weihai, Shandong, 264209, China
8
Department of Astronomy, School of Physics, Peking University, Yiheyuan Rd. 5, Haidian District, Beijing, 100871, People’s Republic of China
⋆ Corresponding author; This email address is being protected from spambots. You need JavaScript enabled to view it.
Received:
22
February
2024
Accepted:
7
November
2024
Abstract
Context. Semi-detached eclipsing binaries offer an exceptional opportunity to validate the evolutionary models of interacting binaries. This entails determining the absolute parameters and evaluating the evolutionary status of the binary components through simultaneous analysis of both light and radial velocity curves. The Transiting Exoplanet Survey Satellite (TESS) provides high-precision light curves, while the Large Sky Area Multi-Object Fibre Spectroscopic Telescope Medium-Resolution spectroscopic Survey (LAMOST MRS) offers multi-epoch observations. The combination of these data enhances the accuracy of deriving precise parameters for binary systems.
Aims. The aim of this study is to estimate the absolute parameters of semi-detached binary components, offer potential explanations for their evolutionary status, and investigate long-term variations in orbital periods to explore their underlying causes.
Methods. By cross-matching the eclipsing binary catalogue from TESS with that from LAMOST MRS, semi-detached eclipsing binaries with radial velocities spanning more than 0.3 phases were authenticated. The absolute parameters for these systems were determined by simultaneous modelling of light curves and radial velocities using the Wilson-Devinney programme. Additionally, the secular orbital variations were further analysed using O–C curves.
Results. Eight semi-detached eclipsing binaries have been identified. Among them, seven contain primary stars situated within the main-sequence band, while their secondaries are all in evolved stages. This suggests that these systems likely originated as detached binaries and have undergone a reversal of the mass ratio. However, TIC 428257299 is an exception where the primary is Roche lobe-filling, and its secondary has experienced mass loss events. Additionally, TIC 8677671 and TIC 318217844 demonstrate secular cyclical variations in orbital periods. Specifically, for TIC 8677671, the cyclical change could result from magnetic activity or a third body that is likely to be compact, with a mass of at least 2.97 M⊙.
Key words: binaries: close / binaries: eclipsing
© The Authors 2024
 Open Access article, published by EDP Sciences, under the terms of the Creative Commons Attribution License (https://creativecommons.org/licenses/by/4.0), which permits unrestricted use, distribution, and reproduction in any medium, provided the original work is properly cited.
This article is published in open access under the Subscribe to Open model. This email address is being protected from spambots. You need JavaScript enabled to view it. to support open access publication.
1. Introduction
Eclipsing binaries offer a preferred method of determining the absolute parameters of each star independently of models. This is achieved by concurrently analysing light curves and variations in radial velocity (RV). These stellar parameters play a crucial role in constraining both stellar structures and theoretical models of stellar evolution, as has been demonstrated by previous studies (e.g., Zhang et al. 2017; Park et al. 2018; Soydugan et al. 2020; Hełminiak et al. 2021; Li et al. 2022).
Eclipsing binary stars are categorised into three classes: detached, semi-detached, and those in contact based on their Roche lobe configurations (Kopal 1959; Alcock et al. 1997). A semi-detached binary system involves one component filling its Roche lobe and transferring mass to its companion. This interaction between binary components holds significant importance in stellar evolution and serves as a means to validate corresponding models (Ibanoǧlu et al. 2006). Consequently, semi-detached binaries play a pivotal role in the study of various astrophysical phenomena, such as mass transfer, accretion between components, and the loss of angular momentum through magnetic stellar winds. An Algol-type binary is generally semi-detached, comprising a main-sequence primary ranging from mid-B to mid-F type and an F-G-K type giant or subgiant secondary that fills or overflows its Roche lobe (Budding 1989). The two components can have comparable sizes in close proximity but significantly different masses. Generally, the more massive primary is brighter than the less massive secondary. During the formation of an Algol-type system, it is suggested that the initially massive component of a binary will first fill the Roche lobe, subsequently transferring a substantial amount of mass to the other component. This process leads to a reversal of the mass ratio and triggers a rapid evolution of the secondary (Pols 1994; Li et al. 2022).
To gain a comprehensive understanding of interactive binary systems, it is imperative to precisely determine the absolute parameters of both components within them (e.g., Malkov 2020). Although thousands of semi-detached binaries have been identified through light curves, only a limited number have undergone accurate analysis, allowing for the simultaneous modelling of their light and RV curves. Obtaining the absolute parameters for these systems proves challenging, primarily due to the typically faint nature of their secondaries in the optical band. Ibanoǧlu et al. (2006) presented absolute parameters for 61 semi-detached Algol-type binaries, while the well-known catalogue by Budding et al. (2004) listed 411 semi-detached Algol-type binaries. However, a significant portion of these binaries is sourced from the catalogues of Brancewicz & Dworak (1980) and Svechnikov & Kuznetsova (1990, 2004), introducing some uncertainty into the parameters as they were estimated solely based on light curves and empirical relationships.
In recent years, the increasing number of eclipsing binaries has been observed thanks to survey telescopes. Sky surveys conducted by the Convection, Rotation and planetary Transit (CoRoT; Auvergne et al. 2009) and Kepler (Borucki et al. 2010) offered unparalleled precision and continuity. These sustained, high-precision surveys play a pivotal role in determining the orbital parameters of binaries. The Transiting Exoplanet Survey Satellite (TESS; Ricker et al. 2015) primarily aims to discover transiting exoplanets, provides continuous time-series photometry data. Utilising the Interlacing Code for Eclipsing Binary Data validation, and the Lightcurve Analysis Tool for Transiting Exoplanets, Mortensen et al. (2021) have reported thousands of TESS eclipsing binary candidates.
Fortunately, the second phase of LAMOST initiated a Medium-Resolution spectroscopic Survey (MRS; R ∼ 7500) in 2018. This survey delivers medium-resolution spectra for hundreds of thousands of stars across multiple epochs, enabling the acquisition of time-series RVs (Zong et al. 2020). Moreover, LAMOST has conducted a low-resolution spectroscopic survey since 2012, offering a low-resolution spectral survey (LRS; R ∼ 1800 Å) for over ten million stars (Luo et al. 2012). These spectra facilitate the determination of stellar atmosphere parameters. By combining the high-precision photometry from TESS, time-series RVs from LAMOST MRS, and stellar atmosphere parameters from LAMOST LRS, the orbital parameters of binaries and the absolute parameters of both stellar components can be derived.
By cross-matching the medium-resolution star catalogue from LAMOST (DR9) with the TESS eclipsing binary catalogue, we initially identified a pool of candidate objects. From this pool, we further selected samples for which the phase of the RV curve exceeded 0.3. In the end, we successfully confirmed eight semi-detached eclipsing binary systems according to LAMOST data, including two double-lined eclipsing binaries (TIC 8677671 and TIC 318217844) and six single-lined eclipsing binaries (TIC 312060302, TIC 428257299, TIC 168809669, TIC 406798603, TIC 158431889, and TIC 159386347).
Both TIC 8677671 (WW Cnc) and TIC 318217844 (XZ UMa) were recognised as Algol-type eclipsing systems, and their absolute parameters were determined using the simple iterative method (Svechnikov & Kuznetsova 1990; Kim et al. 2003; Budding et al. 2004). Recently, Lee et al. (2024) presented the absolute properties of TIC 318217844 using data from TESS and the Bohyunsan Observatory Echelle Spectrograph. They discovered high-frequency pulsation signals from its primary star, which is a δ Sct pulsator, and classified the system as an oscillating eclipsing Algol-type binary.
TIC 312060302 (V1046 Cas) has been classified as an Algol-type eclipsing system by the All Sky Automated Survey for SuperNovae (ASAS-SN), exhibiting an orbital period of 0.9805023 days (Jayasinghe et al. 2020). TIC 428257299 was identified as an Algol-type binary with an orbital period of 0.6389842 days according to ASAS-SN (Jayasinghe et al. 2020), while it was classified as W UMa type with an orbital period of 0.6390052 days in the AAVSO International Variable Star Index (VSX) (Watson et al. 2006). TIC 168809669 (UW Boo) was proposed as an Algol-type eclipsing system binary with an orbital period of 1.00471 days in studies by Svechnikov & Kuznetsova (1990), Watson et al. (2006), Samus’ et al. (2017) and Qian et al. (2018). Chen et al. (2018) report a slightly different period of 1.0046877 days based on Wide-field Infrared Survey Explorer (WISE) data. The absolute parameters of TIC 168809669 (UW Boo) were roughly estimated by Svechnikov & Kuznetsova (1990), Kreiner (2004) and Soydugan et al. (2006). Additionally, Manzoori (2015) conducted an analysis of minimal times and derived absolute parameters based on its light curves. TIC 406798603 (EW Boo) was classified as an Algol-type binary with an orbital period of 0.90636 days according to ASAS-SN data (Jayasinghe et al. 2020). A slightly different orbital period of 0.9086271 days was reported based on WISE data (Chen et al. 2018). Zhang et al. (2015) determined the absolute parameters of TIC 406798603 solely from photometric data. Doğruel & Gürol (2015) and Kim et al. (2022) identified TIC 406798603 as a spectroscopic double-lined binary and further refined its absolute parameters through analyses of both photometric and spectroscopic data. These studies explored the secular periodic variations of TIC 406798603. Both Doğruel & Gürol (2015) and Zhang et al. (2015) also furnished characteristic parameters of the pulsations of TIC 406798603, categorising the primary star as a δ Sct pulsator. Additionally, Kim et al. (2022) identified additional pressure-mode pulsations, confirming and integrating the frequencies discovered in the studies by Doğruel & Gürol (2015) and Zhang et al. (2015).
TIC 158431889 (V882 Lyr) has been recognised as a β Lyrae-type eclipsing system, displaying an orbital period of 0.5725256 days as indicated by ASAS-SN data (Jayasinghe et al. 2020). Additionally, Slawson et al. (2011) also classified it as a β Lyrae-type based on Kepler observations. Moreover, Lurie et al. (2017) classified TIC 158431889 (V882 Lyr) as exhibiting ellipsoidal variation. In the case of TIC 159386347, it was identified as an overcontact (W UMa-type) system based on Kepler data (Slawson et al. 2011). The system parameters for both TIC 158431889 and TIC 159386347 were established using an artificial intelligence method (Slawson et al. 2011; Armstrong et al. 2014). However, as per the available information, the absolute parameters for these two systems have not yet been disclosed.
In this paper, based on simultaneously modelling light curves from TESS and RVs from LAMOST MRS, we performed calculations and analyses of the system’s parameters and absolute stellar parameters for all eight semi-detached binary systems with the assistance of the Wilson-Devinney (W-D) programme. The organisation of this paper is as follows. In Sect. 2, we introduce the photometric and spectroscopic data utilised in our analysis. Section 3 presents the results obtained by modelling the light and RV curves using the W-D programme. Finally, discussions and conclusions are provided in Sects. 4 and 5, respectively.
2. Data
2.1. Photometry and orbital periods
TESS was launched on April 18 2018, equipped with four identical and wide-field cameras designed to monitor a strip of the sky in a 24 ° ×90° configuration. The passband of TESS covers the range from 600 to 1000 nm. Employing each of its cameras, TESS systematically observes each sky strip for at least 27 days and nights. During the primary mission of TESS, full-frame images (FFIs) were taken every 30 minutes. In the first mission extension, FFIs were taken every 10 minutes. Starting from Cycle 5, the second mission extension, FFIs will be taken every 200 seconds. The target pixel files (TPFs) of TESS represent the most raw form of target-specific data available at the Mikulski Archive for Space Telescopes (MAST). There is also 2-minute cadence during the primary mission. There are two types of TPFs: 2-minute cadence (available for all mission cycles) and 20-second cadence (available from Cycle 3 onwards). For the purposes of this study, the data with a 2-minute cadence were utilised to avoid any overlap. The TESS satellite boasts a pixel scale of 21 arcseconds, implying a higher likelihood of crowding in the observed field. In each sector, an aperture of approximately 3 by 3 pixels with slight variations is employed. An important consideration is the potential contamination of the aperture by sources located beyond a radius of 63 arcseconds from the target. To address this concern, we conducted a thorough examination of the vicinity of the target sources to identify any additional stars using Gaia Data Release 3 (DR3; Gaia Collaboration 2016, 2023). If other stars were found, their Gaia magnitudes would be converted to TESS magnitudes to calculate the contribution of contaminated light. This conversion was performed based on the method outlined by Stassun et al. (2019).
For TESS observations of heavily contaminated sources, alternative datasets from Kepler, ASAS-SN, and Gaia were employed. The Kepler mission’s spacecraft is equipped with a wide-angle telescope featuring a 1 m diameter mirror to monitor a field of view (FoV) of 16.1°, covering a sky area of 115.6 square degrees. The passband of Kepler ranges from 420 to 900 nm and light curves with a 30-minute cadence are available for most stars. ASAS-SN, monitoring the entire visible sky down to V ∼ 17 mag, provides light curves in V-band and g-band magnitudes with a cadence of approximately 1–3 days (Jayasinghe et al. 2019). Although the Gaia band observations are sparse compared to the TESS data, they offer high precision in position. The median position uncertainties are 0.01–0.02 mas for G < 15 and 1.0 mas at G = 21 mag. Consequently, the G-band photometry from Gaia was used as a supplementary source for systems that experienced significant contamination in the TESS data.
The basic information of the eight systems is shown in Table 1. The light curves used were downloaded from MAST database. The Science Processing Operations Center (SPOC) pipeline provides two fluxes for each light curve: the simple aperture photometry (SAP) flux and the Pre-search Data Conditioning SAP (PDCSAP) flux (Jenkins et al. 2010, 2016). In our analysis, the PDCSAP fluxes were used because their long-term trends were eliminated. The data from TESS used in this work are shown in Table 2. Table 3 shows the targets that have contaminated the TESS light curves of the eight studied systems.
Basic information for the eight systems studied in the work.
Used data of the eight binaries from TESS.
Contaminated sources within 63 arcseconds for the eight binaries.
The orbital periods of these systems have been calculated by some previous studies. To further refine their orbital periods and investigate secular variations, we scrutinised the ‘O–C Gateway’ database1 (Paschke & Brat 2006), which has been scanned over an extended period, spanning more than a century. TIC 428257299, TIC 158431889, and TIC 159386347 are absent from the databases, whereas the remaining five systems are included. Due to the limited number of occurrences of shallow secondary eclipses in all the systems, we opted to utilise primary timings for the analysis. Subsequently, the available primary minima data for the systems, including visual, photographic, photoelectric CCD, obtained from the ‘O–C Gateway’, were prepared for analysis. Additionally, primary minima times from TESS data were incorporated into the analysis of the periods for these systems. The conversion between heliocentric Julian day (HJD) and barycentric Julian day (BJD) timings was conducted using online applets (Eastman et al. 2010)2. The results indicate that the orbital periods of TIC 8677671, TIC 318217844, and TIC 406798603 exhibit secular variations, and TIC 0312060302 and TIC 168809669 do not display obvious secular variations in their orbital periods. Considering that TIC 406798603 has previously been examined in the study by Kim et al. (2022), our analysis concentrated exclusively on the O–C curves of TIC 8677671 and TIC 318217844.
The equation of a quadratic plus the light-time effect (LITE) by a third body is usually used for the analysis of changes in orbital periods:
![Mathematical equation: $$ \begin{aligned} T = T_0 + E \times P + Q \times E^2 + {{a_{12}\sin i}\over {c}}[{{1-e^2}\over {1+e\cos \nu }} +e\sin \omega ], \end{aligned} $$](/articles/aa/full_html/2024/12/aa49699-24/aa49699-24-eq1.gif) (1)
(1)
where T0 is the reference time for the primary eclipse, P stands for the orbital period, and E and Q represent the epoch number and the variation in the period rate, respectively. The final term in the equation accounts for the time delay resulting from the motion of the eclipsing binary around the common centre of mass with the unseen star in the close binary, and a12, e, i, ω, and ν are the orbital parameters (Irwin 1959).
The O–C analysis of TIC 318217844 suggests a secular orbital period decrease in the binary system. The rate of period decrease turns out to be dP/dE = 3.7 × 10⁻¹⁰ days cycle−1 or dP/dt = 1.1 × 10⁻⁷ days yr−1. Additionally, it is observed that there are cyclic variations in the O–C graphs of the two systems, respectively (Fig. 1). To account for this cyclic variation, the theoretical fit was applied to all minima data. The orbital parameters of the third body are detailed in Table 4. TIC 8677671 also shows the fourth body whose parameters are also shown in Table 4. TIC 159386347 is not included in the ‘O–C Gateway’, but was observed by both Kepler and TESS. We analysed its O–C curve based on data from Kepler (Quarters 0–17) and TESS, and found no secular trend. The periods obtained using O–C method are in good agreement with those calculated by the data of ASAS-SN or TESS (Jayasinghe et al. 2020; Mortensen et al. 2021). The periods are listed in Table 1.
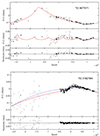 |
Fig. 1. O–C diagrams of TIC 8677671 and TIC 318217844 with LITE ephemeris. |
Parameters calculated as a result of O–C analyses.
2.2. Spectroscopy
LAMOST is a quasi-meridian reflecting Schmidt telescope with an effective aperture of approximately 4 m, and a FoV that is 5° in diameter (Cui et al. 2012). It can simultaneously observe 4000 targets with wavelengths ranging from 3800 to 9000 Å. During the first regular survey (2012–2017), LAMOST operated in a low-resolution mode (R ∼ 1800 Å) (Luo et al. 2012). In September 2018, LAMOST initiated the MRS, with each exposure lasting 10 or 20 minutes. The MRS utilises almost half of the telescope’s observation time to enable time-domain astronomy, employing both blue (4950–5350 Å) and red (6300–6800 Å) arms (Liu et al. 2019). The LAMOST MRS aims to observe approximately 200,000 stars, averaging 60 observations per star, from 2018 to 2023. As a result, time-series RVs of a large number of objects can be obtained.
The RVs of the eight systems observed by LAMOST MRS were computed utilising cross-correlation functions (Merle et al. 2017), and the RV measurements are provided in Table B.1. The spectra from the Phoenix library serve as the templates (Husser et al. 2013)). We used the parameters (effective temperature, Teff, surface gravity, log g, metallicity, [Fe/H]) from TIC v8.2 as reference parameters. For each sample, the parameters of the templates were determined by selecting the closest match to the values provided by TIC v8.2 (Paegert et al. 2021). In cases where [Fe/H] was not provided, it was set to 0.0. During the calculation process, we tried to use both red and blue spectra, respectively. Overall, the results from the blue arm were more pronounced, so we opted to use the blue arm.
In addition to the RVs calculated from MRS, the orbital solution for binary stars also requires atmospheric parameters derived from low-resolution spectra. Utilising the Universite de Lyon Spectroscopic analysis Software (ULySS), constructed upon the ELODIE stellar library (Prugniel & Soubiran 2001; Prugniel et al. 2007; Koleva et al. 2009; Wu et al. 2011, 2014), the LAMOST pipeline furnishes atmosphere parameters (Teff, log g, and [Fe/H]) for stars ranging from later A to K types observed by LAMOST LRS, while the LAMOST pipeline employs a single-star model. To estimate the effective temperature of each target, we applied the broadband spectral energy distribution (SED) fitting method described by Yi et al. (2022). A comprehensive description can be found in Yi et al. (2022). Initially, we gathered archival broadband photometry from various surveys, including 2MASS (J, H, K bands Skrutskie et al. 2006), WISE (W1-W4 bands Wright et al. 2010), Gaia (Bp, Rp, Gp bands Gaia Collaboration 2023), and Galex (NUV and FUV bands Martin et al. 2005). We also incorporated trigonometric parallax-derived distances, D, and interstellar extinction (AG) from Gaia DR3 (Gaia Collaboration 2023). The model SEDs are Kurucz synthetic photometry models obtained from the VOSA website3 (Bayo et al. 2008). Teff represents the effective temperature of the binary system derived from the SED analysis. The results of SED analysis are shown in Fig. 2. After acquiring the temperature ratio, T2/T1, and radius ratio, k (R2/R1), we derived each component’s effective temperature using Equation (3) given by Zwitter et al. (2003):
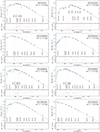 |
Fig. 2. Single-model fit for the broadband SEDs of the eight targets. The red dots represent photometric fluxes from various bands, as is indicated and labelled by the vertical grey lines. The blue curve shows the best-fit Kurucz SED with interstellar dust extinction corrected. The blue diamonds represent the best-fit synthetic photometric fluxes. The lower sub-panel shows the relative residuals, defined as (observed flux – synthetic flux) divided by the observed flux. |
 (2)
(2)
In addition, we have compared Teff values obtained from SED analysis with those from LAMOST in Table 5 to evaluate how accurately LAMOST estimates Teff values for eclipsing binaries. In Table 5, the errors of Teff values from LAMOST are assessed as the variance among all available temperatures obtained from LAMOST LRS. In cases in which only one temperature is available for a binary system, the temperature error is assumed to be the value provided by the LAMOST pipeline. For TIC 0312060302, whose spectrum is considered to correspond to a hot star, the effective temperature of 10 078 K, reported by Xiang et al. (2022), who calculated it using LAMOST observations, is shown in Table 5. The results indicate that the Teff values from the two methods are consistent for our samples where the light from secondaries contributes less than 25% of the total light (refer to the results in Tables 6 and 7 below).
Effective temperatures from SEDs and LAMOST, respectively.
Orbital solutions for TIC 8677671, TIC 318217844 and TIC 406798603.
Orbital solutions for five spectroscopic single-lined binaries.
3. Orbital solutions
The W-D programme is a sophisticated tool for analysing binary systems, incorporating principles of physics and numerical convergence. It utilises Roche geometry to depict the surface profiles of stars in binary systems and employs light and RV data to infer binary parameters (Wilson & Devinney 1971; Wilson 1979; Wilson & Van Hamme 2014). In this investigation, we utilised the 2015 version of the W-D programme to evaluate both the system and absolute stellar parameters of eight eclipsing binaries. The light curves analysed by the W-D programme accounted for identified contamination from external sources.
The T1, as is discussed in Sect. 2.2, served as an input for the primary temperatures in the W-D programme. Given the tightness of the binary system and its symmetric light curve featuring two identical eclipsing intervals, we assumed a circular orbit and synchronous rotation for both components. We fixed e = 0, w = 0, and F1 = F2 = 1.0 in the W-D programme. Gravity darkening coefficients (g1, g2) were fixed at 0.32 for the low-temperature component with a convective atmosphere and at 1.0 for the high-temperature component with a radiative atmosphere, following the conventions established by Lucy (1967). Concerning bolometric albedos (A1, A2), values of 0.5 and 1.0 were typically assigned for convective and radiative atmospheres, respectively, in accordance with principles outlined in Rucinski (1969). Limb darkening coefficients were automatically interpolated from coefficient tables based on the actual surface temperature and gravity, as was detailed by (van Hamme 1993). Additionally, van Hamme (1993) recently updated their data files, which include TESS passband (IBAND = 95) information for limb darkening coefficients. Access to these updated data files is necessary when running the 2015 version of the W-D programme4.
To determine systems’ and absolute parameters simultaneously, both light and RV curves were used as inputs in the W-D programme. During the modelling process, the following parameters were treated as free variables: the mass ratio (q), orbital semi-major axis (a), secondary temperature (T2), inclination of the system’s orbit (i), phase shift, the surface potential, Ω, of either the primary or secondary component, the RV of the system’s mass centre (Vγ), and the fractional value of the primary luminosity.
Information of spots in the best-fitting model. The errors were determined through visual inspection of their effects on the light curve.
The W-D programme encompasses various modes corresponding to different binary configurations. In this study, we explored both detached and semi-detached modes for each system. For all eight systems, both detached and semi-detached yielded reasonable fittings. The parameters obtained from these modes are nearly identical within the specified error ranges. The results deduced from both modes indicate that the eight systems can be classified as semi-detached binaries. Consequently, we focus on the results from semi-detached mode in the subsequent discussion. To search for the best-fitting binary model and obtain more reliable stellar parameters, the q-search method was applied to constrain the mass ratio values for spectroscopic single-lined binaries (Liakos & Niarchos 2012). The step size for q was set to 0.05–0.1 for q values ranging from 0.05 to 1.0. To better explore the structures of these systems, the fill-out factors were calculated according to the formula ffill = ΩI/Ω − 1 for ΩI < Ω and ffill = (ΩI − Ω)/(ΩI − Ωo) for ΩI ≥ Ω, where Ω is the modified equipotential potential of the system, ΩI is the value of the inner critical Roche equipotential, and Ωo is the value of the outer critical Roche equipotential (Bradstreet 2005).
To achieve a more realistic error estimate for T2, the error of T1 was taken into account. Tests on individual light curves indicate that T2 is highly sensitive to changes in T1 (also see Liakos (2018)). Therefore, this error in T2 was derived from the W-D fittings based on the errors in T1. We checked the sources of contamination and incorporated their effects into the W-D programme for each studied system. Due to significant contamination in TIC 0312060302, we utilised ASAS-SN and Gaia observations instead of TESS data. Similarly, to mitigate the impact of nearby sources on TIC 159386347, we used Kepler data.
TIC 406798603 has been identified by Kim et al. (2022) as a spectroscopic double-lined binary. We also incorporated their RV data alongside ours in the W-D fitting procedure. The absolute parameters obtained using combined double-lined RVs and those obtained using only our single-lined RVs are consistent within the error range. Figure 3, 4 and Table 6 present the geometrical and physical parameters derived from the simultaneous analysis of the light and RV curves for three spectroscopic double-lined binaries. Figure A.1 and Table 7 correspond to the results of five spectroscopic single-lined binaries. To address the asymmetries in the light curves, we included fitting models with hot spots or cold spots. The information on these spots are given in Table 8. The secondaries of TIC 318217844 and TIC 168809669 have best-fit albedos of 0.70 and 0.78, respectively, which are slightly higher than the expected physical values. The rotational distortion of the RV curve is noticeable around the phase of the primary eclipse (close to phase 0), as is depicted in TIC 318217844 of Fig. 3. This distortion might stem from the non-symmetric distribution of surface brightness. The primary cause behind this non-symmetric distribution manifests as the Rossiter-McLaughlin effect. This effect illustrates that the observed RV of a partially eclipsed star tends to exhibit a systematic bias towards either receding or approaching velocities, depending on whether its approaching or receding hemisphere is being eclipsed (Rossiter 1924; McLaughlin 1924). The results of the W-D programme show that, except for TIC 428257299, where the primary star fills its Roche lobe, the other seven systems’ Roche lobes are filled by secondary stars.
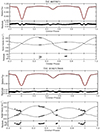 |
Fig. 3. Light and RV curves of TIC8677671 and TIC 318217844. The solid lines are theoretical fits from the W-D programme. The residuals from theoretical representation are also shown. |
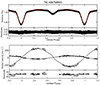 |
Fig. 4. Light and RV curves of TIC406798603. The circles and triangles represent the RV measurements from this study and from Kim et al. (2022), respectively. The solid curves were derived from the light and RV solutions using the W-D programme. |
4. Discussions
4.1. Evolutionary states
We conducted an analysis on eight semi-detached eclipsing binaries, determining their absolute parameters through simultaneous fitting of high-precision photometric data primarily from TESS and RV curves obtained from LAMOST MRS. Among these systems, three are spectroscopic double-lined binary systems and five are spectroscopic single-lined binary systems. In the case of TIC 428257299, the primary star fills its Roche lobe. However, in the remaining seven systems, their secondaries fill their Roche lobes, while the primaries remain detached from the lobes. Notably, among these eight systems, the absolute parameters of TIC 0312060302, TIC 428257299, TIC 158431889, and TIC 159386347 were calculated for the first time in this work, and the absolute parameters of TIC 8677671 and TIC 168809669 were determined for the first time using combined photometric and spectroscopic data in this study. TIC 318217844 and TIC 406798603 have previously been analysed in other works combining photometric and spectroscopic data (Doğruel & Gürol 2015); Kim et al. 2022; Lee et al. 2024).
The system parameters of TIC 158431889 and TIC 159386347 had been estimated by Prša et al. (2011), Slawson et al. (2011) and Armstrong et al. (2014), based solely on photometric data. They reported significantly different parameters for both TIC 158431889 and TIC 159386347 but arrived at the same conclusion for the morphology types. The absolute parameters of TIC 8677671, TIC 168809669, and TIC 318217844 were calculated relying on older or lower-quality data (Brancewicz & Dworak 1980; Budding et al. 2004; Svechnikov & Kuznetsova 1990). Manzoori (2015) calculated the absolute parameters of TIC 168809669 solely using photometric data. In comparison to their findings, our parameters are derived from simultaneous modelling of light and RV curves using the binary W-D programme. For TIC 318217844, Lee et al. (2024) have presented the absolute properties, utilising data from TESS and Bohyunsan Observatory Echelle Spectrograph. Within the margin of error, our results are close to theirs.
Doğruel & Gürol (2015) and Kim et al. (2022) have provided the absolute parameters of TIC 406798603 through an analysis of photometric and high-resolution spectroscopic data. Additionally, Kim et al. (2022) delved into further discussions on secular variations in the orbital period. Since distinct double lines of TIC 406798603 were not resolved in the spectra obtained from LAMOST, we list the results calculated by combining RV data from Kim et al. (2022) and ours.
In order to analyse the evolutionary states of the eight systems, the absolute parameters of both components of these eclipsing binaries are presented in logM-logL and logM-logR diagrams (Fig. 5). The zero-age main sequence (ZAMS) and the terminal-age main sequence (TAMS) were derived using the binary star evolution code of Hurley et al. (2002). Except for TIC 428257299, the primary stars in the other seven systems are located within the main-sequence band, indicating that they are non-evolved main-sequence stars. Conversely, the secondaries have evolved near or beyond the TAMS, appearing oversized and overluminous compared to main-sequence stars of the same mass. They are classified as subgiants with lower masses than the primaries. These results suggest that these binaries might have formed from initially detached binary systems through case A mass transfers, subsequently undergoing mass-reverse evolutions (Pols 1994; Qian et al. 2013). Additionally, these binaries are probably still in the slow mass exchange stage, with mass transferring from the less massive secondaries to the more massive primaries.
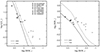 |
Fig. 5. M-L and M-R relations of the eight systems. The primaries and the secondaries are represented by filled and open symbols, respectively. The ZAMS and the TAMS obtained using the binary star evolution code from Hurley et al. (2002) are described with solid and dashed black lines. |
Regarding TIC 428257299, the primary star fills its Roche lobe. The secondary star is approaching Roche lobe overflow and has a mass lower than that of a main-sequence star with the same temperature, implying previous mass loss. It might have undergone a phase of thermal relaxation oscillation, recently experienced contact without reaching the thermal contact phase, and subsequently been disrupted into its current semi-detached state. At present, the secondary star exhibits a larger radius compared to a main-sequence star of equivalent mass, indicating the possibility of previous experiences with mass ratio reversal and contact processes. Figure 5 illustrates the evolution of both primary and secondary components.
In addition, among these systems, TIC 318217844 exhibits a high mass ratio of m2/m1 = 0.689 and a radius ratio of R2/R1 ∼ 1.44. This finding aligns with the observations of Li et al. (2022), which demonstrated a correlation between mass ratios and radii ratios for semi-detached binaries in M31. In their sample, comprising 12 semi-detached systems, only two exhibit high mass ratios (0.596 and 0.843) and radius ratios (R2/R1 > 1). This suggests the necessity for further study involving larger samples to comprehensively understand the relationship between mass ratios and radii ratios of semi-detached binaries.
4.2. Long-term period variations
To investigate the evolutionary phases of these binaries, we analysed their orbital period variations and identified secular changes in the orbital periods of TIC 8677671, TIC 318217844, and TIC 406798603. As TIC 406798603 has already been studied in the work of Kim et al. (2022), we do not discuss it here. The cyclic oscillations of the orbital periods are observed in TIC 8677671 and TIC 318217844; however, a quadratic term is evident only in TIC 318217844 (Fig. 1). Mass transfer from the secondary star to the primary star results in an increase in the orbital period. Therefore, the observed decrease in the orbital period in TIC 318217844 can be attributed to the loss of mass and angular momentum.
For the late-type binaries, the cyclic oscillations of the orbital periods are generally explained by two mechanisms: magnetic activity cycles (Applegate 1992) or LITEs due to the presence of a third body (Irwin 1952). Applegate (1992) suggested that the observed amplitude of period modulation could come from the gravitational coupling mechanism caused by the cyclic magnetic activity. Therefore, the value of ΔP/P was computed according to the following equation (also see Yang et al. 2021):
![Mathematical equation: $$ \begin{aligned} {\triangle P \over P} = {A \times {\sqrt{2\left[1-\cos \left({{2\pi P} \over {P_{3}}}\right)\right]}}} \simeq {{2\pi A} \over {P_{3}}} , \end{aligned} $$](/articles/aa/full_html/2024/12/aa49699-24/aa49699-24-eq3.gif) (3)
(3)
where A is a12sini/c. For TIC 8677671, the two values of △P/P are approximately ∼2 × 10⁻⁵ and ∼1 × 10⁻⁵, consistent with the typical value of the magnetic activity mechanism. In TIC 318217844, △P/P ∼ 3 × 10⁻⁶ is slightly below the typical value of the magnetic activity mechanism. The magnetic activity mechanism is considered a plausible cause for the cyclic changes in orbital periods observed in both systems.
Another mechanism that causes the cyclic change in the orbital periods is the LITE via by the presence of the third body. Its mass function can be computed by the following equation:
 (4)
(4)
We computed the parameters for the third body using the programme provided by Zasche et al. (2009). The data was weighted according to their observing techniques; namely, visual observations were weighted with 1, photographic observations with 5, and CCD & Photoelectric observations with 10. The results show that the minimum mass, M3, of TIC 318217844 is about 0.42 M⊙ for the orbital inclination, i = 90°. Assuming that the third body is a main-sequence star, its luminosity is about 0.04 L⊙. Therefore, it is difficult to identify the third body due to the low luminosity. Since the third light was not found in orbital solutions, we tend to think the O–C change is caused by magnetic activity.
For TIC 8677671, cyclic changes were modelled with two eccentric orbits. One has an orbital period of about 97.9 yr and a projected semi-major axis of 22.3 AU, indicating a mass function of f(m3)=1.15 corresponding to a mass of about 2.97 M⊙ third body for the orbital inclination i = 90° in the system. The other has an orbital period of about 15.89 yr and a projected semi-major axis of 1.54 AU, indicating a mass function of f(m4) = 0.0145, corresponding to a mass of about 0.41 M⊙ body for the orbital inclination i = 90° in the system. The primary of TIC 8677671 is an F-type main-sequence star. The minimum mass of the third body is greater than the total mass of the TIC 8677671 system; that is, M3 > M1 + M2. If this third body lies on the main sequence, its luminosity should exceed that of the primary star in TIC 8677671, making it observable. However, spectral observations do not detect this object (Qian et al. 2008). When we treated the third light as a free parameter in the W-D code, the contribution of the third light was found to be about 6% of the total luminosity. Approximately 9 arcseconds away from TIC 8677671, there is a source (Gaia DR3 699818436453891072) with a brightness approximately four magnitudes fainter than that of TIC 8677671. TIC 8677671 is located at a distance of 276 pc, while the fainter source is located at a distance of 262 pc. Contaminated light from this source (Gaia DR3 699818436453891072) contributes roughly 3% to the overall luminosity (see Table 3). This suggests that the third body is invisible at optical wavelengths, implying that the unseen third body could be a stellar-mass black hole candidate. Additionally, a faint X-ray source (1RXS J090950.1+302514) located near TIC 8677671 was detected by ROSAT. It has a count rate of 0.016 ± 0.008 counts s−1 in the 0.1–2.4 keV energy band (Voges et al. 2000). The third companion may correspond to this weak X-ray source.
5. Conclusions
Semi-detached binaries are important to understand the binary evolution because they are the intermediate phase between the detached and the contact phases for close interacting binary stars. In this work, we have analysed eight semi-detached binaries by simultaneously modelling the light curves and RV curves with the help of the W-D programme. The absolute parameters in each binary have been clearly derived. Their structures and evolutionary states have also been studied. We also analysed the secular variation in the orbital periods of two systems. The results are summarised as follows:
-
All eight systems are semi-detached binaries with mass ratios ranging from 0.145 to 0.689. For TIC 0312060302, TIC 428257299, TIC 158431889, and TIC 159386347, their absolute parameters are provided in this work for the first time. For TIC 8677671 and TIC 168809669, their absolute parameters were calculated by simultaneously modelling the light curves and RV curves for the first time. Except for TIC 428257299, whose primary fills the Roche lobe, the other seven systems’ Roche lobes are filled by secondaries.
-
We have analysed the evolutionary states of both components of each system based on their absolute parameters. Except for TIC 428257299, the primary stars of the other systems are located in the main-sequence band, but the secondaries are all evolved away from the main-sequence band. This result indicates that they probably formed from originally detached binary systems and experienced mass-reverse evolution. The primary of TIC 428257299 fills its Roche lobe, and the companion star has undergone a process of mass loss.
-
The orbital periods of TIC 318217844 and TIC 8677671 show secular cyclic oscillations. The secular periodic changes in TIC 318217844 may be caused by magnetic activity. However, for TIC 8677671, the secular periodic changes may be caused by magnetic activity or a third body, which appears to be a compact object.
Data availability
Table B.1 is available at the CDS via anonymous ftp to cdsarc.cds.unistra.fr (130.79.128.5) or via https://cdsarc.cds.unistra.fr/viz-bin/cat/J/A+A/692/A168
Acknowledgments
The authors thank the anonymous referee for the very helpful suggestions. The work is supported by the National Key R&D Programme of China(2019YFA0405000), the Strategic Priority Research Programme of the Chinese Academy of Sciences (grant No. XDB41000000), Key Research Programme of Frontier Sciences, CAS (grant No. ZDBS-LY-SLH013), Frontier Scientific Research Programme of Deep Space Exploration Laboratory (2022-QYKYJH-ZYTS-016), and the National Natural Science Foundation of China (grant Nos. 12373111, 12350004 and 12273018). Guoshoujing Telescope (the Large Sky Area Multi-Object Fibre Spectroscopic Telescope LAMOST) is a National Major Scientific Project built by the Chinese Academy of Sciences. Funding for the project has been provided by the National Development and Reform Commission. LAMOST is operated and managed by the National Astronomical Observatories, Chinese Academy of Sciences.
References
- Alcock, C., Allsman, R. A., Alves, D., et al. 1997, AJ, 114, 326 [NASA ADS] [CrossRef] [Google Scholar]
- Applegate, J. H. 1992, ApJ, 385, 621 [Google Scholar]
- Armstrong, D. J., Gómez Maqueo Chew, Y., Faedi, F., & Pollacco, D. 2014, MNRAS, 437, 3473 [Google Scholar]
- Auvergne, M., Bodin, P., Boisnard, L., et al. 2009, A&A, 506, 411 [NASA ADS] [CrossRef] [EDP Sciences] [Google Scholar]
- Bayo, A., Rodrigo, C., Barrado Y Navascués, D., et al. 2008, A&A, 492, 277 [NASA ADS] [CrossRef] [EDP Sciences] [Google Scholar]
- Borucki, W. J., Koch, D., Basri, G., et al. 2010, Science, 327, 977 [Google Scholar]
- Bradstreet, D. H. 2005, Soc. Astron. Sci. Ann. Symp., 24, 23 [Google Scholar]
- Brancewicz, H. K., & Dworak, T. Z. 1980, Acta Astron., 30, 501 [NASA ADS] [Google Scholar]
- Budding, E. 1989, Space Sci. Rev., 50, 205 [NASA ADS] [CrossRef] [Google Scholar]
- Budding, E., Erdem, A., Çiçek, C., et al. 2004, A&A, 417, 263 [NASA ADS] [CrossRef] [EDP Sciences] [Google Scholar]
- Chen, X., Wang, S., Deng, L., de Grijs, R., & Yang, M. 2018, ApJS, 237, 28 [Google Scholar]
- Cui, X.-Q., Zhao, Y.-H., Chu, Y.-Q., et al. 2012, Res. Astron. Astrophys., 12, 1197 [Google Scholar]
- Doğruel, M. B., & Gürol, B. 2015, New A, 40, 20 [CrossRef] [Google Scholar]
- Eastman, J., Siverd, R., & Gaudi, B. S. 2010, PASP, 122, 935 [Google Scholar]
- Gaia Collaboration (Prusti, T., et al.) 2016, A&A, 595, A1 [NASA ADS] [CrossRef] [EDP Sciences] [Google Scholar]
- Gaia Collaboration (Vallenari, A., et al.) 2023, A&A, 674, A1 [NASA ADS] [CrossRef] [EDP Sciences] [Google Scholar]
- Hełminiak, K. G., Moharana, A., Pawar, T., et al. 2021, MNRAS, 508, 5687 [CrossRef] [Google Scholar]
- Hurley, J. R., Tout, C. A., & Pols, O. R. 2002, MNRAS, 329, 897 [Google Scholar]
- Husser, T. O., Wende-von Berg, S., Dreizler, S., et al. 2013, A&A, 553, A6 [NASA ADS] [CrossRef] [EDP Sciences] [Google Scholar]
- Ibano{\v{g}}lu, C., Soydugan, F., Soydugan, E., & Dervişo{\v{g}}lu, A. 2006, MNRAS, 373, 435 [NASA ADS] [CrossRef] [Google Scholar]
- Irwin, J. B. 1952, ApJ, 116, 211 [Google Scholar]
- Irwin, J. B. 1959, AJ, 64, 149 [Google Scholar]
- Jayasinghe, T., Stanek, K. Z., Kochanek, C. S., et al. 2019, MNRAS, 485, 961 [Google Scholar]
- Jayasinghe, T., Kochanek, C. S., Stanek, K. Z., et al. 2020, VizieR Online Data Catalog: II/366 [Google Scholar]
- Jenkins, J. M., Caldwell, D. A., Chandrasekaran, H., et al. 2010, ApJ, 713, L87 [Google Scholar]
- Jenkins, J. M., Twicken, J. D., McCauliff, S., et al. 2016, SPIE Conf. Ser., 9913, 99133E [Google Scholar]
- Kim, S. L., Lee, J. W., Kwon, S. G., et al. 2003, A&A, 405, 231 [NASA ADS] [CrossRef] [EDP Sciences] [Google Scholar]
- Kim, H.-Y., Hong, K., Kim, C.-H., et al. 2022, AJ, 164, 216 [NASA ADS] [CrossRef] [Google Scholar]
- Koleva, M., Prugniel, P., Bouchard, A., & Wu, Y. 2009, A&A, 501, 1269 [CrossRef] [EDP Sciences] [Google Scholar]
- Kopal, Z. 1959, Close Binary Systems (London: Chapman& Hall) [Google Scholar]
- Kreiner, J. M. 2004, Acta Astron., 54, 207 [NASA ADS] [Google Scholar]
- Lee, J. W., Hong, K., Kim, H.-Y., et al. 2024, PASJ, 76, 118 [NASA ADS] [CrossRef] [Google Scholar]
- Li, K., Gao, X., Liu, X.-Y., et al. 2022, AJ, 164, 202 [NASA ADS] [CrossRef] [Google Scholar]
- Liakos, A. 2018, A&A, 616, A130 [NASA ADS] [CrossRef] [EDP Sciences] [Google Scholar]
- Liakos, A., & Niarchos, P. 2012, New A, 17, 634 [NASA ADS] [CrossRef] [Google Scholar]
- Liu, N., Fu, J.-N., Zong, W., et al. 2019, Res. Astron. Astrophys., 19, 075 [CrossRef] [Google Scholar]
- Lucy, L. B. 1967, Z. Astrophys., 65, 89 [Google Scholar]
- Luo, A. L., Zhang, H.-T., Zhao, Y.-H., et al. 2012, Res. in Astron. Astrophys., 12, 1243 [CrossRef] [Google Scholar]
- Lurie, J. C., Vyhmeister, K., Hawley, S. L., et al. 2017, AJ, 154, 250 [Google Scholar]
- Malkov, O. Y. 2020, MNRAS, 491, 5489 [NASA ADS] [CrossRef] [Google Scholar]
- Manzoori, D. 2015, Ap&SS, 357, 43 [NASA ADS] [CrossRef] [Google Scholar]
- Martin, D. C., Fanson, J., Schiminovich, D., et al. 2005, ApJ, 619, L1 [Google Scholar]
- McLaughlin, D. B. 1924, ApJ, 60, 22 [Google Scholar]
- Merle, T., Van Eck, S., Jorissen, A., et al. 2017, A&A, 608, A95 [NASA ADS] [CrossRef] [EDP Sciences] [Google Scholar]
- Mortensen, D., Eisner, N., IJspeert, L., Kochoska, A., & Prsa, A. 2021, Am. Astron. Soc. Meeting Abstr., 53, 530.01 [Google Scholar]
- Paegert, M., Stassun, K. G., Collins, K. A., et al. 2021, arXiv e-prints [arXiv:2108.04778] [Google Scholar]
- Park, J.-H., Hong, K., Koo, J.-R., Lee, J. W., & Kim, C.-H. 2018, AJ, 155, 133 [NASA ADS] [CrossRef] [Google Scholar]
- Paschke, A., & Brat, L. 2006, Open Eur. J. Var. Stars, 23, 13 [NASA ADS] [Google Scholar]
- Pols, O. R. 1994, A&A, 290, 119 [Google Scholar]
- Prša, A., Batalha, N., Slawson, R. W., et al. 2011, AJ, 141, 83 [Google Scholar]
- Prugniel, P., & Soubiran, C. 2001, A&A, 369, 1048 [CrossRef] [EDP Sciences] [Google Scholar]
- Prugniel, P., Soubiran, C., Koleva, M., & Le Borgne, D. 2007, arXiv e-prints [arXiv:astro-ph/0703658] [Google Scholar]
- Qian, S. B., Liao, W. P., & Fernández Lajús, E. 2008, ApJ, 687, 466 [NASA ADS] [CrossRef] [Google Scholar]
- Qian, S. B., Liu, N. P., Li, K., et al. 2013, ApJS, 209, 13 [NASA ADS] [CrossRef] [Google Scholar]
- Qian, S. B., Zhang, J., He, J. J., et al. 2018, ApJS, 235, 5 [NASA ADS] [CrossRef] [Google Scholar]
- Ricker, G. R., Winn, J. N., Vanderspek, R., et al. 2015, J. Astron. Telesc. Instrum. Syst., 1, 014003 [Google Scholar]
- Rossiter, R. A. 1924, ApJ, 60, 15 [Google Scholar]
- Rucinski, S. 1969, Postepy Astronomii Krakow, 17, 3 [NASA ADS] [Google Scholar]
- Samus’, N. N., Kazarovets, E. V., Durlevich, O. V., Kireeva, N. N., & Pastukhova, E. N. 2017, Astron. Rep., 61, 80 [Google Scholar]
- Skrutskie, M. F., Cutri, R. M., Stiening, R., et al. 2006, AJ, 131, 1163 [NASA ADS] [CrossRef] [Google Scholar]
- Slawson, R. W., Prša, A., Welsh, W. F., et al. 2011, AJ, 142, 160 [Google Scholar]
- Soydugan, E., Soydugan, F., Demircan, O., & {\.{I}}bano{\v{g}}lu, C. 2006, MNRAS, 370, 2013 [NASA ADS] [CrossRef] [Google Scholar]
- Soydugan, F., Soydugan, E., & Aliçavuş, F. 2020, Res. Astron. Astrophys., 20, 052 [CrossRef] [Google Scholar]
- Stassun, K. G., Oelkers, R. J., Paegert, M., et al. 2019, AJ, 158, 138 [Google Scholar]
- Svechnikov, M. A., & Kuznetsova, E. F. 1990, Katalog priblizhennykh fotometricheskikh i absoliutnykh elementov zatmennykh peremennykh zvezd (Sverdlovsk: Izd-vo Ural’skogo universiteta) [Google Scholar]
- Svechnikov, M. A., & Kuznetsova, E. F. 2004, VizieR Online Data Catalog: V/124 [Google Scholar]
- van Hamme, W. 1993, AJ, 106, 2096 [Google Scholar]
- Voges, W., Aschenbach, B., Boller, T., et al. 2000, IAU Circ., 7432, 3 [NASA ADS] [Google Scholar]
- Watson, C. L., Henden, A. A., & Price, A. 2006, Soc. Astron. Sci. Ann. Symp., 25, 47 [NASA ADS] [Google Scholar]
- Wilson, R. E. 1979, ApJ, 234, 1054 [Google Scholar]
- Wilson, R. E., & Devinney, E. J. 1971, ApJ, 166, 605 [Google Scholar]
- Wilson, R. E., & Van Hamme, W. 2014, ApJ, 780, 151 [Google Scholar]
- Wright, E. L., Eisenhardt, P. R. M., Mainzer, A. K., et al. 2010, AJ, 140, 1868 [Google Scholar]
- Wu, Y., Luo, A. L., Li, H.-N., et al. 2011, Res. Astron. Astrophys., 11, 924 [Google Scholar]
- Wu, Y., Du, B., Luo, A., Zhao, Y., & Yuan, H. 2014, Stat. Challenges, 306, 340 [NASA ADS] [Google Scholar]
- Xiang, M., Rix, H.-W., Ting, Y.-S., et al. 2022, A&A, 662, A66 [NASA ADS] [CrossRef] [EDP Sciences] [Google Scholar]
- Yang, Y.-G., Wang, S., Yuan, H.-Y., & Dai, H.-G. 2021, Res. Astron. Astrophys., 21, 290 [CrossRef] [Google Scholar]
- Yi, T., Gu, W.-M., Zhang, Z.-X., et al. 2022, Nat. Astron., 6, 1203 [NASA ADS] [CrossRef] [Google Scholar]
- Zasche, P., Liakos, A., Niarchos, P., et al. 2009, New A, 14, 121 [NASA ADS] [CrossRef] [Google Scholar]
- Zhang, X. B., Luo, Y. P., & Wang, K. 2015, AJ, 149, 96 [NASA ADS] [CrossRef] [Google Scholar]
- Zhang, X. B., Fu, J. N., Liu, N., Luo, C. Q., & Ren, A. B. 2017, ApJ, 850, 125 [NASA ADS] [CrossRef] [Google Scholar]
- Zong, W., Fu, J.-N., De Cat, P., et al. 2020, ApJS, 251, 15 [NASA ADS] [CrossRef] [Google Scholar]
- Zwitter, T., Munari, U., Marrese, P. M., et al. 2003, A&A, 404, 333 [NASA ADS] [CrossRef] [EDP Sciences] [Google Scholar]
Appendix A: Light and RV curves of five single-lined eclipsing binaries.
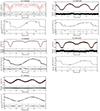 |
Fig. A.1. Light and RV curves of TIC 0312060302, TIC 428257299, TIC 168809669, TIC 158431889 and TIC 159386347. The solid lines are theoretical fits from the W-D programme. The residuals from theoretical representation are also shown. |
Appendix B: Radial velocities of the eight binaries
Table B.1 provides the RVs of the eight binaries and is available at the CDS.
All Tables
Information of spots in the best-fitting model. The errors were determined through visual inspection of their effects on the light curve.
All Figures
|
Fig. 1. O–C diagrams of TIC 8677671 and TIC 318217844 with LITE ephemeris. |
| In the text | |
|
Fig. 2. Single-model fit for the broadband SEDs of the eight targets. The red dots represent photometric fluxes from various bands, as is indicated and labelled by the vertical grey lines. The blue curve shows the best-fit Kurucz SED with interstellar dust extinction corrected. The blue diamonds represent the best-fit synthetic photometric fluxes. The lower sub-panel shows the relative residuals, defined as (observed flux – synthetic flux) divided by the observed flux. |
| In the text | |
|
Fig. 3. Light and RV curves of TIC8677671 and TIC 318217844. The solid lines are theoretical fits from the W-D programme. The residuals from theoretical representation are also shown. |
| In the text | |
|
Fig. 4. Light and RV curves of TIC406798603. The circles and triangles represent the RV measurements from this study and from Kim et al. (2022), respectively. The solid curves were derived from the light and RV solutions using the W-D programme. |
| In the text | |
|
Fig. 5. M-L and M-R relations of the eight systems. The primaries and the secondaries are represented by filled and open symbols, respectively. The ZAMS and the TAMS obtained using the binary star evolution code from Hurley et al. (2002) are described with solid and dashed black lines. |
| In the text | |
|
Fig. A.1. Light and RV curves of TIC 0312060302, TIC 428257299, TIC 168809669, TIC 158431889 and TIC 159386347. The solid lines are theoretical fits from the W-D programme. The residuals from theoretical representation are also shown. |
| In the text | |
Current usage metrics show cumulative count of Article Views (full-text article views including HTML views, PDF and ePub downloads, according to the available data) and Abstracts Views on Vision4Press platform.
Data correspond to usage on the plateform after 2015. The current usage metrics is available 48-96 hours after online publication and is updated daily on week days.
Initial download of the metrics may take a while.