| Issue |
A&A
Volume 681, January 2024
|
|
|---|---|---|
| Article Number | A5 | |
| Number of page(s) | 8 | |
| Section | Celestial mechanics and astrometry | |
| DOI | https://doi.org/10.1051/0004-6361/202347643 | |
| Published online | 20 December 2023 | |
Advantages of combining Lunar Laser Ranging and Differential Lunar Laser Ranging
Leibniz University Hannover, Institute of Geodesy (IfE),
Schneiderberg 50,
30167
Hannover,
Germany
e-mail: zhang@ife.uni-hannover.de
Received:
2
August
2023
Accepted:
10
October
2023
Context. Differential Lunar Laser Ranging (DLLR), which is planned to be conducted at Table Mountain Observatory (TMO) of Jet Propulsion Laboratory (JPL) in the future, is a novel technique for tracking to the Moon. This technique has the potential to determine the orientation, rotation, and interior of the Moon much more accurately if the expected high accuracy of about 30 μm can be achieved.
Aims. We focus on the benefit for the related parameters when only DLLR data with a short time span are available in the beginning.
Methods. A short DLLR time series is not enough to provide an accurate lunar orbit, which has a negative effect on parameter estimation. Fortunately, Lunar Laser Ranging (LLR) has been collecting data for a very long time span, which can be used to compensate this DLLR disadvantage. The combination of LLR data (over more than 50 yr) and simulated DLLR data over a relatively short time span (e.g., 5 or 10 yr) is used in different cases which include changing reflector baselines and extending data time span, along with adding more stations and “new” reflectors.
Results. The results show that the estimated accuracies of the parameters related to the lunar orientation, rotation, and interior can be improved by about 5–100 times by simply adding 5-yr DLLR data in the combination. With LLR, further enhancing the parameter determination can be achieved by choosing appropriate reflector baselines. By investigating different scenarios of reflector baselines based on the present five reflectors on the Moon, we find that two crossing baselines with larger lengths offer the greatest advantage. A longer data time span is more helpful, rather than having more stations involved in the measurement within a shorter time span, assuming the amount of data in these two cases is the same. Furthermore, we evaluated the preferred position of an assumed new reflector.
Key words: Moon / astrometry / celestial mechanics / methods: data analysis
© The Authors 2023
 Open Access article, published by EDP Sciences, under the terms of the Creative Commons Attribution License (https://creativecommons.org/licenses/by/4.0), which permits unrestricted use, distribution, and reproduction in any medium, provided the original work is properly cited.
This article is published in open access under the Subscribe to Open model. Subscribe to A&A to support open access publication.
1 Introduction
Lunar Laser Ranging (LLR) has a very long history, spanning more than 50 yr, of lunar tracking by measuring the round-trip travel time (multiplying with the speed of light to get the range) between an Earth station and a retroreflector (hereafter, just called a reflector) on the Moon (Müller et al. 2019; Hofmann 2017; Biskupek 2015). It benefits some research fields, for example, the calculation of the lunar ephemeris (Park et al. 2021; Pavlov 2020; Fienga et al. 2019, 2014; Bourgoin et al. 2015; Folkner et al. 2014), the determination of the Earth orientation parameters (Biskupek et al. 2022; Singh et al. 2022; Biskupek 2015; Biskupek & Müller 2009; Zerhouni & Capitaine 2009), the investigation of the lunar interior (Williams et al. 2014), and testing the Einstein’s relativity theory, such as the equivalence principle (Biskupek et al. 2021; Zhang et al. 2020; Hofmann & Müller 2018; Viswanathan et al. 2018; Müller et al. 2012; Williams et al. 2012).
Compared to LLR, an advanced LLR technique, known as Differential Lunar Laser Ranging (DLLR), which is to be conducted at Table Mountain Observatory (TMO) in the future, is intended to provide some possible advantages on the measurement process and lunar science. By using a high-power continuous-wave (CW) laser, the number of received photons is expected to increase substantially. The DLLR observation is a new kind of lunar measurement, namely, differenced lunar ranges (hereafter known as range difference), which is obtained by differencing the ranges for different reflectors tracked by the same station within a short time interval. This differential nature is envisaged to greatly reduce the Earth’s atmospheric error to make the accuracy of DLLR (range difference) reach an outstanding level of about 30 µm (which represents the Earth atmospheric limit by a factor of about 200 better than what is currently possible for LLR). As an error source with a large impact, the Earth’s atmosphere limits the LLR (range) accuracy, imposing a limit of about 5 mm for current LLR (Turyshev et al. 2021, 2018; Dehant et al. 2017). Presently, without so many DLLR technical details available, the judgement of the DLLR feasibility is not possible. Thus, the current specifications mentioned in Turyshev et al. (2021, 2018) and Dehant et al. (2017) are used as a given for the investigation of the potential benefits of DLLR.
By using the same long data time span (more than 50 yr) as LLR, the parameters related to the lunar orientation, rotation, and interior have been investigated using the simulated DLLR data from our previous research (Zhang et al. 2022). It has been shown that their estimated accuracies can really be improved largely, by about two orders of magnitude, if DLLR can indeed reach the high observation accuracy that is expected for it. Furthermore, using highly accurate DLLR data in Zhang et al. (2022), the lunar orbit can be determined at a similarly good level as via LLR.
However, when real DLLR data become available in the future, their data time span will be short in the beginning, making them insufficient with respect to determining the lunar orbit very well. Thus, in order to compensate this deficiency and avoid its possible negative effect on DLLR’s advantage for lunar science, it is a viable option to combine DLLR and LLR, which can offer an accurate lunar orbit due to its data being collected over a very long time span. In this study, LLR and DLLR data are combined in different cases by varying reflector baselines, stations, time spans, and reflectors to investigate their effects on the estimation of the parameters related to the lunar orientation, lunar rotation, and interior.
In Sect. 2, we present the method for combining the data. Section 3 gives the results from the combined data. Our summary and outlook are given in Sect. 4.
2 Data combination method
The parameters are estimated by using the least-squares adjustment with Gauss-Markov model (Niemeier 2001). The combination of LLR and DLLR normal equations can be expressed as (Wu 2016; Bloßfeld 2015; Seitz 2015; Böckmann et al. 2010; Koch & Kusche 2002)
 (1)
(1)


where the variance factor σ2 is relevant to the weighting of the different LLR and DLLR data in the combination; A, P, and l are the design matrix, weight matrix, and the matrix that includes the differences between the observations and their computed values; n1, n2, and m are the numbers of the LLR observations, DLLR observations and estimated parameters x; Δx includes the corrections of the estimated parameters.
Finally, after combination, the adjusted variance-covariance matrix of the parameters can be calculated as:
 (4)
(4)
where  and
and  are the posterior variance factors of LLR and DLLR. Furthermore, the standard deviations of the parameters, namely, the square roots of the diagonal elements of
  in Eq. (4) are used as the estimated accuracies of the parameters obtained in the cases using combined LLR and DLLR data in Sects. 3.1–3.3. The parameter accuracies attained by only using LLR data in Sect. 3.1 are the standard deviations of the parameters, which are calculated in the individual analysis of LLR.
3 Scenarios of LLR and DLLR combination
An LLR station transmits laser pulses to a reflector on the Moon and receives the reflected signal. A round-trip travel time, τ is obtained. Multiplied by the speed of light, c, the measured range, ρ, between the station and the reflector is approximated using (Biskupek 2015; Müller et al. 2014)
 (5)
(5)
The computed distance, ρc, modeled in the LLR analysis software LUNAR (Müller et al. 2019; Biskupek 2015) is:
 (6)
(6)
where rsta_t1, rsta_t3, and rsta_t2 are the positions of the station, initially given in the International Terrestrial Reference System (ITRS), at the transmitting and receiving times as well as of the reflector, initially given in selenocentric Principal Axis System (PAS), at the reflection time using the Barycentric Celestial Reference System (BCRS) as the coordinate system and Barycentric Dynamical Time (TDB) as time system (Park et al. 2021; Folkner et al. 2014; Petit & Luzum 2010); Δd is the sum of the range corrections resulting from the Shapiro time delay (Moyer 1971; Shapiro 1964), Earth’s atmospheric delay (Petit & Luzum 2010; Mendes & Pavlis 2004; Mendes et al. 2002), solar radiation and thermal-force effects (Vokrouhlickỳ 1997), the time transformation between Terrestrial Time and TDB, and the station biases (Hofmann 2017; Biskupek 2015).
The LLR data used in the following sections include the real and simulated ones. The 28093 real data points1 covering more than 50 yr (04.1970–03.2021) were collected by six observatories to five lunar reflectors (denoted as A11, A14, A15, L1 and L2) deployed by the Apollo 11, 14, and 15 and Luna 17 and 21 missions (Murphy 2013). The observatories are the McDonald Laser Ranging Station (MLRS) conducting LLR at three stations (denoted as McDonald, MLRS1 and MLRS2), which are very close to each other (Hofmann 2017), the Lunar Ranging Experiment Observatory (LURE; Müller et al. 2019), the Apache Point Observatory Lunar Laser ranging Operation (APOLLO; Murphy et al. 2008), the Observatoire de la Côte d’Azur (OCA; Courde et al. 2017), the Wettzell Laser Ranging System (WLRS; Schreiber et al. 2019) and the Matera Laser Ranging Observatory (MLRO; Dequal et al. 2021). More details on the real LLR data, for instance, the data accuracy, can be found in Zhang et al. (2022). The simulated LLR data (Zhang 2023) were generated by a simulation program (Hofmann 2017) as one component of the LUNAR software, using the range model of Eq. (6) with white noise added.
A DLLR station tracks the first reflector to obtain the first range measurement, denoted as ρref1. After a short time interval, another range, ρref2, to the second reflector is measured by the same station. Thus, DLLR data were simulated by the difference ∆ρ of the ranges (based on the range model used in LUNAR) to the two reflectors with white noise ɛ added (Zhang et al. 2022):
 (7)
(7)
More details of the DLLR measurement process and simulation can be found in Zhang et al. (2022).
For the DLLR data (Zhang 2023) in each case of the combined data in the following sections, its data distribution, data amount, time span, and the relevant stations are assumed to be the same as those of the simulated LLR data group in the same case. The time interval of 1.5 min is used as the difference between the two epochs for the two reflectors (composing a reflector baseline) of a DLLR measurement. The epoch for tracking the first reflector in a DLLR measurement is kept the same as the measurement epoch in the simulated LLR data. The DLLR accuracy is assumed with 200-fold the one-way range accuracy of the simulated LLR data.
The LLR and DLLR data are combined based on the variation of the reflector baselines (given in Sect. 3.1), adding stations and extending time spans from Sect. 3.2, as well as assuming “new” reflectors, described in Sect. 3.3. The investigated parameters relating to the lunar orientation, rotation and interior are involved in the transformation between the PAS and BCRS for reflector coordinates, including the three initial lunar orientation parameters (ϕm0, θm0, ψm0), at Julian Date (JD) 2440400.5 in rad, the initial angular velocity of the lunar mantle (ωmx0, ωmy0, ωmz0), and core (ωcx0, ωcy0, ωcz0) at JD 2440400.5 in rad s−1, the friction coefficient between the lunar core and mantle kυc in rad day−1 and the oblateness of the lunar core fc (Park et al. 2021; Biskupek 2015; Folkner et al. 2014).
Basic information of the simulated LLR and DLLR data in cases 1–4.
3.1 Reflector baselines
We used four groups of combined LLR and DLLR data. In these four cases (i.e., cases 1–4), the LLR data – namely, the real LLR data mentioned above and 8480 simulated LLR data points from stations LURE, WLRS, OCA, MLRS2, APOLLO, and MLRO for the reflectors A11, A14, A15, L1, and L2 over the 5-yr time span from 01.04.2021 to 31.03.2026 (following the time span of the used real LLR data) – are common, while the DLLR data vary due to the used reflector baselines. To keep the simulation close to reality, the same as the real LLR data, most of the simulated LLR data are taken from the OCA station. In addition, for each station, the simulated LLR data accuracy is given according to the real LLR data of the last few years of the measurement period of this station. As shown in Table 1, for the simulated DLLR data in case 1, the reflector baselines are generated by randomly combining the present five reflectors on the Moon, namely, A11, A14, A15, L1, and L2. Five shorter baselines, namely, A15-A14, A15-L1, A15-A11, A15-L2, and A11-L2, are used in the DLLR simulation in case 2 (see Fig. 1), while five longer ones, namely, L1-A11, L1-L2, A14-L2, L1-A14, and A14-A11, are used in case 3 (see Fig. 2). The two crossing baselines of L1-A11 and A14-L2 in case 4 are shown in Fig. 3.
Table 2 presents the estimated accuracies of the parameters obtained from the LLR data (real and simulated ones), represented by AccLLR, and from the data of case 1 (combination of LLR and DLLR data), represented by Acccase1. The parameter accuracy ratios are calculated as  . If the ratio is larger than 1, the parameter accuracy evaluated from the data of case 1 is higher. Moreover, the larger the value of the ratio, the bigger the accuracy improvement of the parameters acquired from case 1. The estimated accuracies of all the parameters are improved in case 1, by about 5–100 times the accuracies estimated by LLR. Even when using only 8480 DLLR data points over a short time span (i.e., 5 yr), significant results are obtained via the combination with LLR. Similar conclusions can be drawn by comparing the results of the LLR data with the combined data of the other cases (i.e., cases 2–4). Different combinations of the reflector baselines will have an effect on the parameter estimation. Taking case 1 as the reference case, Table 3 shows the parameter accuracy ratios which are calculated as
  , where Acccase1, j = 2, 3, 4 are the parameter accuracies attained in cases 2–4. If the ratio is larger or smaller than 1, the parameter accuracy is higher or lower than obtained in case 1. All parameters are estimated worse when the baseline constellation of case 2 is used. However, by using that of case 3, the estimation of all the parameters is enhanced. It means that the five longer baselines (case 3) are more beneficial for the estimation of these parameters than the five shorter baselines (case 2). Compared to case 3, case 4 gives an even better result, although only two crossing baselines L1-A11 and A14-L2 are involved in DLLR. However, the longer baselines in case 3 include L1-A11 and A14-L2, as well as other three baselines that are more longitudinal or latitudinal. Thus, from these four cases, the length and the way of the constellation of the baselines are two factors which have an effect on the estimation of these parameters. The best choice for investigating lunar orientation, rotation and interior is the use of the longer crossing baselines L1-A11 and A14-L2.
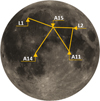 |
Fig. 1 Short reflector baselines in case 2. |
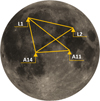 |
Fig. 2 Long reflector baselines in case 3. |
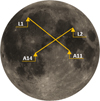 |
Fig. 3 Crossing reflector baselines in case 4. |
3.2 Time spans and stations
Two groups of combined data are considered in two cases, “case-t” and “case-sta”. The real LLR data used is still the same as in Sect. 3.1. As shown in Table 4, in “case-t”, both the time spans of the simulated LLR and DLLR data are extended from 5 to 10 yr, namely, 01.04.2021 to 31.03.2031. The simulated LLR and DLLR datasets still have the same amount of data points, namely, 16946. The other conditions related to the simulation are kept the same as those in the reference case (case 1 described in Sect. 3.1). In “case-sta”, two more stations are included in the simulation of LLR and DLLR data for a 5-yr time span from 01.04.2021 to 31.03.2026. As shown in Fig. 4, the two stations denoted as HARL at Hartebeesthoek in South Africa and STL3 at Mount Stromlo in Australia (Hofmann 2017; Biskupek 2015) are in the southern hemisphere. 8466 simulated LLR data points for these two stations for reflectors A11, A14, A15, L1, and L2 were taken with the assumed accuracy according to the OCA’s simulated LLR data in Sect. 3.1. The same amount of DLLR data of these two stations were simulated for the reflector baselines from the random combination of A11, A14, A15, L1, and L2 (see Table 4). As in Sect. 3.1, the DLLR data accuracy is still assumed 200-fold the accuracy of the one-way range of the simulated LLR data from the two stations. Finally, the combined LLR and DLLR data in “case-sta” are those of case 1 of Sect. 3.1 added by the simulated LLR and DLLR data from HARL and STL3.
Table 5 shows the parameter accuracy ratios which are calculated by  and
and  , where Acccase–t and Acccase–sta are the estimated accuracies of the parameters obtained in “case-t” and “case-sta”. Comparing with case 1, either by extending the data time span or adding more stations over a short time period, the parameter accuracies are improved. For different parameters, extending the data time span (“case-t”) has different effects. Taking the x-component of the angular velocity of the lunar mantle, ωmx0, and the oblateness of the lunar core, ƒc, the former one is improved the most, about 14.7-fold the accuracy of case 1, while the latter one only about 2.1-fold. However, when adding more stations (“case-sta”), the accuracy improvements of all the parameters are very close to each other. It should be noted that the same total amount of data is used in both cases. All the parameters are better determined in “case-t” than in “case-sta”. Thus, extending the time span is more helpful.
3.3 “New” reflectors
As shown in Fig. 5, three more reflectors, M4, M5, and M6, are assumed in the LLR and DLLR simulation in order to find a position which is more beneficial for the investigated parameters. As the real reflectors distribute around the equator and the northern hemisphere of the moon at present and a wider spread of reflectors is more helpful for the orientation and rotation parameters (Turyshev et al. 2021), M4, M5, and M6 are assumed to be at the edge in different directions. Their latitudes and longitudes are given in Table 6. Three cases are defined, called “case-M4”, “case-M5”, and “case-M6”. The real LLR data used in these three cases are the same as those used in Sect. 3.1. As shown in Table 7, for the simulated LLR and DLLR data, the involved reflectors in each case are the five real reflectors on the Moon at the moment (i.e., A11, A14, A15, L1 and L2) and one “new” reflector. For example, the reflectors of the LLR simulation in “case-M4” are A11, A14, A15, L1, and L2 as well as M4. Also, the reflector baselines in the DLLR simulation in “case-M4” are generated by the random combination of these six reflectors. Compared to the reference case (case 1 described in Sect. 3.1), the other simulation conditions are kept the same, for instance, in terms of the stations used, time period, amount of data, and so on.
The parameter accuracy ratios shown in Table 8 are calculated by  ,
,  , and
, and  , where Acccase–M4, Acccase–M5, and Acccase–M6 are the accuracies of the parameters estimated in “case-M4”, “case-M5”, and “case-M6”. The parameter accuracies in “case-M4” are improved or kept almost the same (only slightly worse for some parameters) compared to the results of the reference case. In “case-M6”, more parameters got a better accuracy compared to “case-M4” and “case-M5”, except the parameters related to the angular velocity of the lunar mantle (ωmx0, ωmy0, ωmz0). Furthermore, the estimated accuracy of ωmz0 in “case-M6” is the worst of these three cases and worse than that obtained by the reference case. More high correlations (equivalent to or higher than 50%) of ωmz0 with other parameters is a possible reason. In the reference case, “case-M4” and “case-M5”, ωmz0 exhibits a high correlation with some coefficients of the lunar gravity field (i.e., C22 and C33) and βL, which is a ratio of the undistorted total moments of inertia of the Moon. In “case-M6”, in addition to the high correlation with these parameters, further ones include ωmx0, θm0, and another coefficient of the lunar gravity field C32. When comparing to the reference case, only “case-M5” improves the estimation of all the parameters. Furthermore, for those parameters which do not attain the best accuracy in “case-M5”, there is no big difference between their estimated accuracies in “case-M5” and their best accuracies obtained by one of the other two cases. Thus, we can conclude: when adding a new reflector to improve the estimation of the studied parameters, M5 will be most beneficial.
Parameter accuracies obtained by using the LLR and data of case 1 as well as their parameter accuracy ratios.
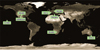 |
Fig. 4 Positions of the stations used in “case-sta”. |
Parameter accuracy ratios for cases 2–4 compared with case 1.
Basic information of the simulated LLR and DLLR data in “case-t” and “case-sta”.
Parameter accuracy ratios for “case-t” and “case-sta” compared with case 1.
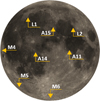 |
Fig. 5 Positions of the reflectors used in “case-M4”, “case-M5”, and “case-M6”. |
Longitudes and latitudes of the assumed new reflectors M4, M5, and M6 on the Moon.
4 Summary and outlook
The novel lunar laser ranging technique, Differential Lunar Laser Ranging (DLLR) is characterized by differencing the ranges measured by one station to different retroreflectors on the Moon. It is expected to have a very high observation accuracy (~30 µm) and can contribute a great deal to improving our understanding of the lunar orientation, rotation, and interior (Turyshev et al. 2021, 2018; Dehant et al. 2017). When solely DLLR data over short time span are available in the beginning, we can combine them with Lunar Laser Ranging (LLR) to exploit the DLLR advantage for the lunar science. This process can benefit from the accurate lunar orbit of LLR with its very long time span. Compared to the results attained by using only LLR data, the parameters related to the lunar orientation, rotation, and interior have already been greatly improved even by using 5-yr 8480 DLLR data points in the combination. In particular, the oblateness of the lunar core can be estimated with an enhanced accuracy of about two orders of magnitude. Further improvements can be obtained by using a better constellation of reflector baselines. Based on the current five reflectors (i.e., A11, A14, A15, L1, and L2) on the Moon, the reflector baselines L1-A11 and A14-L2, which are longer in length and exhibit a crossing shape, provide the biggest benefit. The parameter estimation can also be enhanced by having a longer data time span or involving more stations in the measurement over a short time span. Under the assumption of the same amount of data used in these two cases, the investigated parameters are improved most when the data time span is longer. For the studied parameters, it is better to distribute data over a longer time span instead of concentrating on a shorter time span. Another way for improvement can be achieved by adding more reflectors. Here, a preferred reflector position has been identified.
Further research on using DLLR can be performed at various levels. With respect to the constellation of the stations, reflectors and reflector baselines, more combinations could be studied using certain optimization strategies to determine an improved constellation for a better parameter estimation. With respect to further parameters, the effect of the LLR and DLLR combination on the Earth’s orientation and in relativity tests can be studied. In the future, a novel kind of reflector (a single corner-cube with a wide aperture) will be deployed on the Moon. It is expected to solve the problem for the present LLR reflector, namely, the spread of distances from different corner-cubes on the current lunar reflector array (Ciocci et al. 2017; Turyshev et al. 2013; Garattini et al. 2013; Currie et al. 2011). Its effect on the LLR and DLLR combination and the comparison between this new kind of reflector and the traditional LLR reflectors can be investigated. Another issue is the modelling of the atmosphere at the level of about 30 µm. Since the behavior is turbulent, it will probably require adaptive optics techniques (Merkle 1992) to overcome this problem. In addition to DLLR, we planned to investigate another advanced technique related to the Moon, that is, studying the use of optical clocks on the Moon for linking Earth-bound clocks as well as for enhanced lunar science.
Basic information of the simulated LLR and DLLR data in “case-M4”, “case-M5”, and “case-M6”.
Parameter accuracy ratios for “case-M4”, “case-M5”, and “case-M6” compared with case 1.
Acknowledgements
Current LLR data were collected, archived, and distributed under the auspices of the International Laser Ranging Service (ILRS; Pearlman et al. 2019). We acknowledge with thanks that since 1969 LLR data has been obtained under the efforts of the personnel at the McDonald Observatory in Texas, USA, the LURE Observatory in Maui, Hawaii, USA, the Observatoire de la Côte d’Azur in France, the Wettzell Laser Ranging System in Germany, the Matera Laser Ranging station in Italy and the Apache Point Observatory in New Mexico, USA. The authors would like to acknowledge the Deutsche Forschungsgemeinschaft (DFG, German Research Foundation) under Germany’s Excellence Strategy-EXC-2123 QuantumFrontiers – Project-ID 390837967 and the SFB 1464 TerraQ – Project-ID 434617780.
References
- Biskupek, L. 2015, PhD Thesis, Leibniz Universitat Hannover, Germany [Google Scholar]
- Biskupek, L., & Müller, J. 2009, in Proceedings of the 16th International Workshop on Laser Ranging, Poznan, Poland [Google Scholar]
- Biskupek, L., Müller, J., & Torre, J.-M. 2021, Universe, 7, 34 [NASA ADS] [CrossRef] [Google Scholar]
- Biskupek, L., Singh, V. V., & Müller, J. 2022, in Geodesy for a Sustainable Earth (Springer) [Google Scholar]
- Bloßfeld, M. 2015, PhD Thesis, Technische Universität München, Germany [Google Scholar]
- Böckmann, S., Artz, T., & Nothnagel, A. 2010, J. Geodesy, 84, 201 [CrossRef] [Google Scholar]
- Bourgoin, A., Le Poncin-Lafitte, C., Bouquillon, S., Francou, G., & Angonin, M.-C. 2015, in SF2A-2015: Proceedings of the Annual meeting of the French Society of Astronomy and Astrophysics, 111 [Google Scholar]
- Ciocci, E., Martini, M., Contessa, S., et al. 2017, Adv. Space Res., 60, 1300 [NASA ADS] [CrossRef] [Google Scholar]
- Courde, C., Torre, J., Samain, E., et al. 2017, A&A, 602, A90 [NASA ADS] [CrossRef] [EDP Sciences] [Google Scholar]
- Currie, D., Dell’Agnello, S., & Delle Monache, G. 2011, Acta Astronaut., 68, 667 [NASA ADS] [CrossRef] [Google Scholar]
- Dehant, V., Park, R., Dirkx, D., et al. 2017, Space Sci. Rev., 212, 1433 [NASA ADS] [CrossRef] [Google Scholar]
- Dequal, D., Agnesi, C., Sarrocco, D., et al. 2021, J. Geodesy, 95, 26 [NASA ADS] [CrossRef] [Google Scholar]
- Fienga, A., Manche, H., Laskar, J., Gastineau, M., & Verma, A. 2014, ArXiv e-prints [arXiv: 1405.0484] [Google Scholar]
- Fienga, A., Deram, P., Viswanathan, V., et al. 2019, Notes Scientifiques et Techniques de l’Institut de Mecanique Celeste, 109 [Google Scholar]
- Folkner, W. M., Williams, J. G., Boggs, D. H., Park, R. S., & Kuchynka, P. 2014, Interplanet. Netw. Progr. Rep., 42, 1 [Google Scholar]
- Garattini, M., Dell’Agnello, S., Currie, D., et al. 2013, Acta Polytechnica, 53, 821 [CrossRef] [Google Scholar]
- Hofmann, F. 2017, PhD Thesis, Leibniz Universität Hannover, Germany [Google Scholar]
- Hofmann, F., & Müller, J. 2018, Class. Quant. Grav., 35, 035015 [Google Scholar]
- Koch, K.-R., & Kusche, J. 2002, J. Geodesy, 76, 259 [NASA ADS] [CrossRef] [Google Scholar]
- Mendes, V., & Pavlis, E. C. 2004, Geophys. Res. Lett., 31, L14602 [NASA ADS] [CrossRef] [Google Scholar]
- Mendes, V., Prates, G., Pavlis, E. C., Pavlis, D., & Langley, R. 2002, Geophys. Res. Lett., 29, 53 [CrossRef] [Google Scholar]
- Merkle, F. 1992, in European Southern Observatory Conference and Workshop Proceedings, 42 [Google Scholar]
- Moyer, T. D. 1971, Mathematical formulation of the double precision orbit determination program/dpodp, Tech. Rep. 32-1527 [Google Scholar]
- Müller, J., Hofmann, F., & Biskupek, L. 2012, Class. Quant. Grav., 29, 184006 [CrossRef] [Google Scholar]
- Müller, J., Biskupek, L., Hofmann, F., & Mai, E. 2014, Lunar Laser Ranging and Relativity, ed. S. M. Kopeikin (Berlin, Boston: De Gruyter), 103 [Google Scholar]
- Müller, J., Murphy, T. W., Schreiber, U., et al. 2019, J. Geodesy, 93, 2195 [CrossRef] [Google Scholar]
- Murphy, T. 2013, Rep. Prog. Phys., 76, 076901 [NASA ADS] [CrossRef] [Google Scholar]
- Murphy, T., Adelberger, E. G., Battat, J., et al. 2008, PASP, 120, 20 [NASA ADS] [CrossRef] [Google Scholar]
- Niemeier, W. 2001, Ausgleichungsrechnung: Eine Einführung für Studierende und Praktiker des Vermessungs- und Geoinformationswesens (Berlin, Boston: De Gruyter) [CrossRef] [Google Scholar]
- Noll, C. E. 2010, Adv. Space Res., 45, 1421 [NASA ADS] [CrossRef] [Google Scholar]
- Park, R. S., Folkner, W. M., Williams, J. G., & Boggs, D. H. 2021, AJ, 161, 105 [NASA ADS] [CrossRef] [Google Scholar]
- Pavlov, D. 2020, J. Geodesy, 94, 5 [NASA ADS] [CrossRef] [Google Scholar]
- Pearlman, M. R., Noll, C. E., Pavlis, E. C., et al. 2019, J. Geodesy, 93, 2161 [NASA ADS] [CrossRef] [Google Scholar]
- Petit, G., & Luzum, B. 2010, IERS Conventions, Bureau International des Poids et mesures (Frankfurt am Main: Verlag des Bundesamts für Kartographie und Geodäsie) [Google Scholar]
- Schreiber, K. U., Eckl, J. J., Leidig, A., et al. 2019, in AGU Fall Meeting Abstracts, G31B-0647 [Google Scholar]
- Seitz, M. 2015, in The 1st International Workshop on the Quality of Geodetic Observation and Monitoring Systems (QuGOMS’11), eds. H. Kutterer, F. Seitz, H. Alkhatib, & M. Schmidt (Cham: Springer International Publishing), 57 [CrossRef] [Google Scholar]
- Shapiro, I. I. 1964, Phys. Rev. Lett., 13, 789 [Google Scholar]
- Singh, V. V., Biskupek, L., Müller, J., & Zhang, M. 2022, Adv. Space Res., 70, 2383 [NASA ADS] [CrossRef] [Google Scholar]
- Turyshev, S. G., Williams, J. G., Folkner, W. M., et al. 2013, Exp. Astron., 36, 105 [NASA ADS] [CrossRef] [Google Scholar]
- Turyshev, S. G., Shao, M., Hanh, I., Williams, J. G., & Trahan, R. 2018, in Proceedings of the 21st International Workshop on Laser Ranging, Canberra, Australia, 5 [Google Scholar]
- Turyshev, S. G., Shao, M., & Hahn, I. 2021, The Decadal Survey on Biological and Physical Sciences (BPS) Research in Space 2023-2032, National Academy of Sciences [Google Scholar]
- Viswanathan, V., Fienga, A., Minazzoli, O., et al. 2018, MNRAS, 476, 1877 [Google Scholar]
- Vokrouhlickỳ, D. 1997, Icarus, 126, 293 [CrossRef] [Google Scholar]
- Williams, J. G., Turyshev, S. G., & Boggs, D. H. 2012, Class. Quant. Grav., 29, 184004 [NASA ADS] [CrossRef] [Google Scholar]
- Williams, J. G., Konopliv, A. S., Boggs, D. H., et al. 2014, J. Geophys. Res. Planets, 119, 1546 [NASA ADS] [CrossRef] [Google Scholar]
- Wu, H. 2016, PhD Thesis, Leibniz Universitat Hannover, Germany [Google Scholar]
- Zerhouni, W., & Capitaine, N. 2009, A&A, 507, 1687 [NASA ADS] [CrossRef] [EDP Sciences] [Google Scholar]
- Zhang, M. 2023, Dataset: Simulated LLR and DLLR data for different cases, 10.25835/wiuc5jkf [Google Scholar]
- Zhang, M., Müller, J., & Biskupek, L. 2020, Celest. Mech. Dyn. Astron., 132 [Google Scholar]
- Zhang, M., Miller, J., Biskupek, L., & Singh, V. V. 2022, A&A, 659, A148 [NASA ADS] [CrossRef] [EDP Sciences] [Google Scholar]
All real LLR data used for this study are available from the Crustal Dynamics Data Information System (CDDIS) at NASA’s Archive of Space Geodesy Data, USA, https://cddis.nasa.gov/Data_and_Derived_Products/SLR/Lunar_laser_ranging_data.html (Noll 2010).
All Tables
Parameter accuracies obtained by using the LLR and data of case 1 as well as their parameter accuracy ratios.
Longitudes and latitudes of the assumed new reflectors M4, M5, and M6 on the Moon.
Basic information of the simulated LLR and DLLR data in “case-M4”, “case-M5”, and “case-M6”.
Parameter accuracy ratios for “case-M4”, “case-M5”, and “case-M6” compared with case 1.
All Figures
|
Fig. 1 Short reflector baselines in case 2. |
| In the text | |
|
Fig. 2 Long reflector baselines in case 3. |
| In the text | |
|
Fig. 3 Crossing reflector baselines in case 4. |
| In the text | |
|
Fig. 4 Positions of the stations used in “case-sta”. |
| In the text | |
|
Fig. 5 Positions of the reflectors used in “case-M4”, “case-M5”, and “case-M6”. |
| In the text | |
Current usage metrics show cumulative count of Article Views (full-text article views including HTML views, PDF and ePub downloads, according to the available data) and Abstracts Views on Vision4Press platform.
Data correspond to usage on the plateform after 2015. The current usage metrics is available 48-96 hours after online publication and is updated daily on week days.
Initial download of the metrics may take a while.