| Issue |
A&A
Volume 690, October 2024
|
|
|---|---|---|
| Article Number | A155 | |
| Number of page(s) | 19 | |
| Section | Extragalactic astronomy | |
| DOI | https://doi.org/10.1051/0004-6361/202347589 | |
| Published online | 04 October 2024 | |
The peculiar optical spectrum of Mrk 231
1
I. Physikalisches Institut, Universität zu Köln, Zülpicher Str. 77, 50939 Köln, Germany
2
Max-Planck Institut für Radioastronomie (MPIfR), Auf dem Hügel 69, 53121 Bonn, Germany
Received:
27
July
2023
Accepted:
26
February
2024
Markarian 231 (Mrk 231) is one of the closest and brightest ultra-luminous infrared galaxies that is considered to be in a late galaxy merger stage. The optical spectrum of Mrk 231 presents peculiar features and has been the subject of detailed studies. In this paper we study the optical long-slit spectroscopy of the central arcsecond of Mrk 231 as well as six off-nuclear spectral positions observed using the multi-object double spectrographs at the Large Binocular Telescope. Additionally, we carefully examine acquisition images taken before the spectroscopic observations. We find that both the nuclear and off-nuclear spectra of Mrk 231 exhibit broad Hα emission lines, which could be attributed to high-velocity outflows from the nucleus of Mrk 231, an extreme circumnuclear starburst, or a disturbed circumnuclear disc and broad line region associated with the merger of galaxies. The narrow Hα emission line has three components in every spectrum, which could be indicative of low-velocity outflows or a disturbed structure of the narrow-line region. The region to the south of the nucleus exhibits weak Hβ emission, and the regions to the north show no or extremely faint Hβ emission. The continuum has a stronger blue component in the south compared to the north. The central spectrum has prominent broad absorption lines at a redshift of ∼0.0262, which is distinct from the redshift of the emission line system, ∼0.0422. Broad absorption lines belonging to at least three systems are present in all of the off-nuclear spectra, but the regions to the south have their most prominent absorption lines at a redshift of ∼0.0262, and all three systems have absorption lines of similar strengths in the regions to the north. A careful examination of the acquisition images of Mrk 231 shows that there is diffuse emission in the region adjacent to the northern tail, extending in the north-east direction almost orthogonally, which might be an indication of a more complex interaction history.
Key words: Galaxy: kinematics and dynamics / galaxies: active / galaxies: evolution / galaxies: interactions / galaxies: starburst
© The Authors 2024
 Open Access article, published by EDP Sciences, under the terms of the Creative Commons Attribution License (https://creativecommons.org/licenses/by/4.0), which permits unrestricted use, distribution, and reproduction in any medium, provided the original work is properly cited.
This article is published in open access under the Subscribe to Open model. Subscribe to A&A to support open access publication.
1. Introduction
Interacting galaxies provide an excellent environment for both the rapid growth of supermassive black holes (SMBHs) via accretion and enhanced star formation. Ultra-luminous infrared galaxies (ULIRGs) are proposed to represent an advanced phase of interacting galaxies, where the active galactic nucleus (AGN) is initially dust-enshrouded before the combination of radiation pressure and supernova explosions sets in to clear the dust, thereby exposing the central optical quasar (Sanders et al. 1988a,b; Veilleux et al. 2009; Hickox & Alexander 2018).
At a redshift of ∼0.042 (Adams & Weedman 1972; Boksenberg et al. 1977; Lipari et al. 2009), Mrk 231 is one of the closest radio-quiet ULIRGs to us and therefore has been much studied over the years in various wavelength regimes – including gamma rays (Dermer et al. 1997), X-rays (Eales & Arnaud 1988; Turner 1999; Maloney & Reynolds 2000; Gallagher et al. 2002; Turner & Kraemer 2003; Piconcelli et al. 2013; Teng et al. 2014; Veilleux et al. 2014), ultraviolet (UV; Lipari et al. 1994; Veilleux et al. 2013, 2016; Yang et al. 2018), optical (Boksenberg et al. 1977; Hutchings & Neff 1987; Hamilton & Keel 1987; Boroson et al. 1991; Lipari et al. 1994, 2009; Carilli et al. 1998; Lai et al. 1998; Rupke et al. 2005), infrared (IR; Rieke 1976; Cutri et al. 1981; Roche et al. 1983; Armus et al. 1994; Soifer et al. 2000), radio (Baan 1985; Hutchings & Neff 1987; Sanders et al. 1987; Richards et al. 2005; Krips et al. 2008; Fischer et al. 2010), and millimetre and sub-millimetre (Papadopoulos et al. 2007; van der Werf et al. 2010; Aalto et al. 2012; Cicone et al. 2012; Alatalo 2015; González-Alfonso et al. 2018) – since it was first catalogued as object 231 by Markarian (1969) and classified as a galaxy with a strong UV continuum. One of the earliest optical spectroscopic studies of Mrk 231 showed that it has a quasi-stellar-object-like spectrum (Adams & Weedman 1972). Several broad emission lines and multi-component absorption lines are visible in the spectrum. The absorption lines were shown to be a composite type A stellar spectrum at a redshift similar to the emission lines originating in the nucleus (Adams 1972). Subsequent studies of higher-resolution observations revealed at least three absorption line systems, at redshifts of 8000, 6250, and 12 900 kms−1 (Boksenberg et al. 1977), along with strong Fe II emission (Lipari et al. 1994). Mrk 231 is now classified as an Fe II-emitting, low-ionisation, broad absorption line (FeLoBAL) quasi-stellar object (QSO; e.g. Lípari et al. 2005; Lipari et al. 2009; Becker et al. 1997, 2000. The spectrum of FeLoBAL QSOs is supposed to be a superposition of continuous radiation from the accretion disc, the broad emission lines that form in the neighbouring region, and broad absorption lines (BALs) that form when the continuum passes through a separate region, which is called the BAL region (Branch et al. 2002). The distance between the broad emission and BAL systems might account for the difference in the redshift of the systems. Baan (1985) and Klöckner et al. (2003) detected strong hydroxyl (OH) megamaser emission in Mrk 231. In order to have (OH) maser emission, there needs to be a potentially extended nuclear source that gives rise to radio continuum and UV radiation, along with dust to convert the UV radiation into IR radiation, which can then pump foreground molecular gas (Baan 1985). A starburst triggered by a galaxy–galaxy interaction could give rise to optimal conditions for such masing action to occur. Optical integral field spectroscopy confirmed the presence of an intense and young nuclear starburst (Lipari et al. 2009), leading to the general consensus that the continuum emission in the optical regime arises from the circumnuclear starburst, while the active nucleus is responsible for the broad emission lines.
With a strong AGN as well as an extreme nuclear starburst, Mrk 231 has been found to be a site of nuclear winds, outflows, galactic winds, super-giant bubbles, and extreme supernovae and hypernovae (Lipari et al. 2009; Rupke & Veilleux 2011). Galactic winds play an important role in the evolution of galaxies (Veilleux et al. 2005; Fabian 2012). They can help quench star formation within the galaxy by heating and/or ejecting the cool gas from the host (Veilleux et al. 2016). They are also considered to be the mechanism responsible for the self-regulatory growth of the black hole and the bulge component of the galaxy (e.g. Di Matteo et al. 2005; Murray et al. 2005; Veilleux et al. 2013).
Mrk 231 is an extremely luminous galaxy in an advanced merger stage at a low redshift. As such, it is an excellent candidate for studies geared towards improving our understanding of galaxy evolution via interactions. The main goal of this work is to study the behaviour of the optical spectrum at the centre of Mrk 231 and its vicinity. This is particularly interesting considering the late stage of interaction, during which the two centres are indistinguishable.
In this paper we present the results from an optical spectroscopic study of Mrk 231 carried out using the multi-object double spectrographs (MODS) at the Large Binocular Telescope (LBT). This paper is organised as follows. We present details about the observations and data reduction in Section 2. We present the spectra from different regions of Mrk 231 in Section 3, discuss our results in Section 4, and draw conclusions in Section 5.
2. Observations and data reduction
Mrk 231 was observed using MODS at the LBT in Tucson, Arizona, USA, on 28 and 29 April 2022. The observations were performed in binocular mode, with both MODS1 and MODS2 centred on the same source. The spectra have a wavelength coverage in the range 3200–10 000 Å. A 1″ wide and 5′ long slit was used for the observations. The seeing was variable throughout the run but averaged 1″–1.5″.
The top panel of Figure 1 shows an Sloan Digital Sky Survey (SDSS) image of Mrk 231, the source being studied in this paper, in heat colours. The intensely bright centre shows the site of the circumnuclear starburst and the AGN. The less bright host galaxy can be seen surrounding the central region. Additionally, the middle panel of Figure 1 shows the two tidal arms, one moving northwards clockwise from the central region and another moving in a counter-clockwise direction southwards from the central region, can be seen. The bottom panel shows the same SDSS image in grey scale, overlaid with the slit positions used for the observation.
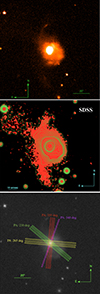 |
Fig. 1. SDSS image of Mrk 231. Top: Coloured SDSS image of Mrk 231. Middle: Coloured SDSS image of Mrk 231 overlaid with arbitrarily selected contours. Bottom: SDSS image of Mrk 231 in grey scale, overlaid with the slit positions used during observations. Green marks a PA of 230°, blue marks a PA of 265°, magenta marks a PA of 340°, and red marks a PA of 355°. For PAs 230°, 265°, and 355°, we took off-nuclear spectra at offsets of 2″ to either side of the central slit positions. In both images, north is up and east is to the left. The scale is indicated. |
Mrk 231 was observed using four different position angles (PAs) in total. The colour green is used to mark slit positions corresponding to a PA of 230°, yellow marks 265°, magenta marks 340°, and red marks 355°. Three out of the four PAs, 230°, 265°, and 355°, were observed with three slit positions: centre and offsets of 2″ to either side of the centre. Additionally, all of the slit positions were dithered along the vertical axis by 10″, culminating in two exposures per slit position and six exposures in total per PA. The integration time per exposure was 700 s. The fourth PA, 340°, was observed with the slit positioned through the centre of the galaxy and a vertical dither of 10″, with half the exposure time of the exposures at other PAs, giving two exposures for this PA, with a 350 s integration time per exposure. The details of the observations can be found in Table 1. The PAs were chosen such that they would cover the overdensity in flux observed adjacent to the northern tidal tail, as well as to coincide with the asymmetric extension of the central bright region towards the south.
Observational details.
The two-dimensional spectra were bias-corrected using the MODS charge-coupled device (CCD) reduction pipeline (Pogge 2019). Cosmic ray correction, wavelength and flux calibration, and one-dimensional spectral extraction were performed using Pyraf routines, adapted for Python from the Image Reduction and Analysis Facility (IRAF) spectral reduction manual1. Wavelength calibration was performed using two-dimensional spectra of Hg, Ar, Ke, Xe, and Ne lamps observed with the dome of the telescope closed. Flux calibration was performed using the spectrophotometric standard star, BD+33d2642, observed on the first night of the observing run. The spectrophotometric standard star spectra underwent the same data reduction procedure as the science data. MODS1 and MODS2 spectra belonging to each slit position were combined after reduction to improve the signal-to-noise ratio. We were left with ten one-dimensional spectra, corresponding to each slit position, at the end of the data reduction and spectral extraction procedure: four from the centre and six from the offset positions. We further combined the four central spectra, since they were extracted over an aperture of 1″. The resultant seven spectra are presented in the next section.
3. Spectra
In this section we present the one-dimensional spectra extracted from the central 1″ of Mrk 231 and the offset positions around PAs 230°, 265°, and 355°, respectively. In each spectrum, the abscissa represents the observed wavelength in Angstroms, while the ordinate shows the flux density in erg s−1 cm−2 Å−1. The emission and absorption lines are identified and marked, with colour red for emission lines and blue for absorption lines. We considered the most prominent and studied emission and absorption lines in the optical regime for our study.
3.1. Central 1″
Figure 2 shows the one-dimensional spectrum of the central 1″ of Mrk 231. The one-dimensional spectrum is obtained by averaging over the central spectra corresponding to the four different PAs 230°, 265°, 340°, and 355°. The most prominent emission line is the Balmer recombination line, Hα. Based on chi-square values as well as visual inspection, six Gaussian components are required to fit the line. Figure 3 (top panel) shows the Gaussian decomposition of the Hα line. The broadest component has a full width at half maximum (FWHM) of 8594.4 ± 70.3 km s−1. Along with Hα, we see comparatively weak Hβ, comparatively weak [O II]λ3727, extensive Fe II, and Na I D emission lines. The various emission lines, their line centres, fluxes, and FWHMs can be found tabulated in Table 2. The spectrum also shows one prominent set of absorption lines, the He Iλ3889, the Ca II H+K, and the Na I D absorption lines. A zoomed-in view of the Gaussian fitting of the absorption lines in the blue band can be seen in Figure 3 (bottom panel). To the left of the prominent blue band absorption lines, three other much weaker absorption lines can be seen whose source could not be ascertained. Table 3 lists the line centres, fluxes, and FWHMs of the prominent absorption lines. All of the prominent absorption lines are at the common redshift of ∼0.0262, while all of the emission lines, except [O II]λ3727, are at the common redshift of 0.0425. [O II]λ3727 is at the redshift of 0.0400. The redshifts across all the regions studied can be found in Table 4.
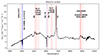 |
Fig. 2. Averaged one-dimensional observed optical spectrum of the central arcsecond of Mrk 231. The observed emission lines are marked with vertical dotted red lines, and the vertical dotted blue lines mark absorption lines. The aperture size for spectral extraction is 1″. The wavelength axis depicts the observed wavelength. |
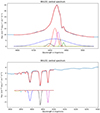 |
Fig. 3. Spectral decomposition of emission and absorption lines using Gaussian fitting. The aperture size for spectral extraction is 1″. The wavelength axis (abscissa) depicts the observed wavelength. Top: Zoomed-in view of the spectral decomposition using Gaussian fitting of the Hα line in the averaged one-dimensional observed optical spectrum of the central arcsecond of Mrk 231. Six components were required to get the best fit marked by the solid red line. Dashed blue, black, red, magenta, yellow, and cyan lines show the individual Gaussian components. Bottom: Zoomed-in view of the spectral decomposition using Gaussian fitting of the absorption lines in the blue channel in the averaged one-dimensional observed optical spectrum of the central arcsecond of Mrk 231. Six components were required to get the best fit marked by the solid red line. Dashed blue, black, red, magenta, yellow, and cyan lines show the individual Gaussian components. |
Mrk 231 centre emission line data.
Mrk 231 centre absorption line data.
Mrk 231 redshifts.
3.2. Off-nuclear spectra
Figures 4, 7, 5, 8, 9, and 6 show the one-dimensional spectra extracted over apertures of 1″ at a distance of 2″ to either side of the centre of Mrk 231 at PAs of 230°, 265°, and 355 ° each. This corresponds to a distance of ∼1.7 kpc at the redshift of 0.042.
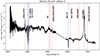 |
Fig. 4. One-dimensional observed optical spectrum of Mrk 231 observed at a PA of 230, with an offset of 2″ to the left of the centre. The observed emission lines are marked by vertical dotted red lines and named. The aperture size for spectral extraction is 1″. The wavelength axis depicts the observed wavelength. |
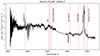 |
Fig. 5. One-dimensional observed optical spectrum of Mrk 231 observed at a PA of 265, with an offset of 2″ to the left of the centre. The observed emission lines are marked by vertical dotted red lines and named. The aperture size for spectral extraction is 1″. The wavelength axis depicts the observed wavelength. |
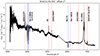 |
Fig. 6. One-dimensional observed optical spectrum of Mrk 231 observed at a PA of 355, with an offset of 2″ to the right of the centre. The observed emission lines are marked by vertical dotted red lines and named. The aperture size for spectral extraction is 1″. The wavelength axis depicts the observed wavelength. |
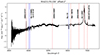 |
Fig. 7. One-dimensional observed optical spectrum of Mrk 231 observed at a PA of 230, with an offset of 2″ to the right of the centre. The observed emission lines are marked by vertical dotted red lines and named. The aperture size for spectral extraction is 1″. The wavelength axis depicts the observed wavelength. |
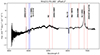 |
Fig. 8. One-dimensional observed optical spectrum of Mrk 231 observed at a PA of 265, with an offset of 2″ to the right of the centre. The observed emission lines are marked by vertical dotted red lines and named. The aperture size for spectral extraction is 1″. The wavelength axis depicts the observed wavelength. |
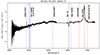 |
Fig. 9. One-dimensional observed optical spectrum of Mrk 231 observed at a PA of 355, with an offset of 2″ to the left of the centre. The observed emission lines are marked by vertical dotted red lines and named. The aperture size for spectral extraction is 1″. The wavelength axis depicts the observed wavelength. |
A quick look at the spectra reveals that we can group them into two categories. The first category consists of PA 230 ° with an offset of –2″, PA 265° with an offset of –2″, and PA 355 ° with an offset of +2″. These spectra are extracted from regions to the south-east, south, and east of the centre of Mrk 231. The second category is made up of PA 230 ° with an offset of +2″, PA 265 ° with an offset of +2″, and PA 355 ° with an offset of –2″, and the spectra are extracted from regions to the north-west, north, and west of the centre of Mrk 231. Spectra belonging to each category share a similar spectral shape and have similar spectral characteristics. In addition to this, all of the spectra share some common features.
3.2.1. General common features of the off-nuclear spectra of Mrk 231
The spectra show several emission and absorption lines. The most prominent emission line, as with the central spectrum, is the Hα recombination line. However, at the distance of ∼1.7 kpc from the centre, along with the centrally present [O II]λ3727, other high ionisation emission lines are also present in the spectrum. These are the [O III]λ4959, [O III]λ5007, [O I]λ6300, [N II]λ6548, [N II]λ6583, [S II]λ6716, and [S II]λ6731 emission lines. The fluxes of these emission lines are lower than the flux of the central spectrum by an order of magnitude. At this distance from the centre of the galaxy, the emission from the host galaxy should contribute significantly to the spectrum, with the influence of the central AGN lessening. However, interestingly, for all of the off-nuclear spectra, we need one broad and three narrow components to fit the Hα line along with two additional narrow components corresponding to the [N II]λ6548 and [N II]λ6583 emission lines. A zoomed-in view of the Gaussian fitting of the emission lines in the red band of the spectra from PA 230° with offsets of –2″ and +2″ can be seen in Figures B.1 and B.3, respectively. The observed emission lines and the line centres, fluxes, and FWHMs of each of the spectra can be found in Tables A.1, A.3, A.5, A.7, A.9, and A.11, respectively.
Along with emission lines, the prominent absorption lines visible in the central spectrum can be seen in these spectra as well (i.e. the He Iλ3889, Ca II H+K, and Na I D absorption lines). The redshift of the absorption line system remains the same as that for the central absorption line system at ∼0.0262, as does that of the emission line system at ∼0.0426. However, in addition to the absorption lines at redshift of ∼0.0262, at least two other absorption line systems are present in the off-nuclear spectra. One absorption system appears at the redshift of the emission lines at ∼0.0426. The second set might be at redshift similar to the weak second set of absorption lines seen in the central spectrum. Figures B.2 and B.4 present zoomed-in views to the Gaussian fitting of the absorption lines in the blue band of the spectra from PA 230° with offsets of –2″ and +2″, respectively. The absorption lines observed, their line centres, fluxes, and FWHMs from each of the spectra can be found in Tables A.2, A.4, A.6, A.8, A.10, and A.12, respectively. Additionally, unlike the central spectrum, the redshift for the [O II]λ3727 emission line is ∼0.0421, which is similar to the average redshift of the emission line system.
3.2.2. Differences in the spectral features of the off-nuclear spectra of Mrk 231
The two categories of off-nuclear spectra of Mrk 231 differ from one another in two major aspects. The first is the shape of the continuum. The spectra belonging to category one (i.e. spectra corresponding to regions to the south and east of the nucleus) have lower levels of continuum in the blue band that steepen towards the blue part of the spectrum. The steepening is the highest in the case of PA 355° at offset +2″, which corresponds to a spectral extraction region to the south-east and/or east of the nucleus. The lowest steepening is at a PA of 265 ° at an offset of –2″, which corresponds to a spectral extraction region to approximately south of the nucleus. The spectra belonging to category two (i.e. spectra corresponding to regions to the north and west of the nucleus) have flat continua, with a slight tapering off towards the blue end of the spectra.
The second major difference between the spectra belonging to the two categories is the presence or absence of the Hβ emission line. Category one spectra have weak Hβ emission lines, both broad and narrow, but amongst the category two spectra, only PA 265° at offset +2″ shows the presence of a weak Hβ emission line. The other two spectra show no indication of Hβ emission. The narrow Hβ emission is the strongest in the case of PA 355 ° at an offset of +2″, which is almost due east of the nucleus.
In addition to these two differences, category one spectra seem to have more prominent absorption lines at the redshift of ∼0.0262 compared to the other two absorption systems, while in the case of category two spectra, all the absorption lines are of similar strength.
4. Discussion
Figures 2, 4, 7, 5, 8, 9, and 6 show the spectra corresponding to the central arcsecond of Mrk 231 and six other regions at offsets of 2″ from the centre. Previous detailed studies of the spectra have shown that the QSO has a major contribution towards the central spectrum, while the spectra from the off-centre regions have contributions from the intense circumnuclear starburst and the host galaxy (e.g. Lipari et al. (2009), Veilleux et al. (2016)). In the following section we discuss some of the characteristics of Mrk 231 associated with these spectra.
4.1. High-velocity outflows in emission lines
One of the most interesting aspects of the spectra of Mrk 231 is the presence of broad Hα components in regions located at a distance of ∼1.7 kpc (2″) away from the centre of the galaxy. The presence of a broad Hα component in the central region of Mrk 231 has been studied in previous works like Lípari et al. (2005). However, we find broad Hα components with FWHMs of ∼8000 km s−1 at a distance of ∼1.7 kpc away from the centre. The line centres of all of the broad Hα components from the offset slit positions are blueshifted compared with the central broad Hα component. In addition to Hα, wherever Hβ is present in the spectrum, it has a broad component as well. However, the Hβ line usually needs only one or two components to get a good line fit, while the Hα+[N II] complex needs at least six components: in addition to the four components corresponding to the two [N II] and the broad and narrow Hα lines, there are two additional components, one to the left of [N II]λ6548 and another to the right of [N II]λ6583.
The discovery of emission line components with FWHMs of ∼8000 km s−1 at a large distance of ∼ 2″ from the SMBH is puzzling. The first thing to consider is whether any seeing effects might lead to a contribution from the central arcsecond to the spectra extracted from off-nuclear regions. The slit width used for observations was 1″, while the seeing varied through the night. We plotted the intensity profiles of Mrk 231 and the standard star along the slit. The intensity profile of the standard star shows a FWHM of ∼10 pixels, which corresponds to ∼1.2″. Plotting a Gaussian curve using a FWHM of 1.2″ and an amplitude corresponding to the flux of the Hα broad line at the centre of the galaxy gives us an intensity profile of the broad Hα line (see Figure C.1). We then over-plotted the Hα broad line fluxes from the off-nuclear regions on this Gaussian curve, leading us to conclude that the fluxes obtained from the broad Hα emission lines are higher than expected from a simple contribution from the central arcsecond of Mrk 231 (see Figure C.2 and Table C.1). Moreover, the line centres of the broad Hα components from the off-nuclear regions are blueshifted compared to the line centre of the broad Hα line from the very centre of Mrk 231. Additionally, the presence of more emission lines in the off-nuclear spectra compared to the nuclear spectrum indicates that we are most likely looking at a different region of the galaxy. Historically, such broad velocity components are usually associated with the broad-line region (BLR) of an AGN and to a lesser extent with outflows or nuclear winds. The BLR typically has a size in the range of 0.1–1 pc. However, since Mrk 231 is a late-stage merger, with the SMBHs having merged already or in a binary SMBH stage (Yan et al. 2015; Kovačević et al. 2020), corresponding BLRs might also be in a state of flux and might be much more extended than normal BLRs in non-colliding systems. The presence of broad Hα (and, to a lesser extent, Hβ) components might also be attributed to some form of nuclear wind/outflows. Rupke & Veilleux (2011) report neutral gas outflow with velocities of about ∼1000 km s−1, extending in all directions from the centre of Mrk 231 up to at least 3 kpc. Our data show that the top two Balmer lines, at least, could be a part of the outflow.
Galactic winds have been also associated with Mrk 231. Lípari et al. (2005) present one- and two-dimensional spectra of Mrk 231. They report the existence of four or five nuclear superbubbles or shells with radii ∼2.9, 1.5, 1.0, 0.6, and 0.2 kpc, and suggest that these giant bubbles could be generated by massive supernova/hypernova explosions associated with an extreme nuclear starburst that could be a stage in the evolution of a young QSO. While extreme starbursts might contribute towards the high velocities observed in the extended regions in Mrk 231, starburst ULIRGs do not display such high velocities, in general. Therefore, there is a strong possibility that the ionised gas outflow we see in our data has a contribution from the AGN as well.
4.2. Low-velocity outflows in emission lines
Along with an ever-present broad component, the Hα+[N II] blend requires two additional narrow components in each spectrum to have a reasonable resulting best-fit when performing Gaussian fitting. The most obvious of these components is the bump to the right (redwards) of the Hα+[N II] blend. Along with the red bump, Lípari et al. (2005) report the presence of a blue bump. The blue bump is also seen in our data, although it is less conspicuous (see Figures B.1 and B.3 for a zoomed-in view of the Hα+[N II] complex from the offset positions at a PA of 230°). Lípari et al. (2005) attribute this spectral feature to outflowing clouds associated with the stellar shells. The outflowing clouds could be a part of the narrow-line region. However, while the multiple narrow Hα components are present in all of the spectra, we only see blue asymmetry in the [O II]λ3727 emission line in the case of spectra taken at PAs of 230°, at an offset of −2″, 265° at an offset of −2″, and 355° at an offset of +2″. That is, the [O II]λ3727 line shows blueshifted components with FWHMs in the range 1200–1400 km s−1 to the south and east of the nucleus, but not to the north and west. Compared to the FWHM of ∼8000 km s−1 of the broad Hα components, the FWHM of the blueshifted components of [O II]λ3727 as well as the narrow components of the Hα+[N II] are smaller, corresponding to lower velocities. However, we see no blueshifted components and no asymmetry in the [O III]λ5007 emission line in any of the spectra, which might be due to the weakness of the line.
4.3. Strong Fe II emission
The central spectrum of Mrk 231 is characterised by strong Fe II emission, with FWHMs ≳1500 km s−1. The observed emission lines are marked and indicated in Figure 2 and data related to the emission lines can be found in Table 2. We see no clear indication of the presence of Fe II emission lines in the off-nuclear spectra. This is as expected, considering that while the presence of an AGN is not a necessary criterion for Fe II emission, H II regions generally do not show strong Fe II emission since, in the presence of dust, iron is depleted on to grains (de Boer et al. 1972). Fe II emission in AGNs seems to arise in the outermost part of the BLR, very close to the surrounding dust (Gaskell et al. 2022). Lípari et al. (2005) and Lipari et al. (2009) suggest that BAL QSOs with Fe II low ionisation are young and composite or transition QSOs, where outflows and galactic winds are clearing the nuclear dust that is created by the extreme nuclear starburst, in the form of giant bubbles and supernova and hypernova explosions.
4.4. Broad absorption line system
Mrk 231 spectra show several absorption lines in addition to the emission lines. The most prominent of these are the He Iλ3889, the Ca II H and K, and the Na I D absorption lines. With the exception of the central spectrum, all other spectra from offset positions show multiple systems of absorption lines. The strongest set of absorption lines is at a redshift of ∼7860 km s−1 (z∼0.0262), while another set of absorption lines lies at a redshift of ∼12 600 km s−1 (z∼0.042), which corresponds with the redshift of the emission lines. Along with these two, another absorption line system seems to be present in the spectra, but the source of this system is unclear. The absorption lines are more prominent in the spectra from the centre and at PAs of 230°, at an offset of −2″, 265° at an offset of −2″, and 355° at an offset of +2″, respectively (i.e. to the south and east of the nucleus). He Iλ3889 and Na I D absorption lines are broad, with FWHM ≳ 1000 km s−1, except for the central spectrum where FWHMHe Iλ3889 ∼ 800 km s−1. Additionally, FWHMHe Iλ3889 > FWHMNa I D, with the exception of the central spectrum, and spectra from PA 230° at an offset of –2″ and PA 355° at an offset of +2″ where FWHMHe Iλ3889 < FWHMNa I D.
The He Iλ3889 line arises from a metastable level 23 eV above the ground state. Absorption from a high-lying metastable level could be an indication that the absorbing clouds are associated with the nuclear activity in Mrk 231 (Boksenberg et al. 1977). The redshift of the absorption line system would then represent the velocity, relative to the emission line system, with which the absorbing material is approaching Earth. This in turn provides us with an upper limit of ∼4740 km s−1 for the outflow velocity, estimated as the difference between the systemic redshift and the redshift of the absorption line system.
4.5. Mass of the SMBH
While there is an extreme nuclear starburst in Mrk 231, the central spectrum is majorly dominated by emission from the central non-thermal AGN. The broad emission line components in the central spectrum of Mrk 231 could be used to estimate the mass of the central SMBH.
While both Hα and Hβ have broad components in the central spectrum, the Hα emission might have some contribution from the nuclear starburst. Therefore, we chose to use the Hβ emission line to estimate the mass of the central SMBH. We used the virial mass formula based on the Hβ emission line put forth by Greene & Ho (2005):

where LHβ is the luminosity of the broad Hβ emission line in the units of erg s−1 and FWHMHβ is the FWHM of the broad Hβ emission line in the units of kms−1. The thus estimated mass of the SMBH at the centre of Mrk 231 comes out to be (2.3 ± 0.2)×108 M⊙. This is in very good agreement with the value, MBH = 2.3 × 10⁸M⊙, put forth by Leighly et al. (2014) using the broad Pα line. Veilleux et al. (2009) estimate the bolometric luminosity, LBol, of Mrk 231 to be 1.1 × 1046erg s−1 (Veilleux et al. 2016). Using our estimated value of the mass of the SMBH at the centre of Mrk 231, we infer an Eddington ratio of ∼0.3. The high value of the Eddington ratio further supports the existence of nuclear outflows, since sources accreting near the Eddington ratios are expected to drive nuclear outflows (Veilleux et al. 2016).
4.6. Presence of a diffuse third tail
A careful analysis of the Digitized Sky Survey (DSS) (Figure 10) and SDSS (Figure 1, middle panel) images of Mrk 231 reveals the presence of diffuse emission adjacent to the northern tidal arm and at an angle to it. We were unable to extract any useful spectra from this region, but before starting spectroscopy observations, acquisition images were taken with the red channel of MODS at every PA, and the region with the diffuse emission fell inside the field of view. The exposure time for the acquisition image at a PA of 230° was 60 s, while the acquisition images at the other three PAs were only exposed for 30 s each. These acquisition images were rotated and stacked after being bias-corrected (Figure 11). Overlaying contours at arbitrarily chosen levels, we see that there is an overdensity of emission, higher than the background, adjacent to the northern tidal tail, extending almost orthogonally outwards from its base in the north-east direction. We see this extension in all four of our acquisition images, taken in the red band but at different PAs, and stacking the images together makes it easier to see this.
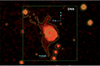 |
Fig. 10. Optical DSS image of Mrk 231 overlaid with arbitrarily selected contours. The green box indicates the field of view of the SDSS survey for comparison with Figure 1 (middle panel). The scale and directions are marked. |
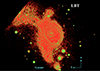 |
Fig. 11. Optical image of Mrk 231 assembled by rotating and stacking the four acquisition images taken by the LBT prior to the spectroscopy observations. The presence of diffuse emission adjacent to the northern tidal tail and at an angle to it can clearly be seen. The scale and directions are marked. |
4.7. Mrk 231 as a triple merger
If we consider the morphology of Mrk 231 and disregard the presence of the diffuse emission, a similarity emerges between the structure of Mrk 231 and the Antennae galaxies (NGC 4038 and NGC 4039), although we note that unlike the NGC 4038–NGC 4039 pair, where both of the galaxies are clearly distinguishable, Mrk 231 seems to be at a later stage of the merger where the progenitor galaxies can no longer be distinguished. In the absence of the diffuse emission, the progenitor galaxies could have been understood to have similar starting conditions as NGC 4038 and NGC 4039, but the presence of this diffuse emission introduces an asymmetry to the morphology of Mrk 231. While the presence of one or two tidal tails is ubiquitous in cases involving the interaction of two galaxies (Toomre & Toomre 1972), the existence of an asymmetry seems to be rare.
Such asymmetry could come about if we consider a past interaction with another galaxy, perhaps a dwarf. In that case, the diffuse emission could be a tidal remnant of the minor interaction. Some superficial similarities may be observed with the morphology of the triple merger systems like NGC 3341 and SDSS J084905.51+111447.2. However, both NGC 3341 and SDSS J084905.51+111447.2 (Pfeifle et al. 2019) seem to have three cores corresponding to the three merging galaxies, even if their discs seem to have been stripped in the case of NGC 3341 (Barth et al. 2008), while, in the case of Mrk 231, we do not observe the cores corresponding to the second and third galaxies.
Investigating if Mrk 231 really is a product of a triple galactic merger would be of great scientific interest. Since the cores corresponding to the galaxies are no longer distinguishable, they might already be in a post-merger stage. Interactions of galaxies are typically thought to have lifetimes of several million years; however, the presence of a third SMBH is thought to speed up the process (Ryu et al. 2018) and could be a way to get around the ‘final parsec problem’ (Milosavljević & Merritt 2003), which is thought to stall a SMBH binary at parsec scales and prevent merging. Since Mrk 231 is at a low redshift, it would be possible to conduct a more extensive study on it and check if, for example, continuum or velocity information might be available from the region of diffuse emission.
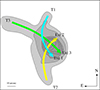 |
Fig. 12. Sketch showing the possible three-galaxy interaction of Mrk 231. The contours and the shaded regions are adapted from the LBT acquisition image (Figure 11). Cyan, yellow, and green arrows indicate the paths followed by the three galaxies. The scale and directions are marked. |
4.8. Possible merger scenario
The presence of a diffuse third tail and in particular the detection of the additional component to the north-east suggests that Mrk 231 is a triple merger. However, a complete simulation would require velocity data from the tidal tails and the main body of the AGN host. In comparison to mergers like the NGC 4038–NGC 4039 pair, we suggest the following scenario for the triple merger: The extensions visible on low and intermediate intensity levels of the host galaxy indicate the presence of extensions that may be linked to the corresponding tidal tails. The main structure is dominated by two merging systems that are responsible for the tails T1 and T2 (see the sketch in Figure 12). These tails may have counterparts in Ext1 and Ext2 on the opposite sides of the nucleus. This structure resembles an almost face-on binary merger. A third component that we identify as the additional component to the north-east as a tidal tail T3, resembles a merger component on an almost edge-on orbit that may find its counterpart on the opposite site of the nucleus in the extended component Ext3. Hence, the orbital plane of this merger component T3-Ext3 would be almost perpendicular to the binary merger T1-Ext2 and T2-Ext2. A verification of this merger hypothesis requires velocity information that may be provided by planned JWST integral field unit observations and detailed modelling as we did, for example, for SDSS J134420.86+663717.8 (Misquitta et al. 2020).
5. Conclusions and summary
Mrk 231 is a Seyfert 1 ULIRG and a FeLoBAL QSO with both high-velocity and low-velocity outflows. In the evolutionary model that favours the path from a merger to a QSO (Sanders et al. 1988a), the mechanism to remove the screen of dust shrouding the nuclei of ULIRGs, and thereby reveal the hidden bright QSO, could be provided by fast BAL outflows (Rupke et al. 2005). Low-ionisation BAL QSOs could thus be an intermediate evolutionary phase between a merger and an unobscured QSO. When two equally massive, gas-rich galaxies undergo an interaction, the gas and dust content within these galaxies either fuels the growth of the central SMBH or is used in the intense starburst triggered by the collision. In the case of Mrk 231, both of these events seem to be taking place simultaneously.
The central region of Mrk 231 exhibits a peculiar behaviour and has been the study of much previous work. The optical spectrum of the central arcsecond of the galaxy consists of a continuum, overlaid with a very broad Hα emission line, several Fe II, Hβ, and Na I Demission lines, and weak [O II]λ3727 emission lines, as well as strong He Iλ3889, Ca II H and K, and Na I D absorption lines. The broad Hα emission and the He Iλ3889, Ca II H and K, and Na I D absorption lines are persistently observed in the spectra extracted from regions at a distance of 2″ (∼1.7 kpc) from the centre. Additionally, we see a constant presence of blueshifted and reddened narrow Hα bumps at wavelengths shorter and longer than [N II]λ6583 in all of our spectra. The emission lines and BALs belong to significantly distinct redshift systems; the emission lines have a redshift of ∼0.042, while the main BALs correspond to a redshift of ∼0.0262. This is typical of BAL systems, where the BAL seem to be produced within clouds associated with the nucleus of the galaxy rather than intervening interstellar medium.
Along with peculiar spectral characteristics, a careful inspection of the acquisition images from the observations presented in this work, as well as archival SDSS and DSS images of Mrk 231, shows that there is diffuse emission adjacent to the northern tidal arm and almost orthogonal to it, which might be indicative of a past interaction with a third (dwarf) galaxy. As such, Mrk 231 is a good candidate for further investigation into the source of the diffuse emission and to check if it is indeed a product of a triple galactic merger.
Acknowledgments
Study of the conditions for star formation in nearby AGN and QSOs is carried out within the Collaborative Research Centre 956, sub-project [A02], funded by the Deutsche Forschungsgemeinschaft (DFG) – project ID 184018867. This paper uses data taken with the MODS spectrographs built with funding from NSF grant AST-9987045 and the NSF Telescope System Instrumentation Program (TSIP), with additional funds from the Ohio Board of Regents and the Ohio State University Office of Research. We made use of the Mods CCD Reduction package to reduce this data. ModsCCDRed was developed for the MODS1 and MODS2 instruments at the Large Binocular Telescope Observatory, which were built with major support provided by grants from the U.S. National Science Foundation’s Division of Astronomical Sciences Advanced Technologies and Instrumentation (AST-9987045), the NSF/NOAO TSIP Program, and matching funds provided by the Ohio State University Office of Research and the Ohio Board of Regents. Additional support for modsCCDRed was provided by NSF Grant AST-1108693. We made use of the NASA/IPAC Extragalactic Database (NED) and the HyperLeda database.
References
- Aalto, S., Garcia-Burillo, S., Muller, S., et al. 2012, A&A, 537, A44 [NASA ADS] [CrossRef] [EDP Sciences] [Google Scholar]
- Adams, T. F. 1972, ApJ, 176, L1 [NASA ADS] [CrossRef] [Google Scholar]
- Adams, T. F., & Weedman, D. W. 1972, ApJ, 173, L109 [NASA ADS] [CrossRef] [Google Scholar]
- Alatalo, K. 2015, ApJ, 801, L17 [NASA ADS] [CrossRef] [Google Scholar]
- Armus, L., Surace, J. A., Soifer, B. T., et al. 1994, AJ, 108, 76 [NASA ADS] [CrossRef] [Google Scholar]
- Baan, W. A. 1985, Nature, 315, 26 [NASA ADS] [CrossRef] [Google Scholar]
- Barth, A. J., Bentz, M. C., Greene, J. E., & Ho, L. C. 2008, ApJ, 683, L119 [NASA ADS] [CrossRef] [Google Scholar]
- Becker, R. H., Gregg, M. D., Hook, I. M., et al. 1997, ApJ, 479, L93 [NASA ADS] [CrossRef] [Google Scholar]
- Becker, R. H., White, R. L., Gregg, M. D., et al. 2000, ApJ, 538, 72 [NASA ADS] [CrossRef] [Google Scholar]
- Boksenberg, A., Carswell, R. F., Allen, D. A., et al. 1977, MNRAS, 178, 451 [NASA ADS] [Google Scholar]
- Boroson, T. A., Meyers, K. A., Morris, S. L., & Persson, S. E. 1991, ApJ, 370, L19 [NASA ADS] [CrossRef] [Google Scholar]
- Branch, D., Leighly, K. M., Thomas, R. C., & Baron, E. 2002, ApJ, 578, L37 [NASA ADS] [CrossRef] [Google Scholar]
- Carilli, C. L., Wrobel, J. M., & Ulvestad, J. S. 1998, AJ, 115, 928 [NASA ADS] [CrossRef] [Google Scholar]
- Cicone, C., Feruglio, C., Maiolino, R., et al. 2012, A&A, 543, A99 [NASA ADS] [CrossRef] [EDP Sciences] [Google Scholar]
- Cutri, R. M., Aitken, D. K., Jones, B., et al. 1981, ApJ, 245, 818 [NASA ADS] [CrossRef] [Google Scholar]
- de Boer, K. S., Hoekstra, R., van der Hucht, K. A., et al. 1972, A&A, 21, 447 [NASA ADS] [Google Scholar]
- Dermer, C. D., Bland-Hawthorn, J., Chiang, J., & McNaron-Brown, K. 1997, ApJ, 484, L121 [NASA ADS] [CrossRef] [Google Scholar]
- Di Matteo, T., Springel, V., & Hernquist, L. 2005, Nature, 433, 604 [NASA ADS] [CrossRef] [Google Scholar]
- Eales, S. A., & Arnaud, K. A. 1988, ApJ, 324, 193 [NASA ADS] [CrossRef] [Google Scholar]
- Fabian, A. C. 2012, ARA&A, 50, 455 [Google Scholar]
- Fischer, J., Sturm, E., González-Alfonso, E., et al. 2010, A&A, 518, L41 [NASA ADS] [CrossRef] [EDP Sciences] [Google Scholar]
- Gallagher, S. C., Brandt, W. N., Chartas, G., Garmire, G. P., & Sambruna, R. M. 2002, ApJ, 569, 655 [NASA ADS] [CrossRef] [Google Scholar]
- Gaskell, M., Thakur, N., Tian, B., & Saravanan, A. 2022, Astron. Nachr., 343, e210112 [NASA ADS] [CrossRef] [Google Scholar]
- González-Alfonso, E., Fischer, J., Bruderer, S., et al. 2018, ApJ, 857, 66 [Google Scholar]
- Greene, J. E., & Ho, L. C. 2005, ApJ, 630, 122 [NASA ADS] [CrossRef] [Google Scholar]
- Hamilton, D., & Keel, W. C. 1987, ApJ, 321, 211 [NASA ADS] [CrossRef] [Google Scholar]
- Hickox, R. C., & Alexander, D. M. 2018, ARA&A, 56, 625 [Google Scholar]
- Hutchings, J. B., & Neff, S. G. 1987, AJ, 93, 14 [NASA ADS] [CrossRef] [Google Scholar]
- Klöckner, H.-R., Baan, W. A., & Garrett, M. A. 2003, Nature, 421, 821 [CrossRef] [Google Scholar]
- Kovačević, A. B., Yi, T., Dai, X., et al. 2020, MNRAS, 494, 4069 [CrossRef] [Google Scholar]
- Krips, M., Neri, R., García-Burillo, S., et al. 2008, ApJ, 677, 262 [NASA ADS] [CrossRef] [Google Scholar]
- Lai, O., Rouan, D., Rigaut, F., Arsenault, R., & Gendron, E. 1998, A&A, 334, 783 [NASA ADS] [Google Scholar]
- Leighly, K. M., Terndrup, D. M., Baron, E., et al. 2014, ApJ, 788, 123 [NASA ADS] [CrossRef] [Google Scholar]
- Lipari, S., Colina, L., & Macchetto, F. 1994, ApJ, 427, 174 [NASA ADS] [CrossRef] [Google Scholar]
- Lípari, S., Terlevich, R., Zheng, W., et al. 2005, MNRAS, 360, 416 [CrossRef] [Google Scholar]
- Lipari, S., Sanchez, S. F., Bergmann, M., et al. 2009, MNRAS, 392, 1295 [NASA ADS] [CrossRef] [Google Scholar]
- Maloney, P. R., & Reynolds, C. S. 2000, ApJ, 545, L23 [NASA ADS] [CrossRef] [Google Scholar]
- Markarian, B. E. 1969, Astrofizika, 5, 286 [NASA ADS] [Google Scholar]
- Milosavljević, M., & Merritt, D. 2003, ApJ, 596, 860 [Google Scholar]
- Misquitta, P., Bowles, M., Eckart, A., et al. 2020, A&A, 639, A30 [NASA ADS] [CrossRef] [EDP Sciences] [Google Scholar]
- Murray, N., Quataert, E., & Thompson, T. A. 2005, ApJ, 618, 569 [NASA ADS] [CrossRef] [Google Scholar]
- Papadopoulos, P. P., Isaak, K. G., & van der Werf, P. P. 2007, ApJ, 668, 815 [Google Scholar]
- Pfeifle, R. W., Satyapal, S., Manzano-King, C., et al. 2019, ApJ, 883, 167 [Google Scholar]
- Piconcelli, E., Miniutti, G., Ranalli, P., et al. 2013, MNRAS, 428, 1185 [NASA ADS] [CrossRef] [Google Scholar]
- Pogge, R. 2019, https://doi.org/10.5281/zenodo.2550741 [Google Scholar]
- Richards, A. M. S., Knapen, J. H., Yates, J. A., et al. 2005, MNRAS, 364, 353 [NASA ADS] [Google Scholar]
- Rieke, G. H. 1976, ApJ, 210, L5 [NASA ADS] [CrossRef] [Google Scholar]
- Roche, P. F., Aitken, D. K., & Whitmore, B. 1983, MNRAS, 205, 21P [NASA ADS] [CrossRef] [Google Scholar]
- Rupke, D. S. N., & Veilleux, S. 2011, ApJ, 729, L27 [NASA ADS] [CrossRef] [Google Scholar]
- Rupke, D. S., Veilleux, S., & Sanders, D. B. 2005, ApJ, 632, 751 [NASA ADS] [CrossRef] [Google Scholar]
- Ryu, T., Perna, R., Haiman, Z., Ostriker, J. P., & Stone, N. C. 2018, MNRAS, 473, 3410 [Google Scholar]
- Sanders, D. B., Young, J. S., Scoville, N. Z., Soifer, B. T., & Danielson, G. E. 1987, ApJ, 312, L5 [NASA ADS] [CrossRef] [Google Scholar]
- Sanders, D. B., Soifer, B. T., Elias, J. H., et al. 1988a, ApJ, 325, 74 [Google Scholar]
- Sanders, D. B., Soifer, B. T., Elias, J. H., Neugebauer, G., & Matthews, K. 1988b, ApJ, 328, L35 [NASA ADS] [CrossRef] [Google Scholar]
- Soifer, B. T., Neugebauer, G., Matthews, K., et al. 2000, AJ, 119, 509 [Google Scholar]
- Teng, S. H., Brandt, W. N., Harrison, F. A., et al. 2014, ApJ, 785, 19 [Google Scholar]
- Toomre, A., & Toomre, J. 1972, ApJ, 178, 623 [Google Scholar]
- Turner, T. J. 1999, ApJ, 511, 142 [NASA ADS] [CrossRef] [Google Scholar]
- Turner, T. J., & Kraemer, S. B. 2003, ApJ, 598, 916 [NASA ADS] [CrossRef] [Google Scholar]
- van der Werf, P. P., Isaak, K. G., Meijerink, R., et al. 2010, A&A, 518, L42 [NASA ADS] [CrossRef] [EDP Sciences] [Google Scholar]
- Veilleux, S., Cecil, G., & Bland-Hawthorn, J. 2005, ARA&A, 43, 769 [NASA ADS] [CrossRef] [Google Scholar]
- Veilleux, S., Rupke, D. S. N., Kim, D. C., et al. 2009, ApJS, 182, 628 [NASA ADS] [CrossRef] [Google Scholar]
- Veilleux, S., Trippe, M., Hamann, F., et al. 2013, ApJ, 764, 15 [NASA ADS] [CrossRef] [Google Scholar]
- Veilleux, S., Teng, S. H., Rupke, D. S. N., Maiolino, R., & Sturm, E. 2014, ApJ, 790, 116 [NASA ADS] [CrossRef] [Google Scholar]
- Veilleux, S., Meléndez, M., Tripp, T. M., Hamann, F., & Rupke, D. S. N. 2016, ApJ, 825, 42 [NASA ADS] [CrossRef] [Google Scholar]
- Yan, C.-S., Lu, Y., Dai, X., & Yu, Q. 2015, ApJ, 809, 117 [Google Scholar]
- Yang, L., Dai, X., Lu, Y., Zhu, Z.-H., & Shankar, F. 2018, MNRAS, 480, 5504 [NASA ADS] [CrossRef] [Google Scholar]
Appendix A: Emission and absorption lines
Mrk 231 PA 230° offset -2″ emission line data.
Mrk 231 PA 230°offset -2″ absorption line data.
Mrk 231 PA 230°offset +2″ emission line data.
Mrk 231 PA 230°offset +2″ absorption line data.
Mrk 231 PA 265°offset -2″ emission line data.
Mrk 231 PA 265°offset -2″ absorption line data.
Mrk 231 PA 265°offset +2″ emission line data.
Mrk 231 PA 265°offset +2″ absorption line data.
Mrk 231 PA 355°offset -2″ emission line data.
Mrk 231 PA 355°offset -2″ absorption line data.
Mrk 231 PA 355°offset +2″ emission line data.
Mrk 231 PA 355°offset +2″ absorption line data.
Appendix B: Gaussian fits to emission and absorption lines
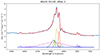 |
Fig. B.1. Zoomed-in view of the spectral decomposition using Gaussian fitting of the Hα line in the averaged one-dimensional observed optical spectrum of the central arcsecond of Mrk 231. Six components were required to get the best fit marked by the solid red line. Dashed blue, black, red, magenta, yellow, and cyan lines show the individual Gaussian components. The aperture size for spectral extraction is 1 arcsec. The wavelength axis (abscissa) depicts the observed wavelength. |
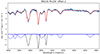 |
Fig. B.2. Zoomed-in view of the spectral decomposition using Gaussian fitting of the absorption lines in the blue channel in the averaged one-dimensional observed optical spectrum of the central arcsecond of Mrk 231. Six components were required to get the best fit marked by the solid red line. Dashed blue, black, red, magenta, yellow, and cyan lines show the individual Gaussian components. The aperture size for spectral extraction is 1 arcsec. The wavelength axis (abscissa) depicts the observed wavelength. |
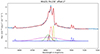 |
Fig. B.3. Zoomed-in view of the spectral decomposition using Gaussian fitting of the Hα line in the averaged one-dimensional observed optical spectrum of the central arcsecond of Mrk 231. Six components were required to get the best fit marked by the solid red line. Dashed blue, black, red, magenta, yellow, and cyan lines show the individual Gaussian components. The aperture size for spectral extraction is 1 arcsec. The wavelength axis (abscissa) depicts the observed wavelength. |
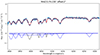 |
Fig. B.4. Zoomed-in view of the spectral decomposition using Gaussian fitting of the absorption lines in the blue channel in the averaged one-dimensional observed optical spectrum of the central arcsecond of Mrk 231. Six components were required to get the best fit marked by the solid red line. Dashed blue, black, red, magenta, yellow, and cyan lines show the individual Gaussian components. The aperture size for spectral extraction is 1 arcsec. The wavelength axis (abscissa) depicts the observed wavelength. |
Appendix C: Broad Hα flux variation
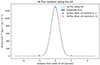 |
Fig. C.1. Broad Hα flux variation along the slit for a PA of 230°overplotted with fluxes of the Hα broad emission line at offsets of -2″ (blue cross) and +2″ (red cross). The observed Hα lines fluxes are higher than expected, with only a contribution from seeing effects. |
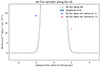 |
Fig. C.2. Zoomed-in view of the broad Hα flux variation along the slit for a PA of 230°overplotted with fluxes of the Hα broad emission line at offsets of -2″ (blue cross) and +2″ (red cross). |
Observed versus expected broad Hα emission line flux at offset positions for a PA of 230°.
All Tables
Observed versus expected broad Hα emission line flux at offset positions for a PA of 230°.
All Figures
|
Fig. 1. SDSS image of Mrk 231. Top: Coloured SDSS image of Mrk 231. Middle: Coloured SDSS image of Mrk 231 overlaid with arbitrarily selected contours. Bottom: SDSS image of Mrk 231 in grey scale, overlaid with the slit positions used during observations. Green marks a PA of 230°, blue marks a PA of 265°, magenta marks a PA of 340°, and red marks a PA of 355°. For PAs 230°, 265°, and 355°, we took off-nuclear spectra at offsets of 2″ to either side of the central slit positions. In both images, north is up and east is to the left. The scale is indicated. |
| In the text | |
|
Fig. 2. Averaged one-dimensional observed optical spectrum of the central arcsecond of Mrk 231. The observed emission lines are marked with vertical dotted red lines, and the vertical dotted blue lines mark absorption lines. The aperture size for spectral extraction is 1″. The wavelength axis depicts the observed wavelength. |
| In the text | |
|
Fig. 3. Spectral decomposition of emission and absorption lines using Gaussian fitting. The aperture size for spectral extraction is 1″. The wavelength axis (abscissa) depicts the observed wavelength. Top: Zoomed-in view of the spectral decomposition using Gaussian fitting of the Hα line in the averaged one-dimensional observed optical spectrum of the central arcsecond of Mrk 231. Six components were required to get the best fit marked by the solid red line. Dashed blue, black, red, magenta, yellow, and cyan lines show the individual Gaussian components. Bottom: Zoomed-in view of the spectral decomposition using Gaussian fitting of the absorption lines in the blue channel in the averaged one-dimensional observed optical spectrum of the central arcsecond of Mrk 231. Six components were required to get the best fit marked by the solid red line. Dashed blue, black, red, magenta, yellow, and cyan lines show the individual Gaussian components. |
| In the text | |
|
Fig. 4. One-dimensional observed optical spectrum of Mrk 231 observed at a PA of 230, with an offset of 2″ to the left of the centre. The observed emission lines are marked by vertical dotted red lines and named. The aperture size for spectral extraction is 1″. The wavelength axis depicts the observed wavelength. |
| In the text | |
|
Fig. 5. One-dimensional observed optical spectrum of Mrk 231 observed at a PA of 265, with an offset of 2″ to the left of the centre. The observed emission lines are marked by vertical dotted red lines and named. The aperture size for spectral extraction is 1″. The wavelength axis depicts the observed wavelength. |
| In the text | |
|
Fig. 6. One-dimensional observed optical spectrum of Mrk 231 observed at a PA of 355, with an offset of 2″ to the right of the centre. The observed emission lines are marked by vertical dotted red lines and named. The aperture size for spectral extraction is 1″. The wavelength axis depicts the observed wavelength. |
| In the text | |
|
Fig. 7. One-dimensional observed optical spectrum of Mrk 231 observed at a PA of 230, with an offset of 2″ to the right of the centre. The observed emission lines are marked by vertical dotted red lines and named. The aperture size for spectral extraction is 1″. The wavelength axis depicts the observed wavelength. |
| In the text | |
|
Fig. 8. One-dimensional observed optical spectrum of Mrk 231 observed at a PA of 265, with an offset of 2″ to the right of the centre. The observed emission lines are marked by vertical dotted red lines and named. The aperture size for spectral extraction is 1″. The wavelength axis depicts the observed wavelength. |
| In the text | |
|
Fig. 9. One-dimensional observed optical spectrum of Mrk 231 observed at a PA of 355, with an offset of 2″ to the left of the centre. The observed emission lines are marked by vertical dotted red lines and named. The aperture size for spectral extraction is 1″. The wavelength axis depicts the observed wavelength. |
| In the text | |
|
Fig. 10. Optical DSS image of Mrk 231 overlaid with arbitrarily selected contours. The green box indicates the field of view of the SDSS survey for comparison with Figure 1 (middle panel). The scale and directions are marked. |
| In the text | |
|
Fig. 11. Optical image of Mrk 231 assembled by rotating and stacking the four acquisition images taken by the LBT prior to the spectroscopy observations. The presence of diffuse emission adjacent to the northern tidal tail and at an angle to it can clearly be seen. The scale and directions are marked. |
| In the text | |
|
Fig. 12. Sketch showing the possible three-galaxy interaction of Mrk 231. The contours and the shaded regions are adapted from the LBT acquisition image (Figure 11). Cyan, yellow, and green arrows indicate the paths followed by the three galaxies. The scale and directions are marked. |
| In the text | |
|
Fig. B.1. Zoomed-in view of the spectral decomposition using Gaussian fitting of the Hα line in the averaged one-dimensional observed optical spectrum of the central arcsecond of Mrk 231. Six components were required to get the best fit marked by the solid red line. Dashed blue, black, red, magenta, yellow, and cyan lines show the individual Gaussian components. The aperture size for spectral extraction is 1 arcsec. The wavelength axis (abscissa) depicts the observed wavelength. |
| In the text | |
|
Fig. B.2. Zoomed-in view of the spectral decomposition using Gaussian fitting of the absorption lines in the blue channel in the averaged one-dimensional observed optical spectrum of the central arcsecond of Mrk 231. Six components were required to get the best fit marked by the solid red line. Dashed blue, black, red, magenta, yellow, and cyan lines show the individual Gaussian components. The aperture size for spectral extraction is 1 arcsec. The wavelength axis (abscissa) depicts the observed wavelength. |
| In the text | |
|
Fig. B.3. Zoomed-in view of the spectral decomposition using Gaussian fitting of the Hα line in the averaged one-dimensional observed optical spectrum of the central arcsecond of Mrk 231. Six components were required to get the best fit marked by the solid red line. Dashed blue, black, red, magenta, yellow, and cyan lines show the individual Gaussian components. The aperture size for spectral extraction is 1 arcsec. The wavelength axis (abscissa) depicts the observed wavelength. |
| In the text | |
|
Fig. B.4. Zoomed-in view of the spectral decomposition using Gaussian fitting of the absorption lines in the blue channel in the averaged one-dimensional observed optical spectrum of the central arcsecond of Mrk 231. Six components were required to get the best fit marked by the solid red line. Dashed blue, black, red, magenta, yellow, and cyan lines show the individual Gaussian components. The aperture size for spectral extraction is 1 arcsec. The wavelength axis (abscissa) depicts the observed wavelength. |
| In the text | |
|
Fig. C.1. Broad Hα flux variation along the slit for a PA of 230°overplotted with fluxes of the Hα broad emission line at offsets of -2″ (blue cross) and +2″ (red cross). The observed Hα lines fluxes are higher than expected, with only a contribution from seeing effects. |
| In the text | |
|
Fig. C.2. Zoomed-in view of the broad Hα flux variation along the slit for a PA of 230°overplotted with fluxes of the Hα broad emission line at offsets of -2″ (blue cross) and +2″ (red cross). |
| In the text | |
Current usage metrics show cumulative count of Article Views (full-text article views including HTML views, PDF and ePub downloads, according to the available data) and Abstracts Views on Vision4Press platform.
Data correspond to usage on the plateform after 2015. The current usage metrics is available 48-96 hours after online publication and is updated daily on week days.
Initial download of the metrics may take a while.