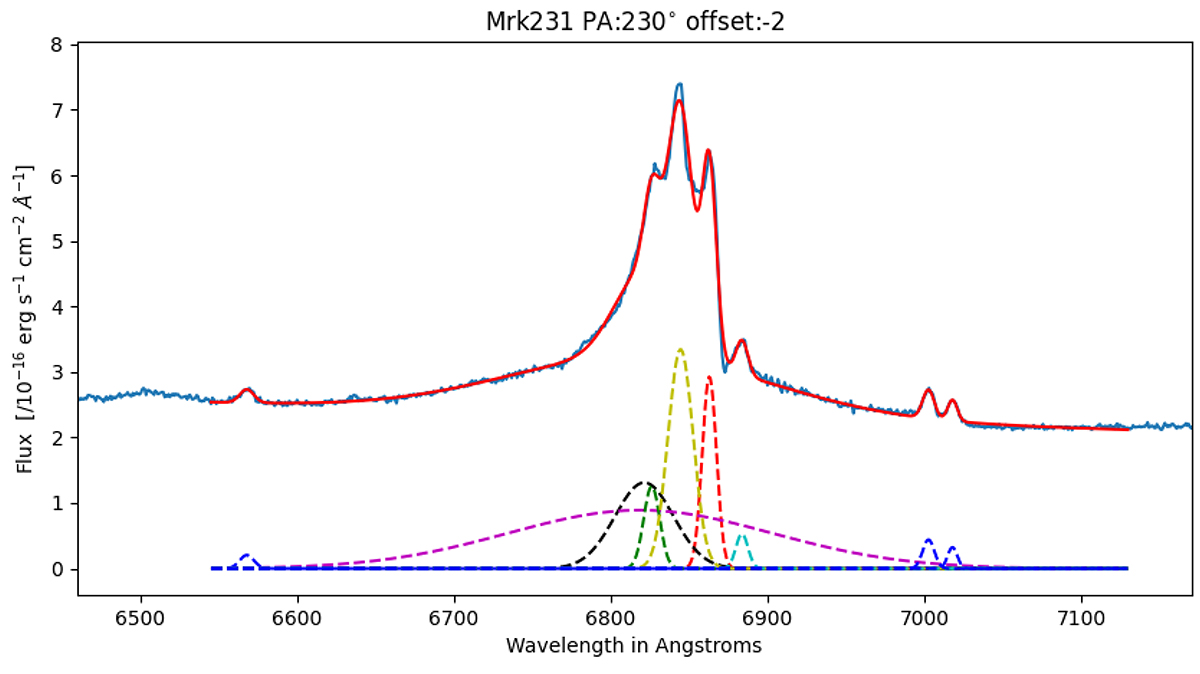
Fig. B.1.
Download original image
Zoomed-in view of the spectral decomposition using Gaussian fitting of the Hα line in the averaged one-dimensional observed optical spectrum of the central arcsecond of Mrk 231. Six components were required to get the best fit marked by the solid red line. Dashed blue, black, red, magenta, yellow, and cyan lines show the individual Gaussian components. The aperture size for spectral extraction is 1 arcsec. The wavelength axis (abscissa) depicts the observed wavelength.
Current usage metrics show cumulative count of Article Views (full-text article views including HTML views, PDF and ePub downloads, according to the available data) and Abstracts Views on Vision4Press platform.
Data correspond to usage on the plateform after 2015. The current usage metrics is available 48-96 hours after online publication and is updated daily on week days.
Initial download of the metrics may take a while.