| Issue |
A&A
Volume 661, May 2022
|
|
|---|---|---|
| Article Number | L7 | |
| Number of page(s) | 6 | |
| Section | Letters to the Editor | |
| DOI | https://doi.org/10.1051/0004-6361/202243574 | |
| Published online | 24 May 2022 | |
Letter to the Editor
The bending of the star-forming main sequence traces the cold- to hot-accretion transition mass over 0 < z < 4
1
CEA, IRFU, DAp, AIM, Université Paris-Saclay, Université Paris Cité, Sorbonne Paris Cité, CNRS, 91191 Gif-sur-Yvette, France
e-mail: edaddi@cea.fr
2
INAF – Osservatorio Astronomico di Brera, Via Brera 28, 20121 Milano, Italy
3
INAF – Osservatorio Astronomico di Roma, Via di Frascati 33, 00078 Monte Porzio Catone, Italy
4
Department of Physics & Astronomy, University of California Los Angeles, 430 Portola Plaza, Los Angeles, CA 90095, USA
5
Purple Mountain Observatory, Chinese Academy of Sciences, 10 Yuanhua Road, Nanjing, 210023, PR China
Received:
17
March
2022
Accepted:
11
May
2022
We analyse measurements of the evolving stellar mass (ℳ0 ) at which the bending of the star-forming main sequence (MS) occurs over 0 < z < 4. We find ℳ0 ≈ 1010 M⊙ over 0 < z < 1 before ℳ0 rises up to ∼1011 M⊙ at z = 2 and then stays flat or slowly increases towards higher redshifts. When converting ℳ0 values into hosting dark matter halo masses, we show that this behaviour is remarkably consistent with the evolving cold- to hot-accretion transition mass, as predicted by theory and defined by the redshift-independent Mshock at z < 1.4 and by the rising Mstream at z ≳ 1.4 (for which we propose a revision in agreement with the latest simulations). We therefore argue that the MS bending is primarily due to a drop in cold accretion, causing a reduction in available cold gas in galaxies, which supports predictions of gas feeding theory. In particular, the rapidly rising ℳ0 with redshift at z > 1 is evidence in favour of the cold-streams scenario. In this picture, a progressive fuelling reduction rather than its sudden suppression in halos more massive than Mshock/Mstream produces a nearly constant star-formation rate in galaxies with stellar masses larger than ℳ0, and not their quenching, which therefore requires other physical processes. Compared to the knee M* in the stellar mass function of galaxies, ℳ0 is significantly lower at z < 1.5, and higher at z > 2, suggesting that the imprint of gas deprivation on the distribution of galaxy masses happened at early times (z > 1.5–2). The typical mass at which galaxies inside the MS become bulge-dominated evolves differently from ℳ0, which is consistent with the idea that bulge formation is a distinct process from the phasing out of cold accretion.
Key words: galaxies: evolution / galaxies: formation / galaxies: star formation / galaxies: halos
© E. Daddi et al. 2022
 Open Access article, published by EDP Sciences, under the terms of the Creative Commons Attribution License (https://creativecommons.org/licenses/by/4.0), which permits unrestricted use, distribution, and reproduction in any medium, provided the original work is properly cited.
This article is published in open access under the Subscribe-to-Open model. Subscribe to A&A to support open access publication.
1. Introduction
One of the key open issues in galaxy formation and evolution is understanding the cold gas feeding of galaxies from the cosmic web, which sustains their star-formation activity. Theory prescribes that cold gas accretes freely onto dark-matter halos with masses of MDM < Mshock ≈ 1011.8 M⊙ at any redshift (Kereš et al. 2005; Dekel & Birnboim 2006; hereafter DB06), and crucially also onto more massive halos at high redshift where cold streams, collimated flows of cold accreting gas, can penetrate efficiently for halos with MDM < Mstream(z) (DB06; Dekel et al. 2009). This Mstream(z) boundary is predicted to lie at ∼1012.5 M⊙ at z = 2, growing to ∼1013.5 M⊙ at z = 3. Observational evidence for cold accretion and for the cold-stream scenario is still scarce.
Recently, Daddi et al. (2022; hereafter D22) reported evidence for a progressive decrease in cold accretion for MDM > Mstream onto massive groups and clusters over 2 < z < 3.3. These authors inferred that the fraction of baryonic accretion rate (BAR) that remains cold scales down like (Mstream/MDM)α, with a slope of α ∼ 1 and no apparent discontinuity up to 2 dex above Mstream. This result was primarily based on the extended Lyα emission luminosities, but slopes consistent with α ∼ 1 appeared to also characterise the star-formation rate (SFR) and bolometric active galactic nucleus (AGN) luminosities integrated over the massive halos. A modulation with a slope of α ∼ 1 implies that any quantity scaling linearly with cold accretion, and thus rising (at fixed redshift) proportionally to MDM for MDM < Mstream (or Mshock), would remain roughly constant at larger MDM > Mstream (see Eqs. (5) and (6) in D22, for Lyα).
It is intriguing that a similar mass dependence has been recognised for the bending of the star-forming main sequence (MS), where SFR rises almost linearly until a certain bending stellar mass (ℳ0), and stays constant at larger masses (e.g., Ilbert et al. 2015; Lee et al. 2015; Schreiber et al. 2015, 2016; Popesso et al. 2019). Accretion rates of cold gas should have a direct impact on the SFRs, and therefore it is quite natural that the distribution of SFRs in galaxies (and the MS) is an important observable, where variations in accretion modes could be detected. Popesso et al. (2019) noticed that the bending mass at z ∼ 0 is similar to the Mshock boundary, once the average stellar to halo mass relation (SHMR) is considered (Behroozi et al. 2013). Bending gets progressively weaker over 1010 M⊙ < M* < 1011 M⊙ at z > 1 (Schreiber et al. 2015; Delvecchio et al. 2021), suggesting that ℳ0 increases strongly with redshift, which is qualitatively similar to the rise in the Mstream boundary. The analogies are strong enough to warrant a quantitative examination.
In this letter we study the relation between ℳ0 and Mshock/Mstream as a function of redshift, showing that they are essentially the same mass scale over 0 < z < 4, and discuss the implications of this coincidence. We adopt concordance cosmology (0.3; 0.7; 70) and a Chabrier IMF.
2. Quantifying the redshift evolution of the bending of the star-forming MS
2.1. Bending formalism
We adopt the parametrisation for describing the MS (SFR vs. stellar mass M*) with its bending1 from Lee et al. (2015, hereafter L15), which we rewrite as:
with ℳ0 being the bending mass, SFR0 the SFR saturation limit for M* ≫ ℳ0, and γ the MS slope in the limit of M* ≪ ℳ0. We note that Eq. (1) implies SFR(ℳ0)/SFR0 = 0.5 for any γ, and therefore the SFR only marginally further rises two-fold beyond ℳ0.
There are strong analogies between Eq. (1) and the formalism from D22 (their Eqs. (1)–(4)) describing quantities scaling in proportion to cold accretion. While in D22 the equations relate to MDM, and here to M*, stellar and dark-matter mass scales are tightly related on average (e.g., Behroozi et al. 2013). Also, the D22 formalism describes a stepwise behaviour across the Mshock/Mstream boundaries (Eq. (3) in D22) while here we have a continuous function (Eq. (1)); but the two can be shown to be fully consistent. We built a simple toy model with the expected behaviour from Eq. (3) in D22, adding appropriate noise in SFR as well as in the SHMR. We find that ℳ0 as defined in Eq. (1) is an unbiased estimator of the stepwise boundary (i.e., Mshock/Mstream) in the presence of noise to better than 0.02 dex.
The fact that Eq. (1) converges to a constant SFR for M* > > ℳ0 is equivalent to αSFR ∼ 1 in D22 (and indeed the key result from D22 was to constrain αLyα ∼ 1). The D22 formalism adopts in practice γ = 1.15 which is inherited by the predicted MDM dependence of the BAR onto DM halos (Goerdt et al. 2010; Genel et al. 2008; Dekel et al. 2013) in the cold-stream or cold-accretion regimes. Indeed, as we see below, the MS also implies γ ∼ 1.1. This analogy between the MS slope and BAR (before bending happens) was previously discussed by Dekel et al. (2013). All of this suggests that, to some extent, ℳ0 might be equivalent to Mshock/Mstream, which we demonstrate empirically below by deriving the redshift evolution of ℳ0 since z = 4 and comparing it to the Mshock/Mstream masses over the same range.
2.2. Redshift evolution of bending
Obtaining reliable fits of the parameters from Eq. (1) requires: (1) a deep sample, reaching much fainter than ℳ0 (at any redshift, which is made easier by the implied redshift evolution of ℳ0). Also, (2) large statistics at the high M* end are required in order to derive SFR0, which demands a large sky area; and (3) the use of consistent SFR indicators across the entire dynamic range. In this work, we do not obtain new MS determinations, something already done in countless literature works (see Speagle et al. 2014 for a review). We adopt average SFR versus stellar mass (M*) measurements from state-of-the-art works (L15; Delvecchio et al. 2021; hereafter D21) spanning (when combined) 0 < z < 4 with large statistics and reaching down to very low stellar masses which is essential for this analysis. These latter two works fulfil the mentioned requirements and are both based in the COSMOS field.
L15 measured the MS over six redshift bins with average z = 0.36–1.19, using approximately 62 000 SF galaxies selected from Ilbert et al. (2013) with the NRK colour method. SFRs are derived using a ladder approach, including ultraviolet (UV), mid-infrared (MIR), and far-infrared (FIR) measurements. The MS of these latter authors was obtained using a very finely binned grid to which they fitted Eq. (1), and report the three free parameters with formal uncertainties from the fit. From their Fig. 6, one can see that their ℳ0 values display a non-monotonous behaviour that is seemingly significant with respect to their reported error bars. For example, ℳ0 significantly decreases from z = 0.34 to 0.51, and jumps up again at z = 0.70–0.99. We take this as evidence of underestimation of the uncertainties, for example due to degeneracies between parameters, and systematic errors. We find that scaling up the uncertainties by a factor of 3.4 is sufficient to remove the anomalous redshift fluctuations. A posteriori based on the minimum reduced χ2 of the fit to all datasets, and also in comparison with the D21 dataset, we confirm that this scaling is indeed required. We apply this to all L15 parameter uncertainties. The L15 results with the proposed error rescaling are summarised in Table 1.
Fitting of the star-forming MS with bending, in different redshift bins.
D21 measured the MS over seven redshift bins with average z = 0.37–3.96, using approximately 400 000 SF galaxies from Laigle et al. (2016) selected with the NRJ colour method (almost identical to the NRK but improving over it for the highest redshift range, implying full consistency with the L15 sample). For each redshift bin, these authors defined large, 0.5 dex-wide stellar mass bins (except for the lowest and highest mass bins that are 1 dex wide), and measured the average SFR via stacking in multi-band far-IR datasets, including Herschel, Spitzer, SCUBA, and AzTEC, and adding the contribution of unobscured UV. Because their binning is wide, to reduce the noise in the measurements we fixed the value of γ = 1.1, which is the average slope obtained by L15 using a much finer grid. Using free γ would not alter the conclusions of this work (and on average would still give a consistent γ ∼ 1.1). We therefore fitted Eq. (1) to the D21 data (Fig. 1) and estimated uncertainties in the best-fitting parameters from Monte Carlo simulations. The measurements are in Table 1.
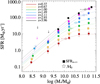 |
Fig. 1. Star-forming MS derived in redshift bins over 0.4 < z < 4.0 (squares) adapted from Delvecchio et al. (2021). Solid lines show fits of Eq. (1) to the data. The bending stellar mass ℳ0 (see text for details) is shown as an empty star for each redshift bin (with its error). We note how it rapidly increases from low- to high redshift. |
The ℳ0 measurements as a function of redshift are shown in the left panel of Fig. 2. Derivations from L15 and D21 are in reasonably good agreement over 0.4 < z < 1.2 where they define an average at the level of ℳ0 ∼ 1010 M⊙. The scatter between the two datasets allows us to gauge the underlying systematic errors. Mainly based on the D21 values, but also supported by the highest redshift point from L15 (z = 1.2), we see that ℳ0 rapidly increases above z = 1, to reach ℳ0 ∼ 1011 M⊙ at z ≳ 2.
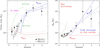 |
Fig. 2. Measurements of ℳ0 are shown in both panels from L15 (empty squares) and D21 (filled circles), together with the Mshock and Mstream boundaries (DB06, solid blue line; from our fit to the ℳ0 data as in Eq. (2), dashed blue line; based on Mandelker et al. 2020a,b, dotted blue line), and stellar mass function (SMF) M* values (Ilbert et al. 2013; linear fit to their redshift trends; solid for the total, dotted for those of quiescent and SF galaxies that are decreasing and increasing with redshift, respectively). The masses at which the average bulge/total (B/T) ratio in MS galaxies rises above 0.2 and 0.4 are based on Dimauro et al. (2022; green long-dashed). Measurements and relations are converted from stellar to halo masses (and vice versa) using the SHMRs from Behroozi et al. (2013). In doing this, we ignore the possible difference between the direct and inverse SHMR, which could have some impact at the highest masses (Ginzburg et al., in prep.). The effect of varying the SHMR by ±0.1 dex is shown by the thinner version of the DB06 tracks. This is larger than the statistical uncertainties on the best measurements (e.g., Shuntov et al. 2022) on average, but is required to encompass systematic errors from different methods (e.g., Behroozi et al. 2019). |
2.3. Bending in halo mass space
We convert each ℳ0 measurement into the corresponding average MDM value using the redshift-dependent relations from Behroozi et al. (2013; left panel of their Fig. 7). Such relations are defined for central galaxies in each halo, or recently accreted satellites, but can be applied safely here because the vast majority of galaxies over the stellar mass ranges considered here are centrals (Popesso et al. 2019; McCracken et al. 2015). The right panel of Fig. 2 shows the evolution of ℳ0 when expressed in terms of average hosting DM halo mass. At z < 1, the typical ℳ0 corresponds to ∼4–8 × 10¹¹ M⊙, which is quite consistent with Mshock. Beyond z ∼ 1 we see a rise until reaching ℳ0 ∼ 1013 − 14 M⊙ over 2 < z < 4. This rise follows the redshift dependence of Mstream very closely and is relatively consistent with its definition from DB06. The ℳ0 values expressed in terms of MDM display large uncertainties at high masses and redshifts because of the flattening of the M*/MDM relation at M* ≳ 1011 M⊙ (Behroozi et al. 2013). This means that even relatively small uncertainties in M* convert into large uncertainties in MDM. To cope with this issue, in the left panel of Fig. 2 we show the Mshock and Mstream tracks converted from dark matter to stellar masses in the same way. ℳ0 measurements are in good agreement with Mstream expectations at z ≳ 2.
3. Refining the Mstream boundary
From Fig. 2 it is apparent that ℳ0 and Mshock/Mstream are almost the same scale. However, there is a small discrepancy in the range 1 < z < 1.4 due to the fact that ℳ0 rises up earlier than Mstream, as originally predicted in DB06. As discussed at length in Dekel et al. (2009), the Mstream boundary was defined using ad hoc assumptions, and its location would benefit from being refined by observations.
We use the evolving ℳ0 data to find the best-fitting Mstream(z) relation, allowing its low-redshift intercept zstream, min and its slope to be free parameters (while keeping Mshock fixed at the DB06 value for z < zstream, min). The best-fitting relation is

and is shown in Fig. 2 as a dashed blue line. The best fit has  with 11 d.o.f, which has a 10% probability of occurring by chance (hence acceptable), showing that the error bars from our measurements are not severely underestimated. The two free parameters are somewhat correlated, in the sense that a higher zstream, min corresponds to a steeper relation. This relation has a lower zstream, min (0.9 vs. 1.4) and a flatter slope (0.67 vs. 1.11) with respect to the one from DB06 (see Eq. (2) in D22), which is a poorer representation of the ℳ0 data. Evidence for a flatter Mstream slope is even stronger when adopting the latest SHMR derivations at z > 2 from Shuntov et al. (2022).
Quite interestingly, if we were to adopt Eq. (2) as a definition of Mstream and repeat the analysis from D22 based on observations of nine massive groups and clusters of galaxies at 2 < z < 3.3, we find overall improvement in the significance of the D22 results. For example, the Lyα luminosities would provide αLyα = 1.05 ± 0.18 (5.8σ vs. 5.0σ in D22) with a scatter of 0.28 dex (0.30 dex in D22). Similarly, the correlation with the integrated SFRs would reach 2.9σ (vs. 2.6σ in D22), with a scatter of 0.43 dex (vs. 0.45 dex). There is therefore encouraging and independent observational support that this revised relation could be more accurate than previous versions.
Present-day numerical simulations and analytical work suggest that a crucial process in the cold-stream feeding of cold gas to halos and galaxies is the cooling of hot halo gas through the radiative turbulent mixing layer that forms at the boundary between the initially cold stream and the initially hot background circumgalactic medium (CGM; Mandelker et al. 2020a; Gronke & Oh 2020; Fielding et al. 2020). The survival of the streams to hydrodynamical instabilities in the CGM until reaching the central galaxy requires that the cooling time in the mixing layer be significantly shorter than the disruption time, especially in highly turbulent environments such as the CGM (Gronke et al. 2022). This can equivalently be expressed as a requirement that the stream radius (Rs) be larger than the critical radius (Rcrit) by a substantial factor (Gronke & Oh 2020; Kanjilal et al. 2021; Mandelker et al. 2020b). Defining Mstream(z) as the locus where Rs/Rcrit = 20 from the fiducial model in Mandelker et al. (2020b; see their Fig. 2 where this ratio is expressed as a function of MDM and z) returns the blue dotted line shown in Fig. 2, which is in striking agreement with the ℳ0(z) data and our Mstream(z) refinement (Eq. (2)).
4. Discussion
The Mshock/Mstream boundaries mark, as a function of redshift, the critical masses at which cold accretion is expected to subside and turn into hot accretion based on theory predictions. Figure 2 shows that these mass scales are in good agreement with ℳ0(z), the mass at which the MS is bending, over 0 < z < 42. This is unlikely to happen by chance, given the complex redshift dependence. Also, there is a fairly reasonable physical explanation for this coincidence: when cold accretion starts to be reduced, becoming an increasingly small fraction of the total baryonic accretion, less fuel is available to galaxies to form stars, and therefore the SFRs of such massive galaxies deviate from the SFR–M* trend defined by lower mass galaxies, as advocated in gas-regulator models (e.g., Bouché et al. 2010; Lilly et al. 2013). The lower gas fraction of galaxies above ℳ0 is implied by the constancy of the star-formation efficiency vs. mass across the Mshock/Mstream boundary (e.g., Wang et al. 2022). The main consequence of this coincidence between ℳ0 and Mshock/Mstream is therefore that it appears inevitable to conclude that the bending of the MS through cosmic time is primarily due to the phasing out of cold accretion. Additionally, this allows us to go a step further, and notice that the physical consequence of the phasing out of cold accretion is to produce a flat SFR–M* relation, reaching constant SFR versus M* as an asymptotic value (SFR0). This is equivalent to saying, formally, that α ∼ 1 (see Sect. 1 and D22; this will include residual cold accretion and contributions from hot gas cooling). A constant SFR versus M*, and at fairly high values, is still a relevant amount of activity, which is at odds with the often-held conception that the shutting down of cold accretion beyond the Mshock/Mstream boundary induces quenching. We reiterate that quenched galaxies are defined as those with very low amounts of residual SFR, that is, much lower than that of the MS (including its bending).
A slope of α ∼ 1 implies, for example, that a halo with a mass of ten times the boundary has a cold share of accretion of 10% of the total (Eq. (3) in D22). However, such a halo has a total accretion that is ten times greater than a halo at the boundary (Eq. (1) in D22). Ultimately, the cold accretion rate remains constant at any halo mass above the boundary. Hence, even when cold accretion is strongly reduced in its effective fraction, in the range of masses that we have been probing, it is not reduced in absolute scale, preventing galaxies from becoming quenched. The obvious consequence of this is that there is no such thing as starvation from discontinuation of cold-gas accretion, at least not in the typical ranges that we have probed (up to 1 dex above ℳ0 at z < 1 from this work, and up to 2 dex above Mstream at z ∼ 2 from Lyα in D22); cold gas shut down is not sufficient for galaxies to starve to death. Physical processes other than the shutting down of cold accretion are required to quench galaxies. This might well be mergers (e.g., Puglisi et al. 2021), or be driven by an AGN (e.g., Brusa et al. 2018) or instability (e.g., Kalita et al. 2022).
We exclude the possibility that cold accretion contraction in the hot-accretion regime induces lots of real quenching, but those galaxies escape from our sample due to selection effects. While this might be suspected, as by construction we study only SF galaxies, at the masses where ℳ0 occurs, the SF galaxies are much more numerous than quiescent ones over the whole redshift range studied (Ilbert et al. 2013; their Fig. 6).
In order to further gauge the significance of our results, it is worth comparing ℳ0 to the characteristic ‘knee’ masses (M*) in the galaxy stellar mass functions (SMFs), representing the mass at which the differential mass (and SFR) contribution peaks, and the mass above which galaxies become exponentially rarer. These are shown as magenta lines in Fig. 2 (including the total SMF, and SMFs for quiescent and SF galaxies). At z < 1.5, M* in the SMF is always much more massive than the bending mass, while at z ≳ 2 it is less massive. Hence, the cold-accretion to hot-accretion transition does not appear to relate in any simple way to M* in the SMF of galaxies, and the definition of ‘typical’ galaxy stellar masses. However, the M* for SF galaxies does decrease mildly with cosmic time, possibly influenced by the similar decrease in ℳ0. As stars in quenched galaxies observed at z ∼ 0–1 are very old, and formed at early times, this supports the idea that the imprint of the downfall of gas accretion onto the SMF of these galaxies also happened at early times (z > 1.5–2); this is because the reduction in accretion will reduce the ability of galaxies to become much more massive. The M* for quenched galaxies runs almost perpendicular to ℳ0, increasing with cosmic time towards low redshift, emphasising furthermore the poor causal connection between the build-up of quenched galaxies and the presence or suppression of cold accretion. This is consistent with the recent finding by Kalita et al. (2021) of an extremely old quenched galaxy in the cold-gas-rich RO-1001 environment (Daddi et al. 2021), and in general with the presence of quenched galaxies at ≳3–4 (Valentino et al. 2020; D’Eugenio et al. 2020; D’Eugenio et al. 2021; Forrest et al. 2020).
It has often been remarked that galaxies more massive than the MS bending host increasingly more massive bulges, to the extent that considering only the disk-like components and ascribing to them the SFR, one gets closer to a rising trend in the MS (Abramson et al. 2014; Mancini et al. 2019; Dimauro et al. 2022). It is worth reconsidering this matter here, in light of our systematic discussion of the evolution of ℳ0. We use the results of Dimauro et al. (2018, 2019, 2022), who performed bulge–disk decomposition in 0 < z < 2 galaxies in CANDELS using a machine learning approach to identify bulge+disk systems. Limiting the results to colour-selected SF galaxies as in this letter, we can derive the stellar masses along the MS at which the average bulge/total (B/T) mass fraction in galaxies exceeds 0.2 and 0.4 (Fig. 2). The B/T = 0.4 threshold is generally much higher than ℳ0, although getting closer to it towards z = 0. It is clear that most of the mass in MS galaxies is contained in the disk, even well beyond ℳ0, but the bulge fraction continues to increase with time, probably due to the hierarchical assembly of the bulges, and possibly rejuvenation (e.g., Mancini et al. 2019). The B/T = 0.2 threshold is closer to ℳ0 over 0 < z < 2, though it still has a distinct rise with redshift that is incompatible with the constant Mshock boundary. It therefore appears that the growth of the bulges has little in common with the phasing out of cold accretion, as might be reasonably expected because the high Sersic indices of bulges require more than the simple removal of gas infall, but likely mergers. This conclusion is supported by the analysis in Freundlich et al. (2019) where no connection between gas scaling relations and morphology was detected. It is tantalising though that the B/T = 0.4 trend mimics the Mstream trend quite closely but shifted roughly by Δz ∼ 1 to later times. This shift might track the required timescale between the formation of bulge stars and the assembly and quenching of those same bulges.
The location of the maximum in the stellar-to-halo-mass relation ( ; e.g., Behroozi et al. 2013) can also be affected by the accretion history of galaxies. The best current determinations show that this is consistently more massive than ℳ0 by 0.3–0.5 dex over 0.3 < z < 1.5 where it is most accurately determined (e.g., Legrand et al. 2019; Shuntov et al. 2022), but possibly consistent at z > 2. More generally, our formalism with α = 1 implies that, beyond ℳ0, differential growth rates produce asymptotically M*/MDM ∝ log MDM/MDM, which is similar to the observed SHMRs at the highest masses, namely MDM > 1013 M⊙. This is still consistent with the idea that feedback from star formation has a dominant role in shaping the M*/MDM relation, particularly at intermediate and low masses (
 ) and at later epochs.
The slope of the MS has been generally reported to be in the range of 0.5–0.9 (Speagle et al. 2014 for a review), which is shallower than the dependence of BAR on the mass, which reads 1.15 (e.g., Dekel et al. 2013). However, the observational measurements are affected by the bending of the MS. The limiting slope at low masses would be a better means of comparison, and this is indeed typically > 1 (on average 1.1 in L15, which is remarkably close to the expected theoretical value). In addition, the redshift evolution rate in the normalisation of the MS has been estimated to be within the range (1 + z)2.8 − 3.5 (Speagle et al. 2014 for a review), which is much faster than the exponent of 2.25–2.5 expected from theory. Again, this is typically derived at M* ∼ 5 × 10¹⁰ M⊙, where all the values at z < 2 are strongly affected by bending, producing a spuriously fast evolution. When considering the MS bending, the overall behaviour of the MS seems to be in much better agreement with theory than previously found. The rise in ℳ0 aligned to that of Mstream is also further confirmation of the cold-stream theory, as discussed in this work.
In conclusion, together with the results from D22, the evidence is accumulating that cold streams (or their modulation) have a measurable impact on galaxy formation and evolution. Systematically investigating the physical properties of galaxies above and below ℳ0(z) will shed further light on the processes by which accretion from the cosmic web affects galaxies.
Recently, Popesso et al. (2022) reached, independently, a consistent conclusion.
Acknowledgments
We thank Nir Mandelker for providing us with a current theory-based derivation of Mstream based on his recent work and, together with Avishai Dekel, for helpful discussions. The anonymous referee is acknowledged for a constructive report.
References
- Abramson, L. E., Kelson, D. D., Dressler, A., et al. 2014, ApJ, 785, L36 [NASA ADS] [CrossRef] [Google Scholar]
- Behroozi, P. S., Wechsler, R. H., & Conroy, C. 2013, ApJ, 770, 57 [NASA ADS] [CrossRef] [Google Scholar]
- Behroozi, P., Wechsler, R. H., Hearin, A. P., & Conroy, C. 2019, MNRAS, 488, 3143 [NASA ADS] [CrossRef] [Google Scholar]
- Bouché, N., Dekel, A., Genzel, R., et al. 2010, ApJ, 718, 1001 [Google Scholar]
- Brusa, M., Cresci, G., Daddi, E., et al. 2018, A&A, 612, A29 [NASA ADS] [CrossRef] [EDP Sciences] [Google Scholar]
- Daddi, E., Valentino, F., Rich, R. M., et al. 2021, A&A, 649, A78 [NASA ADS] [CrossRef] [EDP Sciences] [Google Scholar]
- Daddi, E., Rich, R. M., Valentino, F., et al. 2022, ApJ, 926, L21 [NASA ADS] [CrossRef] [Google Scholar]
- Dekel, A., & Birnboim, Y. 2006, MNRAS, 368, 2 [NASA ADS] [CrossRef] [Google Scholar]
- Dekel, A., Zolotov, A., Tweed, D., et al. 2009, Nature, 457, 451 [NASA ADS] [CrossRef] [Google Scholar]
- Dekel, A., Zolotov, A., Tweed, D., et al. 2013, MNRAS, 435, 999 [Google Scholar]
- Delvecchio, I., Daddi, E., Sargent, M. T., et al. 2021, A&A, 647, A123 [NASA ADS] [CrossRef] [EDP Sciences] [Google Scholar]
- D’Eugenio, C., Daddi, E., Gobat, R., et al. 2020, ApJ, 892, L2 [Google Scholar]
- D’Eugenio, C., Daddi, E., Gobat, R., et al. 2021, A&A, 653, A32 [NASA ADS] [CrossRef] [EDP Sciences] [Google Scholar]
- Dimauro, P., Huertas-Company, M., Daddi, E., et al. 2018, MNRAS, 478, 5410 [Google Scholar]
- Dimauro, P., Huertas-Company, M., Daddi, E., et al. 2019, MNRAS, 489, 4135 [NASA ADS] [CrossRef] [Google Scholar]
- Dimauro, P., Daddi, E., Shankar, F., et al. 2022, MNRAS, 513, 256 [NASA ADS] [CrossRef] [Google Scholar]
- Fielding, D. B., Tonnesen, S., DeFelippis, D., et al. 2020, ApJ, 903, 32 [NASA ADS] [CrossRef] [Google Scholar]
- Forrest, B., Marsan, Z. C., Annunziatella, M., et al. 2020, ApJ, 903, 47 [NASA ADS] [CrossRef] [Google Scholar]
- Freundlich, J., Combes, F., Tacconi, L. J., et al. 2019, A&A, 622, A105 [NASA ADS] [CrossRef] [EDP Sciences] [Google Scholar]
- Genel, S., Genzel, R., Bouché, N., et al. 2008, ApJ, 688, 789 [NASA ADS] [CrossRef] [Google Scholar]
- Goerdt, T., Dekel, A., Sternberg, A., et al. 2010, MNRAS, 407, 613 [Google Scholar]
- Gronke, M., & Oh, S. P. 2020, MNRAS, 492, 1970 [Google Scholar]
- Gronke, M., Oh, S. P., Ji, S., & Norman, C. 2022, MNRAS, 511, 859 [NASA ADS] [CrossRef] [Google Scholar]
- Ilbert, O., McCracken, H. J., Le Fèvre, O., et al. 2013, A&A, 556, A55 [NASA ADS] [CrossRef] [EDP Sciences] [Google Scholar]
- Ilbert, O., Arnouts, S., Le Floc’h, E., et al. 2015, A&A, 579, A2 [NASA ADS] [CrossRef] [EDP Sciences] [Google Scholar]
- Kalita, B. S., Daddi, E., D’Eugenio, C., et al. 2021, ApJ, 917, L17 [NASA ADS] [CrossRef] [Google Scholar]
- Kalita, B. S., Daddi, E., Bournaud, F., et al. 2022, A&A, submitted [Google Scholar]
- Kanjilal, V., Dutta, A., & Sharma, P. 2021, MNRAS, 501, 1143 [Google Scholar]
- Kereš, D., Katz, N., Weinberg, D. H., & Davé, R. 2005, MNRAS, 363, 2 [Google Scholar]
- Laigle, C., McCracken, H. J., Ilbert, O., et al. 2016, ApJS, 224, 24 [Google Scholar]
- Lee, N., Sanders, D. B., Casey, C. M., et al. 2015, ApJ, 801, 80 [Google Scholar]
- Legrand, L., McCracken, H. J., Davidzon, I., et al. 2019, MNRAS, 486, 5468 [NASA ADS] [CrossRef] [Google Scholar]
- Lilly, S. J., Carollo, C. M., Pipino, A., et al. 2013, ApJ, 772, 119 [NASA ADS] [CrossRef] [Google Scholar]
- Mancini, C., Daddi, E., Juneau, S., et al. 2019, MNRAS, 489, 1265 [Google Scholar]
- Mandelker, N., Nagai, D., Aung, H., et al. 2020a, MNRAS, 494, 2641 [Google Scholar]
- Mandelker, N., van den Bosch, F. C., Nagai, D., et al. 2020b, MNRAS, 498, 2415 [Google Scholar]
- McCracken, H. J., Wolk, M., Colombi, S., et al. 2015, MNRAS, 449, 901 [NASA ADS] [CrossRef] [Google Scholar]
- Popesso, P., Concas, A., Morselli, L., et al. 2019, MNRAS, 483, 3213 [Google Scholar]
- Popesso, P., Concas, A., Cresci, G., et al. 2022, MNRAS, submitted [arXiv:2203.10487] [Google Scholar]
- Puglisi, A., Daddi, E., Brusa, M., et al. 2021, Nat. Astron., 5, 319 [Google Scholar]
- Schreiber, C., Pannella, M., Elbaz, D., et al. 2015, A&A, 575, A74 [NASA ADS] [CrossRef] [EDP Sciences] [Google Scholar]
- Schreiber, C., Elbaz, D., Pannella, M., et al. 2016, A&A, 589, A35 [NASA ADS] [CrossRef] [EDP Sciences] [Google Scholar]
- Shuntov, M., McCracken, H. J., Gavazzi, R., et al. 2022, ArXiv e-prints [arXiv:2203.10895] [Google Scholar]
- Speagle, J. S., Steinhardt, C. L., Capak, P. L., & Silverman, J. D. 2014, ApJS, 214, 15 [Google Scholar]
- Valentino, F., Tanaka, M., Davidzon, I., et al. 2020, ApJ, 889, 93 [Google Scholar]
- Wang, T.-M., Magnelli, B., Schinnerer, E., et al. 2022, A&A, 660, A142 [NASA ADS] [CrossRef] [EDP Sciences] [Google Scholar]
All Tables
All Figures
|
Fig. 1. Star-forming MS derived in redshift bins over 0.4 < z < 4.0 (squares) adapted from Delvecchio et al. (2021). Solid lines show fits of Eq. (1) to the data. The bending stellar mass ℳ0 (see text for details) is shown as an empty star for each redshift bin (with its error). We note how it rapidly increases from low- to high redshift. |
| In the text | |
|
Fig. 2. Measurements of ℳ0 are shown in both panels from L15 (empty squares) and D21 (filled circles), together with the Mshock and Mstream boundaries (DB06, solid blue line; from our fit to the ℳ0 data as in Eq. (2), dashed blue line; based on Mandelker et al. 2020a,b, dotted blue line), and stellar mass function (SMF) M* values (Ilbert et al. 2013; linear fit to their redshift trends; solid for the total, dotted for those of quiescent and SF galaxies that are decreasing and increasing with redshift, respectively). The masses at which the average bulge/total (B/T) ratio in MS galaxies rises above 0.2 and 0.4 are based on Dimauro et al. (2022; green long-dashed). Measurements and relations are converted from stellar to halo masses (and vice versa) using the SHMRs from Behroozi et al. (2013). In doing this, we ignore the possible difference between the direct and inverse SHMR, which could have some impact at the highest masses (Ginzburg et al., in prep.). The effect of varying the SHMR by ±0.1 dex is shown by the thinner version of the DB06 tracks. This is larger than the statistical uncertainties on the best measurements (e.g., Shuntov et al. 2022) on average, but is required to encompass systematic errors from different methods (e.g., Behroozi et al. 2019). |
| In the text | |
Current usage metrics show cumulative count of Article Views (full-text article views including HTML views, PDF and ePub downloads, according to the available data) and Abstracts Views on Vision4Press platform.
Data correspond to usage on the plateform after 2015. The current usage metrics is available 48-96 hours after online publication and is updated daily on week days.
Initial download of the metrics may take a while.