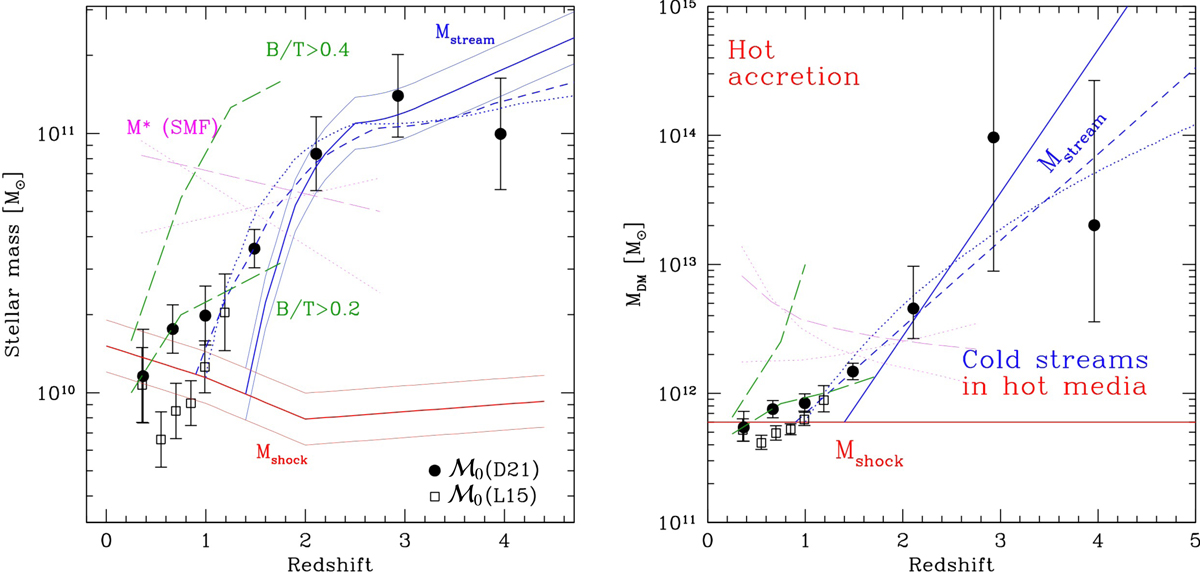
Fig. 2.
Download original image
Measurements of ℳ0 are shown in both panels from L15 (empty squares) and D21 (filled circles), together with the Mshock and Mstream boundaries (DB06, solid blue line; from our fit to the ℳ0 data as in Eq. (2), dashed blue line; based on Mandelker et al. 2020a,b, dotted blue line), and stellar mass function (SMF) M* values (Ilbert et al. 2013; linear fit to their redshift trends; solid for the total, dotted for those of quiescent and SF galaxies that are decreasing and increasing with redshift, respectively). The masses at which the average bulge/total (B/T) ratio in MS galaxies rises above 0.2 and 0.4 are based on Dimauro et al. (2022; green long-dashed). Measurements and relations are converted from stellar to halo masses (and vice versa) using the SHMRs from Behroozi et al. (2013). In doing this, we ignore the possible difference between the direct and inverse SHMR, which could have some impact at the highest masses (Ginzburg et al., in prep.). The effect of varying the SHMR by ±0.1 dex is shown by the thinner version of the DB06 tracks. This is larger than the statistical uncertainties on the best measurements (e.g., Shuntov et al. 2022) on average, but is required to encompass systematic errors from different methods (e.g., Behroozi et al. 2019).
Current usage metrics show cumulative count of Article Views (full-text article views including HTML views, PDF and ePub downloads, according to the available data) and Abstracts Views on Vision4Press platform.
Data correspond to usage on the plateform after 2015. The current usage metrics is available 48-96 hours after online publication and is updated daily on week days.
Initial download of the metrics may take a while.