| Issue |
A&A
Volume 654, October 2021
|
|
|---|---|---|
| Article Number | A74 | |
| Number of page(s) | 10 | |
| Section | Atomic, molecular, and nuclear data | |
| DOI | https://doi.org/10.1051/0004-6361/202140891 | |
| Published online | 13 October 2021 | |
Multiple photoionization for the K shell in the Fe atom★
Institute of Theoretical Physics and Astronomy, Vilnius University,
Saulėtekio av. 3,
10257
Vilnius,
Lithuania
e-mail: This email address is being protected from spambots. You need JavaScript enabled to view it.
Received:
26
March
2021
Accepted:
3
September
2021
Abstract
Multiple photoionization for the K shell in the Fe atom is studied for all levels of the ground configuration. The study shows that sextuple-photoionization cross sections dominate for all levels of the 3d64s2 configuration. The cross sections strongly depend on the initial level for which the photoionization is investigated. The partial photoionization cross sections to the configurations of the produced ions are determined. The main sequences of the radiative and Auger cascade following the photoionization of the K shell in the Fe atom are identified. Presented ion yields for subconfigurations and levels are compared with the previous calculations for configuration averages, revealing that they strongly overestimate ion yields for the Fe7+–Fe10+ ions.
Key words: atomic data / atomic processes
The photoionization cross sections tables are only available at the CDS via anonymous ftp to cdsarc.u-strasbg.fr (130.79.128.5) or via http://cdsarc.u-strasbg.fr/viz-bin/cat/J/A+A/654/A74
© ESO 2021
1 Introduction
The secrets of the universe are mostly revealed to us from the interaction of the electromagnetic radiation with matter. Emission spectra deliver crucial information regarding environments in the remote celestial objects. The relative intensities of the spectral lines are determined by the charge-state distribution in plasma. Photoionization and recombination processes define charge-state distribution in the photoionized plasmas. The photoionized plasmas were observed in diffuse sources (stellar or interstellar gas, supernova remnants) and around compact objects (black holes, neutron stars) (see, e.g., Watanabe et al. 2006; Temple et al. 2020; Schulz et al. 2020). Lasers or magnetic pinch machines also provided ideal opportunities to study photoionized plasmas in laboratories (see, e.g., Foord et al. 2006; Hall et al. 2014; Saber et al. 2017; Loisel et al. 2017; White et al. 2018).
Interaction of atoms and ions with high-energy photons can produce excited atomic systems with removed electrons from any inner shell. The energies of the photons define how deep the inner-shell vacancies can be created. Even the lowest electron shells of atoms and ions can be reached in the photoionization process. For example, spectra from the active galactic nuclei show absorption lines from the K shells in the Fe ions (Iwasawa et al. 2012; Fukazawa et al. 2016). Decay of the inner-shell vacancy leads to radiative and Auger cascades. The ions in various charge states can be produced in the cascade. This determines a multiple-photoionization process by a single photon.
Studying the radiative and Auger cascade is more complicated for vacancies in the deep electronic shells than in the shallow shells. Previous studies of the radiative and Auger cascades mainly dealt with the shells close to the valence electrons (see, e.g., Verhoef et al. 2011; Palaudoux et al. 2015; Khalal et al. 2017). This can be explained by the complexity of a problem when thousands or even millions of transitions have to be evaluated for the deep shell decays (Kučas et al. 2020b). The problem can be overcome by considering the transitions among configuration averages (Opendak 1990; Kaastra & Mewe 1993; Jonauskas et al. 2000, 2003). Previously, the average characteristics of the configurations (Kučas & Karazija 1993) and Auger transitions (Kučas et al. 1995) were used to calculate cascades in Eu (Jonauskas et al. 2000) and Xe (Jonauskas et al. 2003). However, the decay of the inner-shell vacancy leads to many overlapping energy levels of the configurations for neighboring ions. A similar situation occurs for configurations connected by radiative transitions. Therefore, level-to-level studies are often required to provide more reliable data for the multiple-photoionization processes produced by high-energy photons.
The aim of this paper is to study multiple-photoionization process for the levels of the Fe atom by considering a creation of the K-shell vacancy. The multiple photoionization obtained for the K-shell vacancy was studied previously in the Fe2+ ion (Kučas et al. 2020b). The study demonstrated that ions up to Fe8+ can be produced by interactions with photons. The previous studies for the K-vacancy states in the iron ions analyzed atomic data, such as energy levels, wavelengths, A-values, Auger rates, radiative and Auger widths, fluorescence yields, and ion yields (see, e.g., Jacobs & Rozsnyai 1986; Opendak 1990; Kaastra & Mewe 1993; Bautista et al. 2003, 2004; Palmeri et al. 2003; Kallman et al. 2004; Deprince et al. 2019, 2020). Furthermore, calculations of the photoabsorption and photoionization cross sections were performed using the Breit-Pauli R-matrix method (Bautista et al. 2004). Emission and absorption spectra of the K lines were investigated for equilibrium photoionized plasmas (Kallman et al. 2004). The charge-state distribution produced by the photoionization was taken from configuration average calculations (Kaastra & Mewe 1993). Recent studies of atomic characteristics for the K lines of the iron ions were extended by analyzing plasma-environment effects (Deprince et al. 2019, 2020).
In the past all steps of the radiative and Auger cascade following the K-shell vacancy creation in the Fe atom were analyzed only by considering transitions among average energies of configurations (Kaastra & Mewe 1993). The fluorescence yield and charge distribution were calculated with the energy levels of the subshells taken from data provided by Lotz (Lotz 1967, 1968). However, the energies of the subshells were modified to account for the effective charges experienced by electrons due to presence of the vacancies (Kaastra & Mewe 1993). This often led to overestimated ion yields for the higher ionization stages (Kučas et al. 2020a,b; Schippers et al. 2021). In this paper, we give results obtained via more consistent calculations.
The paper is organized as follows. Section 2 presents a brief outline of the theoretical approach. In Sect. 3, the obtained results are discussed. Finally, we end with the conclusions from the present investigation in Sect. 4.
2 Theoretical approach
The flexible atomic code (FAC) (Gu 2008), which implements the Dirac–Fock–Slater (DFS) approach, is used to calculate energy levels, and radiative and Auger transition probabilities in the single-configuration approximation. Multiple-photoionization cross sections are studied for all levels of the ground configuration of the Fe atom.
The interaction of photons with the Fe atom leads to the K-shell vacancy:
 (1)
(1)
The study of the multiple-photoionization process includes 293 configurations (Fe+: 5, Fe2+: 22, Fe3+: 52, Fe4+: 75, Fe5+: 51, Fe6+: 53, Fe7+: 28, and Fe8+: 7 configurations). The total number of energy levels is 257 301 in this study.
The multiple-photoionization process is evaluated by considering single-photoionization with the following transfer of population from the levels of configuration with vacancy in the K shell (Eq. (1)). Multiple-photoionization cross sections from state i of the Fe atom to the final state j of the Feq+ ion are expressed as
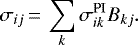 (2)
(2)
Here, summation runs through all 63 states of the 1s3d64s2 configuration for the Fe+ ion. The branching ratios Bkj are obtained by solving equations for every k and j state. The single-photoionization cross sections are defined as
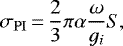 (3)
(3)
where S is the generalized line strength, α is the fine structure constant, gi is the statistical weight of the initial bound state, and ω is the photon energy. The generalized line strength is expressed by the matrix element of the electric dipole operator D = ∑iri (the sum is over the number of electrons):
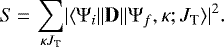 (4)
(4)
Here κ is the relativistic quantum number of the continuum electron, JT is the total angular momentum, and Ψi and Ψf are the wavefunctions for the atom and ion bound states, respectively.
The decay of the configuration with K-shell vacancy leads to radiative and Auger cascades. The partial gain of population nif for the level f from the level i is determined by radiative and Auger transitions
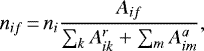 (5)
(5)
where nf (ni) is the population of the level f (i), Aif is a probability of the radiative or Auger transition, and  and
and  are respectively the probabilities of the radiative and Auger transitions. The denominator in Eq. (5) corresponds to the total probability of the level i to decay through the radiative and Auger transitions. An inverse of this quantity corresponds to the lifetime of the level i. The total population nf gained for the level f is obtained by taking the sum over the levels i in Eq. (5). The sequence of the radiative and Auger cascade ends in the states which cannot decay through radiative or Auger transitions. These states are below the single-ionization threshold of the corresponding ion. The same approach was previously used to study transfer of population in the radiative and Auger cascades for various elements (Jonauskas et al. 2000, 2003, 2011; Palaudoux et al. 2010; Kučas et al. 2019, 2020b). It should be noted that the current analysis evaluates an influence of the radiative transitions on the cascade, while the previouscalculations for the Eu (Jonauskas et al. 2000), Xe (Jonauskas et al. 2003), and Kr (Palaudoux et al. 2010; Jonauskas et al. 2011) ions omitted the radiative transitions due to the low values for the fluorescence yields. Therefore, the multiple photoionization is expressed by the single-photoionization cross section for the primary K-shell electron ejection multiplied by the branching ratio determined from the radiative and Auger cascades.
3 Results
3.1 Photoionization cross sections
Photoionization of the K shell for the Fe atom requires 7122.66 eV of energy. The energy of the Fe+ 1s 3d64s2 configuration is above the energy of the ground configuration of the Fe18+ ion (2p4 – 5961.48 eV); however, it is below the energy of the ground configuration of the Fe19+ ion (2p3 – 7418.20 eV). On the other hand, only states of the Fe8+ ion are reachable in the current study.
The energy levels for the ground configuration of the Fe atom are compared to the values provided by the National Institute of Standards and Technology (NIST) (Kramida et al. 2021) in Table 1. In addition, the energy levels calculated using the pseudo-relativistic Hartree–Fock (PRHF) approximation (Cowan 1981) are presented for comparison. The indexes of levels presented in Table 1 are also used in the text. It can be seen that the DFS values are in better agreement with the NIST data than the PRHF calculations are. It should be noted that scaling of integrals was not used in the PRHF calculations. The largest discrepancy among the DFS and NIST energy levels is obtained for the level with index i = 23 (0.465 eV). The PRHF values are above the DFS and NIST data for all presented levels except for the ground term where DFS is slightly above PRHF.
The multiple-photoionization cross sections for the ground level of the Fe atom are presented in Fig. 1. The photoionization cross sections to the Fe6+ ion dominate compared to other multiple-photoionization cross sections. The photoionization cross sections to the states of the Fe4+ ion are ~42% lower than to the levels of the Fe6+ ion. The sextuple-photoionization cross sections from the ground level of the Fe atom are slightly lower than the triple-photoionization cross sections. The double-photoionization cross sections are below the septuple cross sections.
The multiple-photoionization cross sections are sensitive to the initial level of the Fe atom from which the photoionization process is investigated. For example, the septuple-photoionization cross sections from the level with index i = 33 (Fig. 2) are ~8% higher than those from the ground level of the Fe atom. Furthermore, the quadruple-photoionization cross sections are above the pentuple-photoionization cross sections from the level i = 33, while the pentuple-photoionization cross sections are above the quadruple ones in the case of the photoionization from the ground level. The octuple-photoionization cross sections are lower than sextuple-photoionization cross sections by two orders of magnitude for the presented levels. There are no Fe+ ions produced by the K-shell photoionization. The relative strength of the double, triple, and septuple photoionizations is also different from the level with the index i = 33 compared to the ground level. The triple-photoionization cross sections are the lowest of these cross sections from the excited level, and the strongest from the ground level.
The partial photoionization cross sections can be important in plasma modeling. The partial photoionization cross sections from the ground level of the Fe atom to configurations of the Fe6+ and Fe7+ ions are presented in Fig. 3. The cross sections to the ground configuration dominate for the Fe6+ and Fe7+ ions. The contribution of the excited configurations of the Fe6+ ion is negligibly small. On the other hand, the photoionization to the levels of the Fe7+ excited 3p53d2 configuration is only ~50% lower compared to the photoionization cross sections to levels of the Fe7+ 3d configuration.
The strongest partial photoionization cross sections from the ground level of the Fe atom to the levels of the ground configuration of the Fe6+ ion are shown in Fig. 4. The largest cross sections correspond to the ground level of the Fe6+ ion. The cross sections to the first excited level are ~36% lower compared to the ground level. It should be noted that our study includes only electric-dipole radiative transitions, while many of the produced configurations are the subject of the higher multipole radiative transitions.
Comparison of theoretical energy levels (in eV) to the available NIST values for the Fe 3d64s2 configuration.
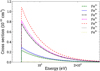 |
Fig. 1 Multiple-photoionization cross sections for the ground level of the Fe atom. |
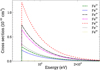 |
Fig. 2 Multiple-photoionization cross sections from the level with index 33 of the Fe atom. |
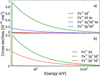 |
Fig. 3 Partial photoionization cross sections from the ground level of the Fe atom to the configurations of the (a) Fe6+ and (b) Fe7+ ions. |
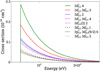 |
Fig. 4 Partial photoionization cross sections from the ground level of the Fe atom to the long-lived levels of the Fe6+ ion. The cross section to the ground level of the Fe6+ ion is shownas a solid line. |
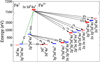 |
Fig. 5 Main branches of radiative and Auger cascades following decay of the Fe+ 1s13d64s2 configuration. The decay branches are presented for the configurations of the Fe+ ion. The initial population of the levels is proportional to their statistical weights. The numbers near the arrows indicate the branching ratios in percent. Black arrows correspond to Auger transitions, green arrows to radiative transitions. Even configurations are shown in red, odd configurations in blue. |
3.2 Radiative and Auger cascades
The main decay branches (sequences) of the cascade for the Fe+ 1s 3d64s2 configuration are presented in Figs. 5–10. The initial populations of the levels of the Fe+ 1s 3d64s2 configuration are taken to be proportional to the statistical weights of the level to demonstrate the decay paths of the radiative and Auger cascades. The theoretical ionization thresholds are compared to the NIST values in Table 2. It can be seen that all ionization thresholds calculated using the DFS approach are below the NIST results. For example, the theoretical single-ionization threshold for the Fe atom is 6.21 eV, while the NIST (Kramida et al. 2021) recommended value is 7.90 eV. The theoretical value is below the NIST value by 1.69 eV. The similar tendency for the FAC ionization thresholds compared to the NIST data was previously obtained for other ions (Jonauskas et al. 2015, 2019; Kynienė et al. 2015; Koncevičiūtė et al. 2018). The differences between the FAC and NIST ionization thresholds increase with increasing charge state. For Fe8+ it reaches a value of 13.59 eV; however, it is only ~1.7%. The energy levels of the Fe+ 1s 3d64s2 configuration are shown in Table A.1. The same indexes of levels presented in Table A.1 are used in the tables available at the CDS.
The strongest branch of the cascade leads to states of the Fe4+ ion: Fe+ 1s 3d64s2 ![Mathematical equation: $\xrightarrow[]{\text{33.5\%}}$](/articles/aa/full_html/2021/10/aa40891-21/aa40891-21-eq10.png) Fe+ 2p53d64s2 (Fig. 5)
Fe+ 2p53d64s2 (Fig. 5) ![Mathematical equation: $\xrightarrow[]{\text{15.5\%}}$](/articles/aa/full_html/2021/10/aa40891-21/aa40891-21-eq11.png) Fe2+ 3p43d64s2 (Fig. 5)
Fe2+ 3p43d64s2 (Fig. 5) ![Mathematical equation: $\xrightarrow[]{\text{14.2\%}}$](/articles/aa/full_html/2021/10/aa40891-21/aa40891-21-eq12.png) Fe3+ 3p53d44s2 (Fig. 6a)
Fe3+ 3p53d44s2 (Fig. 6a) ![Mathematical equation: $\xrightarrow[]{\text{13.2\%}}$](/articles/aa/full_html/2021/10/aa40891-21/aa40891-21-eq13.png) Fe4+ 3d34s (Fig. 7a). The final configuration cannot decay through electric dipole radiative transitions. The states of this configuration accumulate in the main part of the population residing in the Fe4+ ion (15.0%). This branch is started by the radiative decay of the configuration having the 2p subshell vacancy. The strong branch from the Fe+ 2p53d64s2 configuration also leads to the ground configuration of Fe3+: Fe+ 2p53d64s2
Fe4+ 3d34s (Fig. 7a). The final configuration cannot decay through electric dipole radiative transitions. The states of this configuration accumulate in the main part of the population residing in the Fe4+ ion (15.0%). This branch is started by the radiative decay of the configuration having the 2p subshell vacancy. The strong branch from the Fe+ 2p53d64s2 configuration also leads to the ground configuration of Fe3+: Fe+ 2p53d64s2 ![Mathematical equation: $\xrightarrow[]{\text{8.4\%}}$](/articles/aa/full_html/2021/10/aa40891-21/aa40891-21-eq14.png) Fe2+ 3p53d54s2 (Fig. 5)
Fe2+ 3p53d54s2 (Fig. 5) ![Mathematical equation: $\xrightarrow[]{\text{7.0\%}}$](/articles/aa/full_html/2021/10/aa40891-21/aa40891-21-eq15.png) Fe3+ 3d5 (Fig. 6a). The second strongest branch ends in the states of the Fe6+ ion: Fe+ 1s 3d64s2
Fe3+ 3d5 (Fig. 6a). The second strongest branch ends in the states of the Fe6+ ion: Fe+ 1s 3d64s2 ![Mathematical equation: $\xrightarrow[]{\text{32.7\%}}$](/articles/aa/full_html/2021/10/aa40891-21/aa40891-21-eq16.png) Fe2+ 2p43d64s2 (Fig. 5)
Fe2+ 2p43d64s2 (Fig. 5) ![Mathematical equation: $\xrightarrow[]{\text{14.1\%}}$](/articles/aa/full_html/2021/10/aa40891-21/aa40891-21-eq17.png) Fe3+ 2p53p43d64s2 (Fig. 6b)
Fe3+ 2p53p43d64s2 (Fig. 6b) ![Mathematical equation: $\xrightarrow[]{\text{6.6\%}}$](/articles/aa/full_html/2021/10/aa40891-21/aa40891-21-eq18.png) Fe4+ 2p53p53d44s2 (Fig. 7b)
Fe4+ 2p53p53d44s2 (Fig. 7b) ![Mathematical equation: $\xrightarrow[]{\text{3.1\%}}$](/articles/aa/full_html/2021/10/aa40891-21/aa40891-21-eq19.png) Fe5+ 3p33d44s2 (Fig. 8a)
Fe5+ 3p33d44s2 (Fig. 8a) ![Mathematical equation: $\xrightarrow[]{\text{2.1\%}}$](/articles/aa/full_html/2021/10/aa40891-21/aa40891-21-eq20.png) Fe6+ 3p43d34s (Fig. 9a). The 3p43d34s, 3p43d4, 3p53d24s, and 3p53d3 configurations of Fe6+ decay mainly radiatively to the lower lying states. The total population of the states of the Fe6+ ion amounts to 32.0%. The states of the Fe7+ ion are mainly populated from the Fe6+ 3s 3p53d34s, 3p33d44s, 3p43d24s2, 3s 3p43d44s, and 3p33d34s2 configurations (Fig. 10).
Fe6+ 3p43d34s (Fig. 9a). The 3p43d34s, 3p43d4, 3p53d24s, and 3p53d3 configurations of Fe6+ decay mainly radiatively to the lower lying states. The total population of the states of the Fe6+ ion amounts to 32.0%. The states of the Fe7+ ion are mainly populated from the Fe6+ 3s 3p53d34s, 3p33d44s, 3p43d24s2, 3s 3p43d44s, and 3p33d34s2 configurations (Fig. 10).
The population of the states for the Fe8+ ion reaches ~0.41%, while the final population for the states of the Fe7+ ion amounts to ~8.2%. The main population resides in the Fe8+ 3p53d configuration (0.32%). The states of the Fe8+ ion are mainly populated from the Fe7+ 3s 3p43d34s (0.15%), Fe7+ 3s 3p33d44s (0.11%), and Fe7+ 3s 3p53d24s (0.04%) configurations. It should be noted that these configurations are populated by many weak transitions from the configurations of the Fe6+ ion, many of which have the open 2p subshell.
The largest ionization stage produced in the K-shell photoionization process of the Fe atom is Fe8+. The Auger transition from the Fe+ 1s 3d64s2 configuration to Fe2+ 2s 2p53d64s2 is the first of the sequence in the cascade that leads to the states of the Fe8+ ion (Fig. 5). In this transition 13.26% of the population is transferred. It should be noted that the energy levels of the Fe2+ 2s03d64s2 configuration are above the energy levels of the Fe2+ 2s 2p53d64s2 configuration; however, the population of the former is lower by an order of magnitude (4.09%). The decay of the Fe2+ 2s 2p53d64s2 configuration leads to Fe3+ 2p43p53d64s2 with 5.40% of the population transferred (Fig. 6b). The main part of population of the Fe2+ 2s03d64s2 configuration reaches the Fe3+ 2p43p53d64s2 and Fe3+ 2s 2p53p53d64s2 configurations, which gain 2.08% and 1.51%, respectively. The Fe3+ 2s 2p53d54s2 configuration decays to Fe4+ 2p43d44s2 and Fe4+ 2p43p53d54s2 by transferring 1.09% and 0.70% of the population, respectively (Fig. 7c). The states of the Fe4+ 2p43p53d54s2 are also reached from the decay of the Fe3+ 2s 2p53p53d64s2 configuration. The Fe3+ 2p43p53d64s2 configuration partly populates states of the Fe4+ 2p43d44s2 configuration. However, only 0.78% out of 5.40% are transferred in this case. Other parts of population go to other configurations that are not on the branch that reaches states of the Fe8+ ion. The Fe4+ 2p43d44s2 configuration decays to Fe5+ 2p53p43d44s2 (0.95%, Fig. 8a), Fe5+ 2p53s3p53d44s2 (0.26%), and Fe5+ 2p53p53d34s2 (0.45%). The Fe4+ 2p43p53d54s2 configuration populates states of Fe5+ 2p53p33d54s2 (0.49%), Fe5+ 2p43d44s (0.31%), Fe5+ 2p53p53d34s2 (0.21%), and Fe5+ 2p53s3p43d54s2 (0.17%). There are much weaker transitions that populate states of the Fe5+ 2p53p43d44s2 configuration which accumulate population of 1.51%. In a similar way, the Fe5+ 2p53s 3p53d44s2 configuration accumulates 0.31%, Fe5+ 2p43d44s 0.37%, Fe5+ 2p53p33d54s2 0.60%, Fe5+ 2p53s 3p43d54s2 0.20%, and Fe5+ 2p53p53d34s2 0.81% of the initial population of the Fe+ 1s 3d64s2 configuration.
All these configurations of the Fe5+ ion are subject to further decay through the Auger transitions that leads to the Fe8+ ion. The Fe5+ 2p43d44s configuration populates the Fe6+ 2p53p43d44s (0.18%) and Fe6+ 2p53d24s (0.04%) configurations. In addition, the Fe6+ 2p53p43d44s is reached from the Fe5+ 2p53p33d54s2 and Fe5+ 2p53s 3p43d54s2 with population of 0.21% and 0.10%, respectively. The Fe5+ 2p53p53d34s2 configuration transfers 0.10% out of 0.81% to the states of the Fe6+ 2p53d24s configuration. The states of the Fe6+ 2p53p53d34s configuration are populated by the Auger transitions from Fe5+ 2p53p43d44s2 (0.41%) and Fe5+ 2p53s 3p53d44s2 (0.14%). Many weak transitions lead to the states of the Fe6+ 2p53p53d34s configuration that accumulates 0.69% of the population. The total populations of the Fe6+ 2p53p43d44s and Fe6+ 2p53d24s amount to 0.55% and 0.16%, respectively.
The Fe6+ 2p53p53d34s configuration decays to Fe7+ 3s 3p43d34s by moving 0.11% out of 0.69%. The Fe7+ 3s 3p43d34s configuration accumulates 0.18% of the initial population of the Fe+ 1s 3d64s2 and 0.15% of which are further transferred to Fe8+ 3p43d2. The Fe6+ 2p53p43d44s configuration decays to Fe7+ 3s 3p33d44s by transferring 0.07% out of 0.55%. The total population amounts to 0.12% for the Fe7+ 3s 3p33d44s configuration. The main part of the population (0.11%) leads to the Fe8+ 3p33d3 configuration. The Fe7+ 3s 3p53d24s configuration decays to Fe8+ 3p53d by transferring 0.04% out of 0.06%. Therefore, there are mainly three configurations (i.e., 3p33d3, 3p43d2, and 3p53d) of the Fe8+ ion populated in the radiative and Auger cascades following the creation of the Fe+ 1s 3d64s2 configuration by the photoionization of the Fe atom.
The ion yield produced by radiative and Auger cascades following the K shell photoionization is shown in Fig. 11. A comparison with the previous calculations by Kaastra & Mewe (1993) that considered transitions among configuration averages is also presented. In addition, the results of the study for subconfigurations are shown. The highest population for the decay of the lowest level of the Fe+ 1s 3d6 configuration corresponds to the Fe6+ ion (~31.2%). The cascade produced by the decay of the highest level of the Fe+ 1s 3d6 configuration leads mainly to states of the Fe6+ ion (~34.7%). However, the radiative and Auger cascades studied for the levels and subconfigurations demonstrate large differences for the ion yields of the Fe5+ and Fe6+ ions. It should be noted that the results from configuration averages provide the highest ion yield for Fe7+ (Kaastra & Mewe 1993). Even the population of the Fe8+ ion is quite large (17.3%) compared to the data obtained using more detailed calculations. This can be explained by the fact that additional artificial channels are opened in the calculations of the ion yield by modifying subshell energies (Kaastra & Mewe 1993). The similar situation was obtained for the radiative and Auger cascades following the photoionization from the 1s, 2s, and 2p subshells in the Fe2+ ion (Kučas et al. 2019, 2020b; Schippers et al. 2021). The study of the subconfigurations is more detailed than that of the configuration averages, but the highest population is produced for the Fe5+ ions in the first case. Furthermore, the analysis of the cascade by considering transitions among energy levels is more accurate compared to the study for the subconfigurations. This leads to the higher maximum ion yield (Fe6+) compared to the investigation using the subconfiguration averages (Fe5+). It should be noted that the calculations for the configuration averages reach the Fe10+ ion, while the highest ionization stage of the Fe8+ ion is obtained in the current study. The calculations of the radiative and Auger cascades for the highest level of the Fe+ 1s 3d64s2 configuration produce a slightly higher ion yield starting from the Fe6+ ion compared to the study for the lowest level since a larger number of energy levels of the higher ionization stages is covered by the energetically higher initial level compared to the lowest one. It should be noted that the ion yield for the Fe2+ ion is larger than for Fe3+ and the ion yield for the Fe4+ ion is larger than for Fe5+ in the study for configuration averages (Kaastra & Mewe 1993). The same tendency for the ion population is obtained for the decay from the highest level of the Fe+ 1s 3d64s2 configuration. A similar situation for the cascade was obtained in the case of the K-shell vacancy for subconfigurations and the lowest level (Fe4+ versus Fe5+) of the Fe3+ 1s 3d6 configuration (Kučas et al. 2020b).
It should be noted that the calculations that considered transitions among configuration averages show a contribution of the Fe+ ion (0.47%). This ion is produced by radiative transitions to the Fe+ 2p53d64s2 and 3p53d64s2 configurations. Our study demonstrates that the produced configurations are the subject of further decay mainly through Auger transitions to states of the Fe2+ ion (Fig. 5). The negligible population in the states of the Fe+ ion is determined in our study.
The previous study of multiple photoionization for the K shell of the Fe2+ ion determined that the Fe6+ ions are produced with the highest probability. However, the states of the ion were reached in the third step of the Auger cascade, while it requires five steps for the decay of the Fe+ 1s 3d64s2 configuration to Fe6+, which accumulates the highest population in the current study.
As mentioned above, the single-configuration approximation is used in the current study. The configuration interaction (CI) method can be important in the analysis of multiple-photoionization cross sections. The previous studies demonstrated that correlation effects incorporated in calculations have a crucial effect obtaining higher ionization stages in the cascade process and explaining measurements (Jonauskas et al. 2008, 2011; Palaudoux et al. 2010). However, these calculations require large computational resources and efforts since the CI basis set has to include many admixed configurations (Kučas et al. 1997) that are important for the investigated configurations in the multiple-photoionization process. Furthermore, the CI basis must be extended by including configurations having the highest mixing with the admixed configurations. However, such calculations are hardly feasible at the moment. Nevertheless, the present study provides important results that can be used in the analysis of the charge-state distribution in the photoionized plasmas.
Multiple-ionization thresholds for the 3d64s2 configurationof the Fe atom.
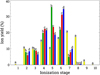 |
Fig. 11 Ion yields for radiative and Auger cascades following decay of the Fe+ 1s13d64s2 configuration: a (yellow) Data from previous calculations (Kaastra & Mewe 1993), b (green) Subconfigurations with the initial population proportional to statistical weights, c (red) and d (blue) Initially populated by only the lowest and the highest levels of the Fe+ 1s13d64s2 configuration, respectively. |
4 Conclusions
The multiple-photoionization cross sections from the K shell of the Fe atom are investigated for all levels of the 3d64s2 configuration. The partial photoionization cross sections to the configurations of the Fe6+ and Fe7+ ions are alsoanalyzed. The study demonstrates that the ground configurations of the produced ions are mainly populated in the photoionization process with the ground levels of the ions mostly being reached. The sextuple-photoionization cross sections dominate compared toother multiple-photoionization cross sections for levels of the Fe atom. The sextuple cross sections for the ground level are ~33% and ~42% higher compared to quintuple and quadruple, respectively. The main decay branches for the K-shell vacancy in the Fe+ ion are identified for the statistical distribution of the initial levels. The strongest branches lead to states of the Fe4+ and Fe6+ ions. The ion yields presented for the study among subconfigurations and energy levels show large variation. The largest ion yield for subconfigurations corresponds to Fe5+, while investigation for the levels leads to Fe6+. The highest ionization stage reached in the photoionization process amounts to Fe8+.
Finally, the multiple-photoionization cross sections are available at the CDS. The partial photoionization cross sections to the configurations of the produced ions are also tabulated.
Acknowledgements
Part of the computations were performed on the High Performance Computing (HPC) cluster at the Institute of Theoretical Physics and Astronomy, Faculty of Physics, Vilnius University.
Appendix A Additional table
Energy levels for the Fe+ 1 3d64s2 configuration. Energies are given relative to the ground energy of the Fe 3d64s2 configuration. The levels are identified by the largest weight in the expansion of wave func- tion. Closed subshells are omitted in the notations of the levels. J is the total angular momentum quantum number.
References
- Bautista, M. A., Mendoza, C., Kallman, T. R., & Palmeri, P. 2003, A&A, 403, 339 [NASA ADS] [CrossRef] [EDP Sciences] [Google Scholar]
- Bautista, M. A., Mendoza, C., Kallman, T. R., & Palmeri, P. 2004, A&A, 418, 1171 [NASA ADS] [CrossRef] [EDP Sciences] [Google Scholar]
- Cowan, R. D. 1981, The Theory of Atomic Structure and Spectra (Berkeley, CA: University of California Press), 650 [Google Scholar]
- Deprince, J., Bautista, M. A., Fritzsche, S., et al. 2019, A&A, 626, A83 [NASA ADS] [CrossRef] [EDP Sciences] [Google Scholar]
- Deprince, J., Bautista, M. A., Fritzsche, S., et al. 2020, A&A, 635, A70 [CrossRef] [EDP Sciences] [Google Scholar]
- Foord, M., Heeter, R., Chung, H. K., et al. 2006, J. Quant. Spectrosc. Radiat. Transf., 99, 712 [CrossRef] [Google Scholar]
- Fukazawa, Y., Furui, S., Hayashi, K., et al. 2016, ApJ, 821, 15 [CrossRef] [Google Scholar]
- Gu, M. F. 2008, Can. J. Phys., 86, 675 [NASA ADS] [CrossRef] [Google Scholar]
- Hall, I. M., Durmaz, T., Mancini, R. C., et al. 2014, Phys. Plasmas, 21, 031203 [CrossRef] [Google Scholar]
- Iwasawa, K., Mainieri, V., Brusa, M., et al. 2012, A&A, 537, A86 [NASA ADS] [CrossRef] [EDP Sciences] [Google Scholar]
- Jacobs, V. L., & Rozsnyai, B. F. 1986, Phys. Rev. A, 34, 216 [NASA ADS] [CrossRef] [Google Scholar]
- Jonauskas, V., Karazija, R., & Kučas, S. 2000, J. Electron. Spect, Rel. Phen., 107, 147 [CrossRef] [Google Scholar]
- Jonauskas, V., Partanen, L., Kučas, S., et al. 2003, J. Phys. B: At. Mol. Opt. Phys., 36, 4403 [CrossRef] [Google Scholar]
- Jonauskas, V., Karazija, R., & Kučas, S. 2008, J. Phys. B: At. Mol. Opt. Phys., 41, 215005 [NASA ADS] [CrossRef] [Google Scholar]
- Jonauskas, V., Kučas, S., & Karazija, R. 2011, Phys. Rev. A, 84, 053415 [NASA ADS] [CrossRef] [Google Scholar]
- Jonauskas, V., Kynienė, A., Merkelis, G., et al. 2015, Phys. Rev. A, 91, 012715 [NASA ADS] [CrossRef] [Google Scholar]
- Jonauskas, V., Kynienė, A., Kučas, S., et al. 2019, Phys. Rev. A, 100, 062701 [CrossRef] [Google Scholar]
- Kaastra, J. S., & Mewe, R. 1993, A&AS, 97, 443 [NASA ADS] [Google Scholar]
- Kallman, T. R., Palmeri, P., Bautista, M. A., Mendoza, C., & Krolik, J. H. 2004, ApJS, 155, 675 [NASA ADS] [CrossRef] [Google Scholar]
- Khalal, M. A., Lablanquie, P., Andric, L., et al. 2017, Phys. Rev. A, 96, 013412 [CrossRef] [Google Scholar]
- Koncevičiūtė, J., Kučas, S., Masys, Š., Kynienė, A., & Jonauskas, V. 2018, Phys. Rev. A, 97, 012705 [NASA ADS] [CrossRef] [Google Scholar]
- Kramida, A., Ralchenko, Yu., Reader, J., & NIST ASD Team. 2021, NIST At. Spec. Database (ver. 5.8), [Online]. Available: https://physics.nist.gov/asd [2021, January 2021]. (Gaithersburg, MD: National Institute of Standards and Technology) [Google Scholar]
- Kučas, S., & Karazija, R. 1993, Phys. Scr., 47, 754 [CrossRef] [Google Scholar]
- Kučas, S., Karazija, R., Jonauskas, V., & Aksela, S. 1995, Phys. Scr., 52, 639 [NASA ADS] [CrossRef] [Google Scholar]
- Kučas, S., Jonauskas, V., & Karazija, R. 1997, Phys. Scr., 55, 667 [NASA ADS] [CrossRef] [Google Scholar]
- Kučas, S., Drabužinskis, P., Kynienė, A., Masys, Š., & Jonauskas, V. 2019, J. Phys. B: At. Mol. Opt. Phys., 52, 225001 [CrossRef] [Google Scholar]
- Kučas, S., Drabužinskis, P., & Jonauskas, V. 2020a, At. Data Nucl. Data Tables, 135-136, 101357 [Google Scholar]
- Kučas, S., Kynienė, A., Masys, Š., & Jonauskas, V. 2020b, A&A, 643, A46 [CrossRef] [Google Scholar]
- Kynienė, A., Masys, Š., & Jonauskas, V. 2015, Phys. Rev. A, 91, 062707 [NASA ADS] [CrossRef] [Google Scholar]
- Loisel, G. P., Bailey, J. E., Liedahl, D. A., et al. 2017, Phys. Rev. Lett., 119, 075001 [NASA ADS] [CrossRef] [Google Scholar]
- Lotz, W. 1967, J. Opt. Soc. Am., 57, 873 [CrossRef] [Google Scholar]
- Lotz, W. 1968, J. Opt. Soc. Am., 58, 915 [CrossRef] [Google Scholar]
- Opendak, M. G. 1990, Astrophys. Space Sci., 165, 9 [NASA ADS] [CrossRef] [Google Scholar]
- Palaudoux, J., Lablanquie, P., Andric, L., et al. 2010, Phys. Rev. A, 82, 043419 [NASA ADS] [CrossRef] [Google Scholar]
- Palaudoux, J., Sheinerman, S., Soronen, J., et al. 2015, Phys. Rev. A, 92, 012510 [NASA ADS] [CrossRef] [Google Scholar]
- Palmeri, P., Mendoza, C., Kallman, T. R., Bautista, M. A., & Melendez, M. 2003, A&A, 410, 359 [NASA ADS] [CrossRef] [EDP Sciences] [Google Scholar]
- Saber, I., Bartnik, A., Wachulak, P., et al. 2017, Phys. Plasmas, 24, 063501 [CrossRef] [Google Scholar]
- Schippers, S., Beerwerth, R., Bari, S., et al. 2021, ApJ, 908, 52 [CrossRef] [Google Scholar]
- Schulz, N. S., Kallman, T. E., Heinz, S., et al. 2020, ApJ, 891, 150 [Google Scholar]
- Temple, M. J., Ferland, G. J., Rankine, A. L., et al. 2020, Mon. Not. R. Astron. Soc., 496, 2565 [CrossRef] [Google Scholar]
- Verhoef, A. J., Mitrofanov, A. V., Nguyen, X. T., et al. 2011, New J. Phys., 13, 113003 [NASA ADS] [CrossRef] [Google Scholar]
- Watanabe, S., Sako, M., Ishida, M., et al. 2006, ApJ, 651, 421 [Google Scholar]
- White, S., Irwin, R., Warwick, J. R., et al. 2018, Phys. Rev. E, 97, 063203 [CrossRef] [Google Scholar]
All Tables
Comparison of theoretical energy levels (in eV) to the available NIST values for the Fe 3d64s2 configuration.
Energy levels for the Fe+ 1 3d64s2 configuration. Energies are given relative to the ground energy of the Fe 3d64s2 configuration. The levels are identified by the largest weight in the expansion of wave func- tion. Closed subshells are omitted in the notations of the levels. J is the total angular momentum quantum number.
All Figures
|
Fig. 1 Multiple-photoionization cross sections for the ground level of the Fe atom. |
| In the text | |
|
Fig. 2 Multiple-photoionization cross sections from the level with index 33 of the Fe atom. |
| In the text | |
|
Fig. 3 Partial photoionization cross sections from the ground level of the Fe atom to the configurations of the (a) Fe6+ and (b) Fe7+ ions. |
| In the text | |
|
Fig. 4 Partial photoionization cross sections from the ground level of the Fe atom to the long-lived levels of the Fe6+ ion. The cross section to the ground level of the Fe6+ ion is shownas a solid line. |
| In the text | |
|
Fig. 5 Main branches of radiative and Auger cascades following decay of the Fe+ 1s13d64s2 configuration. The decay branches are presented for the configurations of the Fe+ ion. The initial population of the levels is proportional to their statistical weights. The numbers near the arrows indicate the branching ratios in percent. Black arrows correspond to Auger transitions, green arrows to radiative transitions. Even configurations are shown in red, odd configurations in blue. |
| In the text | |
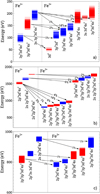 |
Fig. 6 Same as Fig. 5, but for configurations of the Fe2+ ion. |
| In the text | |
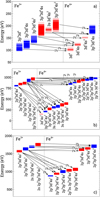 |
Fig. 7 Same as Fig. 5, but for configurations of the Fe3+ ion. |
| In the text | |
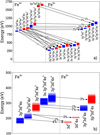 |
Fig. 8 Same as Fig. 5, but for configurations of the Fe4+ ion. |
| In the text | |
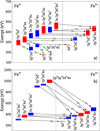 |
Fig. 9 Same as Fig. 5, but for configurations of the Fe5+ ion. |
| In the text | |
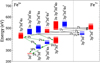 |
Fig. 10 Same as Fig. 5, but for configurations of the Fe6+ ion. |
| In the text | |
|
Fig. 11 Ion yields for radiative and Auger cascades following decay of the Fe+ 1s13d64s2 configuration: a (yellow) Data from previous calculations (Kaastra & Mewe 1993), b (green) Subconfigurations with the initial population proportional to statistical weights, c (red) and d (blue) Initially populated by only the lowest and the highest levels of the Fe+ 1s13d64s2 configuration, respectively. |
| In the text | |
Current usage metrics show cumulative count of Article Views (full-text article views including HTML views, PDF and ePub downloads, according to the available data) and Abstracts Views on Vision4Press platform.
Data correspond to usage on the plateform after 2015. The current usage metrics is available 48-96 hours after online publication and is updated daily on week days.
Initial download of the metrics may take a while.