Fig. 11
Download original image
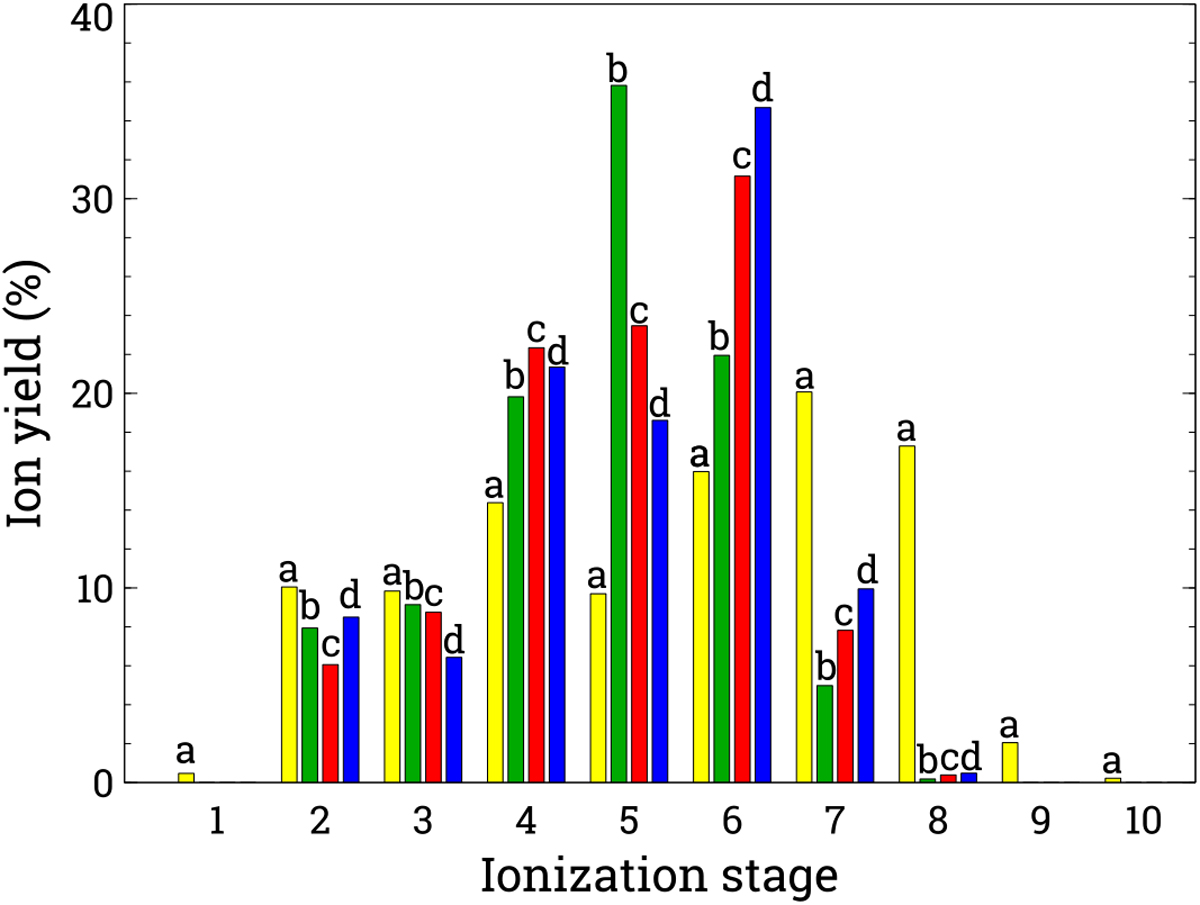
Ion yields for radiative and Auger cascades following decay of the Fe+ 1s13d64s2 configuration: a (yellow) Data from previous calculations (Kaastra & Mewe 1993), b (green) Subconfigurations with the initial population proportional to statistical weights, c (red) and d (blue) Initially populated by only the lowest and the highest levels of the Fe+ 1s13d64s2 configuration, respectively.
Current usage metrics show cumulative count of Article Views (full-text article views including HTML views, PDF and ePub downloads, according to the available data) and Abstracts Views on Vision4Press platform.
Data correspond to usage on the plateform after 2015. The current usage metrics is available 48-96 hours after online publication and is updated daily on week days.
Initial download of the metrics may take a while.