| Issue |
A&A
Volume 649, May 2021
|
|
|---|---|---|
| Article Number | A154 | |
| Number of page(s) | 11 | |
| Section | Galactic structure, stellar clusters and populations | |
| DOI | https://doi.org/10.1051/0004-6361/202140684 | |
| Published online | 01 June 2021 | |
Potassium abundances in multiple stellar populations of the globular cluster NGC 4833⋆
INAF-Osservatorio di Astrofisica e Scienza dello Spazio di Bologna, Via Gobetti 93/3, 40129 Bologna, Italy
e-mail: This email address is being protected from spambots. You need JavaScript enabled to view it.
Received:
1
March
2021
Accepted:
11
March
2021
Abstract
NGC 4833 is a metal-poor Galactic globular cluster (GC) whose multiple stellar populations present an extreme chemical composition. The Na-O anti-correlation is quite extended, which is in agreement with the long tail on the blue horizontal branch, and the large star-to-star variations in the [Mg/Fe] ratio span more than 0.5 dex. Recently, significant excesses of Ca and Sc with respect to field stars of a similar metallicity were also found, signaling the production of species forged in H-burning at a very high temperature in the polluters of the first generation in this cluster. Since an enhancement of potassium is also expected under these conditions, we tested this scenario by analysing intermediate resolution spectra of 59 cluster stars including the K I resonance line at 7698.98 Å. We found a wide spread of K abundances, anti-correlated to Mg and O abundances, as previously also observed in NGC 2808. The abundances of K are found to be correlated to those of Na, Ca, and Sc. Overall, this chemical pattern confirms that NGC 4833 is one of the relatively few GCs where the self-enrichment from first generation polluters occurred at such high temperatures that proton-capture reactions were able to proceed up to heavier species such as K and possibly Ca. The spread in K observed in GCs appears to be a function of a linear combination of cluster total luminosity and metallicity, as other chemical signatures of multiple stellar populations in GCs.
Key words: stars: abundances / stars: atmospheres / stars: Population II / globular clusters: general / globular clusters: individual: NGC 4833
Based on observations collected at ESO telescopes under programmes 083.D-0208 and 095.D-0539.
© ESO 2021
1. Introduction
Multiple stellar populations in Galactic globular clusters (GCs) are commonly recognised as the fossil records of a chemical self-enrichment at early epochs in the cluster lifetime. The enhancements and depletions in light element abundances currently observed in most GC stars very likely originated in already evolved massive stars of the first generation (FG) that formed in the cluster. This stems from the observations, covering several decades nowadays (see Smith 1987; Kraft 1994; Gratton et al. 2004, 2012), that depleted elements are anti-correlated to enhanced species and correlated to other depleted species; this is an overall chemical pattern that is well explained by proton-capture reactions occurring in high temperature H-burning (e.g. Denisenkov & Denisenkova 1989).
However, determining what exactly these FG polluters were is still controversial. The imperfect match between observations and models introduces uncertainties on the probable sites for this peculiar nucleosynthesis in GCs (e.g. the recent review by Bastian & Lardo 2018; Gratton et al. 2019). For a more unambigous answer to this issue, it is important to sample as many GCs as possible and as many abundances of the different atomic species involved. Lighter elements such as C, N, O, and Na (forged at a relatively moderate temperature in H-burning and the first species used to tag multiple populations in GCs) are not enough. Heavier species must be analysed to sample the regime(s) where the addition of protons requires higher and higher temperatures to overcome the Coulomb barrier. In turn, different temperature regimes can be translated through stellar evolutionary models into mass regimes, providing useful constraints to define the nature of the FG polluters.
A good example is represented by the K-Mg anti-correlation discovered in NGC 2419 (Cohen & Kirby 2012; Mucciarelli et al. 2012). In the context of multiple populations, Ventura et al. (2012) proposed that at the low metallicity of this cluster, the H-burning occurred to such a high temperature that the consumption of Mg was accompanied not only by the usual Al production, but also by the synthesis of heavier elements such as K, and even possibly Ca, from proton-capture on Ar nuclei. They proposed super asymptotic giant branch (S-AGB) stars as polluters, which were later confirmed by Iliadis et al. (2016) as viable contributors, provided that models are calibrated in such a way to give the highest possible temperatures.
NGC 4833 is a good target where to search for the chemical fossil records left from such a regime. It is a massive (total absolute magnitude MV = −8.17, Harris 1996, 2010 online edition) and metal-poor ([Fe/H] = −2.02 dex, Carretta et al. 2014) GC. This is exactly the right combination of global parameters for generating both large depletions in O (Carretta et al. 2009a) and high levels of Al production (Carretta et al. 2009b; see also Pancino et al. 2017; Mészáros et al. 2020), as well as significant excesses of Ca and Sc from proton-capture reactions (Carretta & Bragaglia 2021, their Fig. 9). Unlike the case of the Mg-Al anti-correlation, observed in a good fraction of GCs, the very high temperature regime for hot H-burning, with alterations potentially affecting the K, Ca, and Sc group, is still poorly sampled. Any new addition would represent a precious constraint to properly tune stellar models.
Already the first extensive abundance analysis in NGC 4833 revealed that the chemical composition of the multiple populations in this cluster is extreme (Carretta et al. 2014). The Na-O anti-correlation is found to reach a long extension, as predicted by the robust relation between the extent of this signature and the hottest point along the horizontal branch (HB: Carretta et al. 2007a). The long blue tail of the HB clearly stands out in NGC 4833 (see e.g. the HST snapshot survey by Piotto et al. 2002). Beside the long extent of the Na-O anti-correlation, an unusually wide spread in the [Mg/Fe] abundance ratio was detected; this was later independently confirmed by Roederer & Thompson (2015), although with a smaller sample.
In Carretta et al. (2014), a correlation between a Ca and Sc abundance was also observed, but it was overlooked because it was erroneously considered not to be significant. Nevertheless, in the diagnostic plot of [Ca/Mg] versus [Ca/H] employed to evaluate the possible relation between Mg and heavier elements, we found that NGC 4833 stands out in the [Ca/Mg] distribution with respect to many GC stars, together with NGC 2808, NGC 5139 (ω Cen), NGC 6715 (M 54), and NGC 7078 (M 15). This behaviour points out that the observed large depletions in Mg are likely accompanied by excesses in Ca abundances.
A confirmation for these findings was recently found in a census of Mg, Ca, and Sc abundances in a large sample of GCs (Carretta & Bragaglia 2021). Using an unpolluted sample of field stars as a reference, significant excesses of Ca and Sc were detected in a number of GCs, almost all the ones picked up by the diagnostic plot in Carretta et al. (2014), NGC 4833 included.
Ideally, it would also be important to check the chemical pattern found for elements such as P and S, which are intermediate steps to Ca and Sc in the proton-capture sequence. Unfortunately, the few pioneering studies are still limited to a handful of stars in the GCs closer to the Sun, none of which are among the extreme cases listed above. Phosphorus abundances were derived in HB stars of NGC 6397 and NGC 6752 (Hubrig et al. 2009), whereas sulphur was observed in stars of NGC 6752 and NGC 104 (47 Tuc) by Sbordone et al. (2009), in one star of NGC 6397 by Koch & Caffau (2011), and in NGC 6121 (M 4), NGC 6656 (M 22), and NGC 7099 (M 30) by Kacharov et al. (2015). Interestingly, in 47 Tuc S abundances seem to be correlated to the Na abundances, suggesting a possible origin through proton-capture reactions.
To better assess the right framework in which to interpret these data in the context of multiple populations in GCs, it would be advantageous to also directly check the other element involved, potassium. Abundance analysis of K in GC stars is, however, scanty. Apart from the notable case of NGC 2419 cited above, only about a dozen GCs have been scrutinised for K (Takeda et al. 2009; Roederer et al. 2011; Carretta et al. 2013; Roederer & Thompson 2015; Mucciarelli et al. 2015, 2017; Mészáros et al. 2020). Only in NGC 2808 (Mucciarelli et al. 2015) and ω Cen (Mészáros et al. 2020) significant star-to-star abundance variations in [K/Fe] were detected, albeit the intrinsic spread is much smaller than the huge dispersion observed in NGC 2419.
Moreover, the samples are often limited to a few stars in each GC, and this precludes any firm conclusion from being drawn. The analysis of infrared data from APOGEE (Mészáros et al. 2020) revealed only two K-rich stars in NGC 2808, due to the severe selection criteria imposed on abundance quality, and in NGC 1904 the data dispersion in Mg is unfortunately comparable to the uncertainties, so that in this GC the existence of a K-Mg anti-correlation is at least weak or questionable.
In NGC 4833 Roederer & Thompson (2015) confirmed a large dispersion in Mg abundances, with a bi-modal distribution of [Mg/Fe] ratios from a sample of 15 giants. They also derived K abundances for all the stars; however, apparently after dropping the star with the highest [K/Fe] ratio (star 4–224 seems to have been excluded from both their plots and averages), they concluded that the evidence for a K-Mg anti-correlation was not compelling in this cluster. The same conclusion was reached for variations in Ca and Sc.
Fortunately, NGC 4833 is one of the few GCs whose data in the ESO archive do include spectra in the region where the transitions of the resonance doublet of K I at 7664 and 7698 Å fall. This occurrence allowed us to derive the [K/Fe] ratios for a large number of cluster stars whose abundances of other proton-capture elements were already homogeneously determined in Carretta et al. (2014). The present analysis reveals a significant dispersion in K abundances and a pattern of correlations and anti-correlations with other light species well explained by the outcome of very high temperature H-burning in multiple stellar populations in GCs.
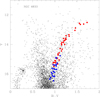 |
Fig. 1. Colour-magnitude diagram V, B − V from the photometric catalogue in Carretta et al. (2014: small crosses). Stars selected for the present study are represented as larger filled circles. Blue symbols indicate stars with lower S/N spectra (see text). |
In Sect. 2 we describe the data and the analysis. In Sect. 3 we discuss our results, and in Sect. 4 we frame our new findings for NGC 4833 in the context of what we know for the behaviour of heavy proton-capture elements in GCs. A summary of the main points is given in Sect. 5.
2. Observations and abundance analysis
From the ESO archive of advanced data products, we downloaded the one-dimensional, wavelength-calibrated spectra of stars in NGC 4833 including the resonance doublet of K I. The spectra were acquired on 30 May 2015 in two exposures, each 1200 s long, under the ESO programme 095.D-0539 (P.I. Mucciarelli), using the GIRAFFE high resolution setup HR18 (R = 19 000), covering the spectral range from about 7460 to about 7883 Å.
Coordinates and atmospheric parameters of selected stars in NGC 4833.
We then selected the spectra for a subset of 59 stars whose atmospheric parameters, metallicities, and element abundances were derived in Carretta et al. (2014) using procedures homogeneously adopted for all GCs in our FLAMES survey (see Carretta et al. 2006 for details). The survey also includes NGC 2808 (Carretta 2015), the only other GC to date besides NGC 2419 where a clear K-Mg anti-correlation was detected (Mucciarelli et al. 2015).
The position of the selected stars is shown on the V, B − V colour-magnitude diagram in Fig. 1 from the photometric catalogue described in Carretta et al. (2014). In Table 1 we list star identification, coordinates, and atmospheric parameters from Carretta et al. (2014).
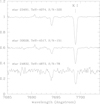 |
Fig. 2. Example of cleaned spectra in three ranges of S/N. |
For each exposure, the spectra were sky-subtracted and the K I lines were carefully examined. The line at 7664.91 Å is heavily contaminated by strong telluric lines, whereas the 7698.98 Å line is only affected by contamination from a weaker line. The observed spectra in each exposure were then cleaned by dividing for a synthetic spectrum of the telluric lines over the region 7681−7710 Å, following the procedure described for the [O I] forbidden line in Carretta et al. (2006). Finally, for each star a co-added spectrum was obtained from the cleaned spectra. The signal-to-noise ratio (S/N) of each combined spectrum, estimated in a region close to the K I line, is reported in Col. (7) of Table 1. Examples of co-added spectra are shown in Fig. 2.
Abundances of K were derived from the equivalent widths (EWs) of the K I 7698.98 Å line measured on the cleaned spectra with the package ROSA (Gratton 1988). For the abundance analysis, we adopted the atmospheric parameters derived in Carretta et al. (2014) with the exception of microturbulent velocity, vt. When using vt values obtained using weak Fe lines together with strong lines such as the K I ones, being more sensitive to velocity fields in the stellar atmospheres, a clear trend of abundances as a function of the vt appears, which is a well known effect (e.g. Carretta et al. 2014; Mucciarelli et al. 2015). To alleviate this problem, we adopted the same approach used in Carretta et al. (2014) for the strong Ba lines. We adopted the values of vt obtained from a relation as a function of the surface gravity derived by Worley et al. (2013) for giants in the metal-poor GC M 15, whose metallicity is comparable to that of NGC 4833. This relation was found to be efficient in removing the trend of Ba abundances and it also works well for K abundances, as in the present work. The same approach was adopted by Mucciarelli et al. (2015) for NGC 2808, using a slightly different relation from Kirby et al. (2009).
As in Carretta et al. (2013), we applied corrections for departure from the Local Thermodynamic Equilibrium (LTE) to the abundances of K, using a multivariate interpolation as a function of the temperature, gravity, metallicity, and the EW of the K I line from the set of models by Takeda et al. (2002) 1. Due to the similar range of parameters for the present sample of stars, these corrections are essentially a constant shift of the K abundances downwards by about −0.6 dex, with a root mean square (rms) scatter of only 0.032 dex which has a negligible impact on the star-to-star internal errors.
Internal errors were derived using sensitivities of abundances to variations in the atmospheric parameters and the internal uncertainties in each parameter as estimated in Carretta et al. (2014). The resulting star-to-star errors were then summed in quadrature to uncertainties in the EW measurements, estimated by the formula from Cayrel (1988). This contribution depends on the S/N, so that the total error budget is 0.061 dex, 0.070 dex, and 0.095 dex in the ranges S/N > 200, 100 < S/N < 200, and S/N < 100, respectively. In the end, we assumed the average 0.08 dex as the average internal error associated with the K abundances. We note that the systematic uncertainty related to the trend of abundances as a function of vt, if not properly treated, would result in spurious changes in the [K/Fe] ratios potentially much larger than the derived internal errors. The derived [K/Fe] ratios, corrected for non-LTE, are listed in Table 2, together with the abundances of light elements derived for programme stars in Carretta et al. (2014), for an easier comparison.
Abundances of light elements for the programme stars.
3. Results
Abundances of K were obtained for all of the 59 programme stars. In the following, we explore the relation of K to the other proton-capture elements analysed in Carretta et al. (2014) and the comparison with the previous analysis by Roederer & Thompson (2015). The properties of NGC 4388 in the general context of multiple stellar populations in GCs are discussed in the next section.
3.1. Potassium and other light elements in NGC 4833
Our main result is summarised in Fig. 3, where we plotted the abundances of K from the present work as a function of the [Mg/Fe] ratios from Carretta et al. (2014). In NGC 4833 we observe a large range of K abundances, about 0.5 dex from peak to peak, which are comparable to the wide spread detected for Mg abundances. The mean value of [K/Fe] for programme stars is 0.078 dex (σ = 0.137 dex, 59 stars). Considering only stars with high S/N spectra, the mean value slightly decreases to 0.043 dex, but the scatter remains almost unvaried (σ = 0.136 dex, 37 stars). The large scatter seems to be an intrinsic feature: No significant trend is observed as a function of the atmospheric parameters (effective temperature, microturbulent velocity). The star-to-star variation in [K/Fe] is observed over four full magnitudes along the red giant branch (RGB) in NGC 4833.
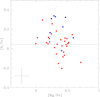 |
Fig. 3. Abundance ratios [K/Fe] from the present analysis as a function of [Mg/Fe] ratios from Carretta et al. (2014). Blue points indicate stars whose co-added spectra are of a lower quality (S/N < 100). The horizontal line is at the average value of [K/Fe] derived from high S/N spectra. Internal error bars are also shown. |
In Fig. 3 we plotted stars whose combined spectra have S/N < 100 as blue symbols: Almost all of them lie at the upper envelope of the K distribution. This occurrence may suggest that measurements of K in such a low metallicity GC could be affected by some additional residual noise when spectra of a lower quality are used. We conservatively distinguish these stars with a different colour in Fig. 3 and in the next figures, although our conclusions are not affected by this consideration much.
A clear anti-correlation is observed in Fig. 3: The higher abundances of K are found for stars with the lower Mg abundances, and vice versa. To better quantify these findings, we considered the average value [Mg/Fe] = 0.27 dex from the high resolution UVES spectra in Carretta et al. (2014). When the sample is split at this value, the mean values of K abundances in the two groups are [K/Fe] = +0.146 dex (σ = 0.093 dex, 12 stars) and [K/Fe] = +0.060 dex (σ = 0.142 dex, 26 stars) for the Mg-poor and Mg-rich sub-samples, respectively. With the Student’s test, we checked the null hypothesis that these two components are extracted from a distribution having the same mean [K/Fe] ratio. This hypothesis can be rejected at a high level of confidence (t = 2.266, 36 d.o.f., two-tail probability p = 0.03).
The same conclusion is reached from Fig. 4, where we plotted the cumulative distributions of the [K/Fe] ratios for the higher and lower Mg samples. The null hypothesis (the two distributions are extracted from the same parent population) can be safely rejected by a Kolmogorov–Smirnov test (p = 0.021). If only stars with high S/N (> 100) spectra are considered, this probability decreases to 8.8 × 10⁻³, and the difference of the mean values for [K/Fe] in the two Mg groups is even more significant (p = 2.7 × 10⁻³).
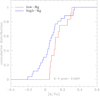 |
Fig. 4. Cumulative distributions of [K/Fe] abundance ratios for the stars with [Mg/Fe] higher and lower than 0.27 dex. The probability for the Kolmogorov–Smirnov test is also listed. |
Only 38 stars out of the 59 giants with derived K abundances also have [Mg/Fe] obtained in Carretta et al. (2014). This number increases to 46, 44, 55, 59, and 59 if we consider O, Na, Si, Ca, and Sc, providing a good opportunity to perform a consistency test on the astrophysical nature of abundance variations of K for NGC 4833. If the spread observed for K is due to the same network of proton-capture reactions responsible for shaping the chemical signature of multiple populations, and since the potassium abundances are anti-correlated to those of Mg, we should expect the [K/Fe] ratio to be correlated to light elements produced in these reactions and anti-correlated to those depleted in this H-burning.
This occurrence is examined in Fig. 5, where the abundances of K are compared to those of O, Na, and Si from Carretta et al. (2014). The [K/Fe] ratio decreases as O abundances increase, whereas it is roughly correlated to Na and Si abundances.
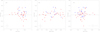 |
Fig. 5. Comparison of K abundances to the abundance ratios [O/Fe] (left panel), [Na/Fe] (middle panel), and [Si/Fe] (right panel). Symbols and error bars are the same as in Fig. 3. |
Finally, the run of [K/Fe] values as a function of abundances of Ca and Sc is shown in the two panels of Fig. 6. In these panels, the x-axis scale has been enlarged to better show the small variations seen in Ca and Sc abundances. We remind readers that the rms scatter found for K is more than six times the rms for the other two elements (about 0.02 dex from GIRAFFE spectra). Nevertheless, K abundances seem to be correlated to small star-to-star variations in both Ca and Sc, whose excesses with respect to the level of unpolluted field stars were clearly highlighted in Carretta & Bragaglia (2021) for NGC 4833.
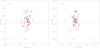 |
Fig. 6. Comparison of K abundances to the abundance ratios [Ca/Fe] (left panel) and [Sc/Fe] (right panel). Symbols and error bars are the same as in Fig. 3. |
3.2. Comparison with Roederer & Thompson (2015)
Roederer & Thompson (2015) analysed several elements in 15 giants of NGC 4833. As they discussed, differences in the derived abundances with respect to Carretta et al. (2014) are explained by the different scale of atmospheric parameters and solar reference abundance. However, when comparing abundances of potassium, we found a clear offset between the present analysis and their work (Fig. 7, upper panel, black squares).
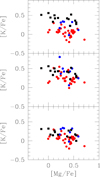 |
Fig. 7. [K/Fe] ratios as a function of [Mg/Fe] ratios in NGC 4833. Upper panel: our data are compared to the original data from Roederer & Thompson (2015: black filled squares). Middle panel: all K abundances were derived using the microturbulent velocity vt derived from Fe I lines. Lower panel: all K abundances were obtained using vt values from the relation as a function of surface gravity. |
We examined the possible causes for this discrepancy. The offset cannot be due to the adopted solar abundances for K and Fe, which imply a shift by 0.05 dex only. Corrections for non-LTE effects were derived from Takeda et al. (2002) in both studies. Roederer & Thompson (2015) used the K I 7664.87 Å line, which is not contaminated in their spectra, but after correcting for non-LTE they found that the two lines give the same abundance within 0.02 dex.
The reason is very likely due to the adopted values of the microturbulent velocity. Roederer & Thompson (2015) adopted the values of vt derived from Fe I lines, as is done in all the standard abundance analyses. As a consequence, we found that their K abundances show a trend as a function of vt. In the middle panel of Fig. 7, we use for our 59 stars our first analysis, so that all K abundances shown in the panel were derived using vt values from Fe I lines. There is no offset anymore. As a further confirmation, in the lower panel of Fig. 7 all abundances of K were obtained using the relation from Worley et al. (2013) for vt as a function of the surface gravity. The [K/Fe] ratios from the present work are in excellent agreement with those by Roederer & Thompson (2015), which are consistently anti-correlated to the [Mg/Fe] ratios.
4. NGC 4833 in context
The results of the present analysis both extend and confirm previous findings of a Mg-K anti-correlation in NGC 4833. These star-to-star abundance variations are not as extreme as those found in NGC 2419 (Cohen & Kirby 2012; Mucciarelli et al. 2012): NGC 4833 is more similar to NGC 2808, despite the large difference in metallicity.
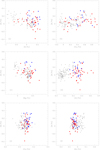 |
Fig. 8. Abundance ratios [K/Fe] in NGC 4833 and NGC 2808 as a function of abundances of O, Na, Mg, Si, Ca, and Sc. For NGC 4833, the symbols are the same as in Fig. 3. Stars in NGC 2808 are indicated by grey squares. |
In Fig. 8 we compare the pattern of light elements in NGC 4833 (present analysis and Carretta et al. 2014) and in NGC 2808 (Carretta 2015; Mucciarelli et al. 2015). Small residual offsets may exist concerning K abundances in NGC 2808 because Mucciarelli et al. (2015) adopted temperatures from Carretta et al. (2006), whereas in Carretta (2015) stars in NGC 2808 were analysed with a slightly different scale, but in general the abundance scale is as homogeneous as possible in the two GCs.
Apart from the clear offset in the average level of silicon, abundances in NGC 4833 trace those in NGC 2808 rather well, although on a smaller scale. The abundance spreads in O, Mg, Ca, and Sc observed in NGC 2808 are larger than the equivalent in NGC 4833, but the overall pattern is very similar. In both GCs, stars with low Mg abundances (reaching down to sub-solar values in a good fraction of stars in NGC 2808) tend to show high K abundances.
A compact summary of the relation among K, Mg, and Ca is given in Fig. 9, where the ratio [K/Mg] is plotted as a function of [Ca/H] in these two GCs. The values of [Ca/H] in NGC 4833 were shifted by applying an offset of 0.9 dex to account for the difference in metallicity between the two clusters. Again, apart for a larger spread observed in NGC 2808, there is a good match for the abundances of these species. The giants with higher abundances of K also tend to be slighly more rich in Ca (and Sc) in both NGC 2808 and NGC 4833. Both clusters are among the eight GCs where Carretta & Bragaglia (2021) recently found significant excesses of both species with respect to the level of field stars with a similar metallicity.
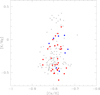 |
Fig. 9. [K/Mg] ratios as a function of the [Ca/H] ratios in NGC 4833 (same symbols as in Fig. 3) and in NGC 2808 (grey squares). An offset of 0.9 dex was added to the [Ca/H] ratios in NGC 4833 to account for the difference in metallicity with respect to NGC 2808. |
The present work seems to confirm that whenever significant star-to-star variations in Ca and Sc are detected, they are found to be accompanied by even larger variations in the K content. Evidence for this was provided by Cohen & Kirby (2012) and Carretta et al. (2013) in NGC 2419, by Carretta (2015) and Mucciarelli et al. (2015) in NGC 2808, and finally in NGC 4833 here. Also spectroscopic infrared data from APOGEE agree with this scenario nicely since the anti-correlation between K and Mg abundances in ω Cen (Mészáros et al. 2020) is paralleled to statistically significant variations in Ca and Sc (Carretta & Bragaglia 2021). Interestingly enough, Carretta & Bragaglia (2021) did not instead find robust evidence of Ca or Sc excesses in NGC 1904, a cluster whose K-Mg anti-correlation was argued by Mészáros et al. (2020) to be probably only due to the large uncertainties associated with the derived abundances.
To put data for NGC 4833 in context, in Fig. 10 we compare the results from the present work as well as for NGC 2808 to the K-Mg anti-correlation observed in NGC 2419 (left and middle panels, respectively). From these plots, it is clear again that depletions in Mg are more extreme in NGC 2808 than in NGC 4833, whereas the range spanned by K is more or less the same. Moreover, the large difference with respect to the case of NGC 2419 is immediately evident. All the variations in K content for the sub-populations of stars with primordial, intermediate, and extreme composition (see Carretta et al. 2009a for a definition of these different stellar populations in GCs) are confined in the same region of the K-Mg plane in normal GCs. However, even the stars with the most enhanced K abundances in these GCs are restricted in the group of stars with solar [K/Fe] ratios, on average, in NGC 2419. This peculiar GC also shows a noticeable fraction of giants with much more extreme values of K and Mg that have no correspondence in normal GCs: The chemical inventory of NGC 2419 appears to be really unique among GCs.
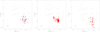 |
Fig. 10. Comparison of the K-Mg anti-correlation in different GCs. Left panel: red and blue circles are the stars of the present work (same symbols as in Fig. 3) for NGC 4833 superimposed to stars in NGC 2419 from Cohen & Kirby (2012: dark grey circles) and Mucciarelli et al. (2012: light grey symbols). Middle panel: red circles are stars in NGC 2808 from Carretta (2015) and Mucciarelli et al. (2015). Right panel: red circles indicate stars in NGC 6715 (M 54) from the preliminary analysis by Carretta (in prep.). |
A possibility to explain this uniqueness was discussed in Carretta et al. (2013), where we argued that the extreme population could be due to the polluting contribution of a pair-instability supernova (PISNe). The extreme rarity of such a peculiar SN (Ren et al. 2012) would account for the fact that the extreme population is only found (at least so far) in one cluster out of the about 150 of the whole GC population in the Milky Way. The strong overabundance of Ca going with extreme Mg depletions, predicted for polluting matter provided by PISN, was illustrated in Carretta et al. (2013) by using the [K/Mg] ratio as a function of [Ca/H]. For comparison, in NGC 2419 the [K/Mg] values of the extreme population would be off scale in Fig. 9, reaching the 2 dex level in the data by Mucciarelli et al. (2012).
Other predictions for PISNe (such as a strong odd-even effect in the chemical inventory) are not satisfied, however (see the detailed discussion in Carretta et al. 2013). At present, we can only reiterate that neither NGC 4833 nor NGC 2808 belong to the same class of NGC 2419.
In Fig. 11, we plotted the total absolute magnitude MV (a proxy for the observed, present-day mass of clusters) for the GCs in the Milky Way as a function of the metal abundance [Fe/H], from the Harris (1996, 2010 online edition) catalogue. Blue crosses indicate the eight GCs where Carretta & Bragaglia (2021) found significant excesses of Ca and Sc with respect to field stars. In order of increasing metallicity the GCs are NGC 2419, NGC 5824, NGC 4833, NGC 5139 (ω Cen), NGC 5986, NGC 6715 (M 54), NGC 6402, and NGC 2808. Red filled circles are superimposed to GCs where significant variations in K were detected: NGC 2419, NGC 2808, NGC 5139, and NGC 4833.
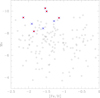 |
Fig. 11. Total absolute magnitude of GCs in the Milky Way (from Harris 1996, 2010 online edition) as a function of metallicity [Fe/H]. Blue crosses indicate GCs with significant excesses of Ca and Sc (Carretta & Bragaglia 2021). The filled red circles are superimposed to GCs, also showing significant variations in K abundances (see text). |
To these GCs, we also tentatively added NGC 6715 because preliminary results (Carretta, in prep.) of an analysis analogue to the present study seem to reveal a large scatter in K abundances, which are possibly anti-correlated to the Mg abundances from Carretta et al. (2010a), as shown in the right panel in Fig. 10. We caution, however, that this is still a work in progress and should be taken cum grano salis because the quality of spectra is lower than those used for NGC 4833 and even using the relation by Worley et al. (2013) the trend of K abundances as a function of vt is not completely eliminated, probably owing to the relatively large intrinsic dispersion in iron abundances in this cluster (∼0.19 dex, Carretta et al. 2010a).
The GCs where the effect of alterations of the abundances of K, Ca, and Sc is more evident appear to be confined to a region identified by high mass and low metallicity (Fig. 11). In the observational landascape associated with chemical signatures of multiple stellar populations in GCs, this is not unexpected. We have known for a long time that the minimum observed ratio [O/Fe]min in GCs is well reproduced by a linear bivariate relation as a function of cluster luminosity and metallicity (Carretta et al. 2009a). Analogously, the amount of the [Al/Fe]prod produced is found to be a function of a linear combination of the same parameters (Carretta et al. 2009b). Finally, the fraction of outliers with large excesses of Ca and Sc is again found to be well reproduced by a combination of MV and [Fe/H].
These findings, together with the sort of segregation observed in Fig. 11, prompted us to verify if the variations in K may also depend on these global cluster parameters. To better quantify the observed spread in K, we used the interquartile range of the [K/Fe] ratio, IQR[K/Fe]. By definition, the IQR is less sensitive to the outliers and, as shown for the [O/Na] ratio by Carretta (2006) and Carretta et al. (2010b), is a robust quantitative measure for the extent of the nuclear processing affecting polluted populations in GCs.
The required parameters are listed in Table 3 for six selected GCs. From the sample, we had to exclude the two most massive GCs in the Galaxy, namely ω Cen and M 54, for several reasons. Unlike the others, they are not mono-metallic GCs, showing a large spread in iron, and they both are presumably the nuclear remnants of ancient dwarf galaxies that merged with the Milky Way (e.g. Bekki & Freeman 2003; Bellazzini et al. 2008). The abundances of K derived for M 54 are still very preliminary, and those for ω Cen are obtained from IR spectra in APOGEE, so that they are not homogeneous with the set of abundances for the other GCs. Finally, the IQR[K/Fe] for ω Cen significantly depends on the selection criteria adopted by Mészáros et al. (2020) to extract the best sample. For the K-Mg anti-correlation, they used only stars with a metallicity of [Fe/H] < −1.5 dex (their Fig. 10), whereas it is well assessed that in this GC the most extreme processing due to the multiple population phenomenon is observed at intermediate metallicity, higher than −1.5 dex (e.g. Johnson & Pilachowski 2010; Marino et al. 2011). We then decided to conservatively exclude these two GCs, although we point out that the results of this check would not change with their inclusion in the sample.
Interquartile range IQR[K/Fe], luminosity, and metallicity for selected GCs.
In the left panel of Fig. 12, the observed values of IQR[K/Fe] are plotted as a function of the bivariate combination of MV and [Fe/H]. The Pearson correlation coefficient is also listed and obviously indicates that the relation is highly significant. It is also obvious that NGC 2419 is driving this correlation due to its extreme value. However, even when this peculiar GC is excluded, the combined dependence on the cluster luminosity and metallicity is very significant (probability p = 3.2 × 10⁻²) for the other five normal GCs.
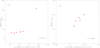 |
Fig. 12. Observed interquartile range of the [K/Fe] ratio (IQR[K/Fe]) as a function of a bivariate linear combination of MV and [Fe/H] for the GCs in Table 3. Left and right panel: NGC 2419 is included and excluded from the fit, respectively. |
Admittedly, the sample is small because the set of GCs with large enough numbers of stars with derived K abundances is still very limited. However, the low probability of obtaining such a statistically tight relation by mere chance seems to suggest that the extent of star-to-star variations in the K content is also related to the global cluster parameters as are other quantities (minimum oxygen reached, aluminium production, excesses of Ca and Sc). The conclusion is once again that in very massive and (or) metal-poor clusters, the K abundance variations are a good indicator of the H-burning proton capture reactions at very high temperatures.
5. Summary
We studied the distribution of potassium abundances in the metal-poor globular cluster NGC 4833, whose multiple stellar populations show a rather extreme chemical composition. We measured [K/Fe] ratios using the high resolution GIRAFFE setup HR18, whose spectral range includes the K I resonance doublet. The abundances of K were derived for 59 stars from the line at 7698.98 Å after cleaning the spectra for a small contamination from telluric lines. The abundances were corrected for non-LTE effects. Stellar parameters and abundances of proton-capture elements were already homogeneously obtained for the sample of stars in Carretta et al. (2014).
Our data show an anti-correlation between abundances of Mg and K, similar to the one observed in NGC 2808 by Mucciarelli et al. (2015), but much reduced with respect to the huge variations detected in NGC 2419 (Cohen & Kirby 2012; Mucciarelli et al. 2012). In NGC 4833 we found that K abundances are correlated to elements enhanced in proton-capture reactions (Na, Si) and anti-correlated to species depleted in the same network of nuclear reactions (Mg, O).
Evidence of slightly higher Ca and Sc abundances are observed among stars with the highest K abundances. These findings suggest that in NGC 4833, the FG polluters were acting to such a high temperature so as to also efficiently produce heavier elements such as K and possibly Ca, confirming the recent observations by Carretta & Bragaglia (2021) who detected statistically significant excesses of Ca and Sc in the fraction of stars with low Mg abundances in this cluster.
In coupling the census of 77 GCs by Carretta & Bragaglia (2021) with the sample of the few GCs where K abundances were extensively derived, we can appreciate how significant star-to-star abundance variations in K are always accompanied by smaller increases in Ca (and possibly Sc). The method ideated in Carretta & Bragaglia (2021) then represents an advantageous asset, since it is able to pick up chemical patterns generated in processes of H-burning at a very high temperature using abundances of more widely studied elements such as Ca and Sc, as opposed to the paucity of data for K in GCs.
We also found that the dispersion in K within an individual GC, measured by the interquartile range of the [K/Fe] ratio, is well reproduced by a linear combination of the cluster total absolute magnitude MV and metallicity [Fe/H], as are other indicators of the most extreme processing in multiple stellar populations. Although the sample of GCs used to derive this strong correlation is quite limited, this discovery lends support to the scenario where the production of K is due to proton-capture reactions occurring at very high temperatures (> 109 K) in stars where the efficiency of H-burning is enhanced in low-metallicity environments. The S-AGB stars are then a viable candidate (Ventura et al. 2012).
Then, in this framework, the peculiar globular cluster NGC 2808 may represent the true anomaly, being the most metal-rich GC ([Fe/H] = −1.14 dex) where significant K abundance variations have been detected so far. Clearly, other surveys for K abundances in GCs would be highly welcome.
Acknowledgments
This paper is based on data obtained from the ESO Science Archive Facility under request number 586933. I wish to thank Angela Bragaglia for valuable help and useful discussions, and all the people in the ESO Archive group, maintaining and supporting the ESO archive, which undoubtly qualifies as one of the largest and most efficient telescopes in the world. This research has made large use of the SIMBAD database (in particular Vizier), operated at CDS, Strasbourg, France, and of the NASA’s Astrophysical Data System.
References
- Bastian, N., & Lardo, C. 2018, ARA&A, 56, 83 [Google Scholar]
- Bekki, K., & Freeman, K. C. 2003, MNRAS, 346, L11 [NASA ADS] [CrossRef] [Google Scholar]
- Bellazzini, M., Ibata, R. A., Chapman, S. C., et al. 2008, AJ, 136, 1147 [NASA ADS] [CrossRef] [Google Scholar]
- Carretta, E. 2006, AJ, 131, 1766 [NASA ADS] [CrossRef] [Google Scholar]
- Carretta, E. 2015, ApJ, 810, 148 [NASA ADS] [CrossRef] [Google Scholar]
- Carretta, E., & Bragaglia, A. 2021, A&A, 646, A9 [EDP Sciences] [Google Scholar]
- Carretta, E., Bragaglia, A., Gratton, R. G., et al. 2006, A&A, 450, 523 [NASA ADS] [CrossRef] [EDP Sciences] [Google Scholar]
- Carretta, E., Recio-Blanco, A., Gratton, R. G., Piotto, G., & Bragaglia, A. 2007a, ApJ, 671, L125 [NASA ADS] [CrossRef] [Google Scholar]
- Carretta, E., Bragaglia, A., Gratton, R. G., Lucatello, S., & Momany, Y. 2007b, A&A, 464, 927 [NASA ADS] [CrossRef] [EDP Sciences] [Google Scholar]
- Carretta, E., Bragaglia, A., Gratton, R. G., et al. 2009a, A&A, 505, 117 [NASA ADS] [CrossRef] [EDP Sciences] [Google Scholar]
- Carretta, E., Bragaglia, A., Gratton, R. G., & Lucatello, S. 2009b, A&A, 505, 139 [NASA ADS] [CrossRef] [EDP Sciences] [Google Scholar]
- Carretta, E., Bragaglia, A., Gratton, R. G., D’Orazi, V., & Lucatello, S. 2009c, A&A, 508, 695 [NASA ADS] [CrossRef] [EDP Sciences] [Google Scholar]
- Carretta, E., Bragaglia, A., Gratton, R. G., et al. 2010a, A&A, 520, 95 [Google Scholar]
- Carretta, E., Bragaglia, A., Gratton, R. G., et al. 2010b, A&A, 516, 55 [NASA ADS] [CrossRef] [EDP Sciences] [Google Scholar]
- Carretta, E., Gratton, R. G., Bragaglia, A., et al. 2013, ApJ, 769, 40 [NASA ADS] [CrossRef] [Google Scholar]
- Carretta, E., Bragaglia, A., Gratton, R. G., et al. 2014, A&A, 564, A60 [NASA ADS] [CrossRef] [EDP Sciences] [Google Scholar]
- Cayrel, R. 1988, IAU Symp., 132, 345 [Google Scholar]
- Cohen, J. G., & Kirby, E. N. 2012, ApJ, 760, 86 [NASA ADS] [CrossRef] [Google Scholar]
- Denisenkov, P. A., & Denisenkova, S. N. 1989, A. Tsir., 1538, 11 [NASA ADS] [Google Scholar]
- Gratton, R. G. 1988, Rome Obs. Preprint Ser., 29 [Google Scholar]
- Gratton, R. G., Sneden, C., & Carretta, E. 2004, ARA&A, 42, 385 [NASA ADS] [CrossRef] [Google Scholar]
- Gratton, R. G., Carretta, E., & Bragaglia, A. 2012, A&ARv, 20, 50 [Google Scholar]
- Gratton, R. G., Bragaglia, A., Carretta, E., et al. 2019, A&ARv, 27, 8 [Google Scholar]
- Harris, W. E. 1996, AJ, 112, 1487 [NASA ADS] [CrossRef] [Google Scholar]
- Hubrig, S., Castelli, F., & de Silva, G. 2009, A&A, 499, 865 [NASA ADS] [CrossRef] [EDP Sciences] [Google Scholar]
- Iliadis, C., Karakas, A. I., Prantzos, N., Lattanzio, J. C., & Doherty, C. L. 2016, ApJ, 818, 98 [NASA ADS] [CrossRef] [Google Scholar]
- Johnson, C. I., & Pilachowski, C. A. 2010, ApJ, 722, 1373 [Google Scholar]
- Kacharov, N., Koch, A., Caffau, E., & Sbordone, L. 2015, A&A, 577, A18 [NASA ADS] [CrossRef] [EDP Sciences] [Google Scholar]
- Kirby, E. N., Guhathakurta, P., Bolte, M., Sneden, C., & Geha, M. 2009, ApJ, 705, 328 [NASA ADS] [CrossRef] [Google Scholar]
- Koch, A., & Caffau, E. 2011, A&A, 534, A52 [NASA ADS] [CrossRef] [EDP Sciences] [Google Scholar]
- Kraft, R. P. 1994, PASP, 106, 553 [NASA ADS] [CrossRef] [Google Scholar]
- Marino, A. F., Milone, A., Piotto, G., et al. 2011, ApJ, 731, 64 [NASA ADS] [CrossRef] [Google Scholar]
- Mészáros, S., Masseron, T., García-Hernández, D. A., et al. 2020, MNRAS, 492, 1641 [CrossRef] [Google Scholar]
- Mucciarelli, A., Bellazzini, M., Ibata, R., et al. 2012, MNRAS, 426, 2889 [NASA ADS] [CrossRef] [Google Scholar]
- Mucciarelli, A., Bellazzini, M., Merle, T., et al. 2015, ApJ, 801, 68 [NASA ADS] [CrossRef] [Google Scholar]
- Mucciarelli, A., Merle, T., & Bellazzini, M. 2017, A&A, 600, A104 [NASA ADS] [CrossRef] [EDP Sciences] [Google Scholar]
- Pancino, E., Romano, D., Tang, B., et al. 2017, A&A, 601, A112 [NASA ADS] [CrossRef] [EDP Sciences] [Google Scholar]
- Piotto, G., King, I. R., Djorgovski, S. G., et al. 2002, A&A, 391, 945 [NASA ADS] [CrossRef] [EDP Sciences] [Google Scholar]
- Roederer, I. U., & Thompson, I. B. 2015, MNRAS, 449, 3889 [NASA ADS] [CrossRef] [Google Scholar]
- Roederer, I. U., Marino, A. F., & Sneden, C. 2011, ApJ, 742, 37 [Google Scholar]
- Ren, J., Christlieb, N., & Zhao, G. 2012, Res. Astron. Astrophys., 12, 1637 [NASA ADS] [CrossRef] [Google Scholar]
- Sbordone, L., Limongi, M., Chieffi, A., et al. 2009, A&A, 503, 121 [NASA ADS] [CrossRef] [EDP Sciences] [Google Scholar]
- Smith, G. H. 1987, PASP, 99, 67 [NASA ADS] [CrossRef] [Google Scholar]
- Takeda, Y., Okhubo, M., & Sadakane, K. 2002, PASJ, 54, 451 [NASA ADS] [CrossRef] [Google Scholar]
- Takeda, Y., Kaneko, H., Matsumoto, N., et al. 2009, PASJ, 61, 562 [Google Scholar]
- Ventura, P., D’Antona, F., Di Criscienzo, M., et al. 2012, ApJ, 761, L30 [NASA ADS] [CrossRef] [Google Scholar]
- Worley, C. C., Hill, V., Sobeck, J., & Carretta, E. 2013, A&A, 553, A47 [NASA ADS] [CrossRef] [EDP Sciences] [Google Scholar]
All Tables
All Figures
|
Fig. 1. Colour-magnitude diagram V, B − V from the photometric catalogue in Carretta et al. (2014: small crosses). Stars selected for the present study are represented as larger filled circles. Blue symbols indicate stars with lower S/N spectra (see text). |
| In the text | |
|
Fig. 2. Example of cleaned spectra in three ranges of S/N. |
| In the text | |
|
Fig. 3. Abundance ratios [K/Fe] from the present analysis as a function of [Mg/Fe] ratios from Carretta et al. (2014). Blue points indicate stars whose co-added spectra are of a lower quality (S/N < 100). The horizontal line is at the average value of [K/Fe] derived from high S/N spectra. Internal error bars are also shown. |
| In the text | |
|
Fig. 4. Cumulative distributions of [K/Fe] abundance ratios for the stars with [Mg/Fe] higher and lower than 0.27 dex. The probability for the Kolmogorov–Smirnov test is also listed. |
| In the text | |
|
Fig. 5. Comparison of K abundances to the abundance ratios [O/Fe] (left panel), [Na/Fe] (middle panel), and [Si/Fe] (right panel). Symbols and error bars are the same as in Fig. 3. |
| In the text | |
|
Fig. 6. Comparison of K abundances to the abundance ratios [Ca/Fe] (left panel) and [Sc/Fe] (right panel). Symbols and error bars are the same as in Fig. 3. |
| In the text | |
|
Fig. 7. [K/Fe] ratios as a function of [Mg/Fe] ratios in NGC 4833. Upper panel: our data are compared to the original data from Roederer & Thompson (2015: black filled squares). Middle panel: all K abundances were derived using the microturbulent velocity vt derived from Fe I lines. Lower panel: all K abundances were obtained using vt values from the relation as a function of surface gravity. |
| In the text | |
|
Fig. 8. Abundance ratios [K/Fe] in NGC 4833 and NGC 2808 as a function of abundances of O, Na, Mg, Si, Ca, and Sc. For NGC 4833, the symbols are the same as in Fig. 3. Stars in NGC 2808 are indicated by grey squares. |
| In the text | |
|
Fig. 9. [K/Mg] ratios as a function of the [Ca/H] ratios in NGC 4833 (same symbols as in Fig. 3) and in NGC 2808 (grey squares). An offset of 0.9 dex was added to the [Ca/H] ratios in NGC 4833 to account for the difference in metallicity with respect to NGC 2808. |
| In the text | |
|
Fig. 10. Comparison of the K-Mg anti-correlation in different GCs. Left panel: red and blue circles are the stars of the present work (same symbols as in Fig. 3) for NGC 4833 superimposed to stars in NGC 2419 from Cohen & Kirby (2012: dark grey circles) and Mucciarelli et al. (2012: light grey symbols). Middle panel: red circles are stars in NGC 2808 from Carretta (2015) and Mucciarelli et al. (2015). Right panel: red circles indicate stars in NGC 6715 (M 54) from the preliminary analysis by Carretta (in prep.). |
| In the text | |
|
Fig. 11. Total absolute magnitude of GCs in the Milky Way (from Harris 1996, 2010 online edition) as a function of metallicity [Fe/H]. Blue crosses indicate GCs with significant excesses of Ca and Sc (Carretta & Bragaglia 2021). The filled red circles are superimposed to GCs, also showing significant variations in K abundances (see text). |
| In the text | |
|
Fig. 12. Observed interquartile range of the [K/Fe] ratio (IQR[K/Fe]) as a function of a bivariate linear combination of MV and [Fe/H] for the GCs in Table 3. Left and right panel: NGC 2419 is included and excluded from the fit, respectively. |
| In the text | |
Current usage metrics show cumulative count of Article Views (full-text article views including HTML views, PDF and ePub downloads, according to the available data) and Abstracts Views on Vision4Press platform.
Data correspond to usage on the plateform after 2015. The current usage metrics is available 48-96 hours after online publication and is updated daily on week days.
Initial download of the metrics may take a while.