Free Access
Fig. 3.
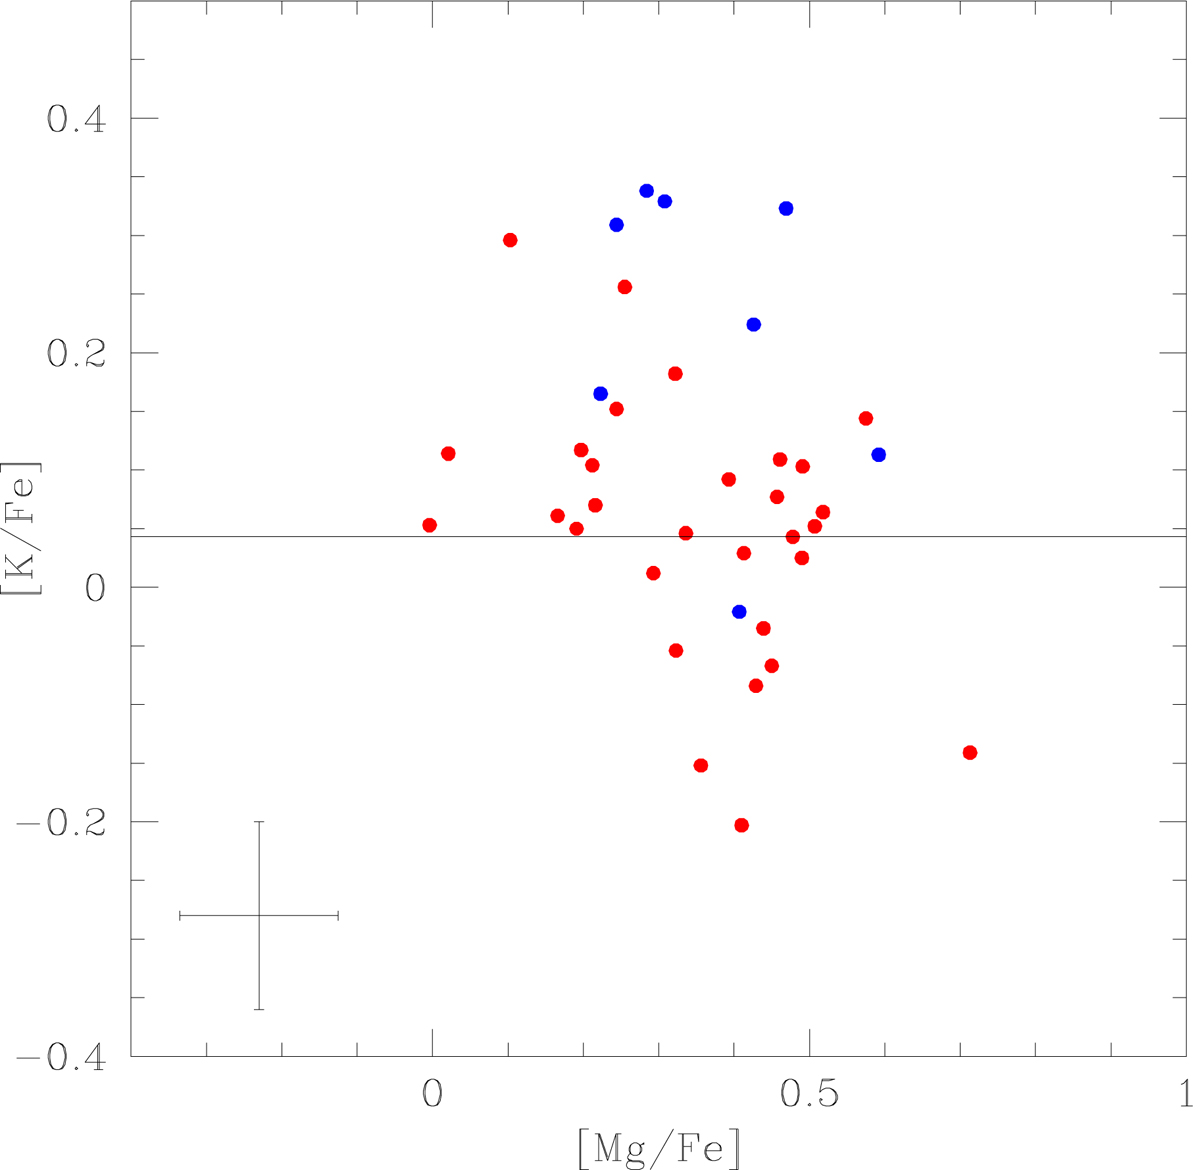
Abundance ratios [K/Fe] from the present analysis as a function of [Mg/Fe] ratios from Carretta et al. (2014). Blue points indicate stars whose co-added spectra are of a lower quality (S/N < 100). The horizontal line is at the average value of [K/Fe] derived from high S/N spectra. Internal error bars are also shown.
Current usage metrics show cumulative count of Article Views (full-text article views including HTML views, PDF and ePub downloads, according to the available data) and Abstracts Views on Vision4Press platform.
Data correspond to usage on the plateform after 2015. The current usage metrics is available 48-96 hours after online publication and is updated daily on week days.
Initial download of the metrics may take a while.