| Issue |
A&A
Volume 626, June 2019
|
|
|---|---|---|
| Article Number | A69 | |
| Number of page(s) | 6 | |
| Section | Stellar structure and evolution | |
| DOI | https://doi.org/10.1051/0004-6361/201935221 | |
| Published online | 14 June 2019 | |
Discovery of an old nova remnant in the Galactic globular cluster M 22⋆
1
Institut für Astrophysik, Georg-August-Universität Göttingen, Friedrich-Hund-Platz 1, 37077 Göttingen, Germany
e-mail: This email address is being protected from spambots. You need JavaScript enabled to view it.
2
Leibniz-Institut für Astrophysik Potsdam (AIP), An der Sternwarte 16, 14482 Potsdam, Germany
3
Astrophysics Research Institute, Liverpool John Moores University, 146 Brownlow Hill, Liverpool L3 5RF, UK
4
Instituto de Astrofísica e Ciências do Espaço, Universidade do Porto, CAUP, Rua das Estrelas, 4150-762 Porto, Portugal
5
Leiden Observatory, Leiden University, PO Box 9513, 2300 RA Leiden, The Netherlands
6
Institut für Physik und Astronomie, Universität Potsdam, Karl-Liebknecht-Str. 24/25, 14476 Golm, Germany
7
Instituto de Astrofísica de Canarias (IAC), 38205 La Laguna, Tenerife, Spain
8
Universidad de La Laguna, Dpto. Astrofísica, 38205 La Laguna, Tenerife, Spain
9
Univ. Lyon, Univ. Lyon1, ENS de Lyon, CNRS, Centre de Recherche Astrophysique de Lyon UMR 5574, 69230 Saint-Genis-Laval, France
Received:
6
February
2019
Accepted:
8
April
2019
Abstract
A nova is a cataclysmic event on the surface of a white dwarf in a binary system that increases the overall brightness by several orders of magnitude. Although binary systems with a white dwarf are expected to be overabundant in globular clusters compared with in the Galaxy, only two novae from Galactic globular clusters have been observed. We present the discovery of an emission nebula in the Galactic globular cluster M 22 (NGC 6656) in observations made with the integral-field spectrograph MUSE. We extracted the spectrum of the nebula and used the radial velocity determined from the emission lines to confirm that the nebula is part of NGC 6656. Emission-line ratios were used to determine the electron temperature and density. It is estimated to have a mass of 1–17 × 10−5M⊙. This mass and the emission-line ratios indicate that the nebula is a nova remnant. Its position coincides with the reported location of a “guest star”, an ancient Chinese term for transients, observed in May 48 BCE. With this discovery, this nova may be one of the oldest confirmed extra-solar events recorded in human history.
Key words: globular clusters: individual: NGC 6656 / novae, cataclysmic variables / techniques: imaging spectroscopy
Datacubes are also available at the CDS via anonymous ftp to cdsarc.u-strasbg.fr (130.79.128.5) or via http://cdsarc.u-strasbg.fr/viz-bin/qcat?J/A+A/626/A69
© ESO 2019
1. Introduction
Novae are eruptions on the surface of an accreting white dwarf in a cataclysmic variable (CV) binary system (Iben & Fujimoto 2008). Hydrogen fusion sets in suddenly when the mass of the accreted hydrogen-rich material on the surface of the white dwarf exceeds a critical value. The energy set free by fusion causes an eruption on the surface and increases the luminosity by several orders of magnitude. The hydrogen-rich matter, possibly mixed with heavier elements of the interior of the white dwarf, is pushed off from the white dwarf with high velocity (> 103 km s−1) and interacts with the interstellar medium. Although cataclysmic variables are expected to be overabundant in globular clusters (GCs) compared to the Galactic field (Ivanova et al. 2006; Knigge 2012), novae in Galactic globular clusters are very rarely observed. While there are several observations of novae from extra-galactic globular clusters (e.g. Shafter & Quimby 2007; Henze et al. 2009, 2013; Curtin et al. 2015), there have been only two observations of classical novae (i.e. a CV without multiple observed eruptions) in Galactic globular clusters: T Sco in the core of NGC 6093 (M 80) in 1860 (Pogson 1860; Sawyer 1938) and a nova in NGC 6402 (M 14) in 1938 (Hogg & Wehlau 1964).
Supernovae and novae have been known to Chinese, Arabic, Greek, and Babylonian astronomers for thousands of years (Kelley & Milone 2005). In Chinese records, these new stars are called “guest stars” because they appear, stay for a while and then disappear. The oldest Chinese astronomical inscriptions are 3400 years old and were found on “oracle bones” (Pankenier et al. 2015). Today, we know that supernovae and novae fit the description of guest stars, while comets were usually classified differently (Stephenson & Green 2009). For example, the supernova that occurred in 1054 CE was described by several Chinese and Arabic sources (Kelley & Milone 2005), and its remnant is known today as the Crab nebula (M 1). In the case of Nova Scorpii, 1437 CE observed by Korean astronomers, Shara et al. (2017) showed that proper motions can be used to identify the CV underlying this nova and to determine the age of its remnant independently. Even earlier, a guest star observed by the Chinese in 77 BCE may have been a classical nova outburst of Z Camelopardalis (Shara et al. 2007, 2012; Johansson 2007), although the location of the guest star is very poorly known (Stephenson & Green 2009).
Emission nebulae created from ejected material allow observers to investigate the respective supernova or nova that may have happened hundreds or thousands of years ago. Gas inside globular clusters that could be visible as a nebula is also rare (see references in Barmby et al. 2009; Lynch & Rossano 1990). The only visible occurrences in GCs seem to be planetary nebulae (PNe). While there are thousands of PNe known in the Milky Way disc, only four PNe have been detected in ∼150 Galactic globular clusters: Ps1 in NGC 7078 (Pease 1928), GJJC-1 in NGC 6656 (Gillett et al. 1989), JaFu-1 in Pal 6, and JaFu-2 in NGC 6441 (both Jacoby et al. 1997).
NGC 6656 (Messier 22) is one of about 150 Galactic globular clusters, its distance to the Sun is 3.2 kpc (Cudworth 1986; Harris 1996, 2010 version). In addition to having a PN, NGC 6656 sticks out from the set of all Galactic globular clusters because it is one of the few for which stellar-mass black holes have been detected. Strader et al. (2012) detected two accreting stellar-mass black holes in this cluster using X-ray and radio observations which they named M22-VLA1 and -VLA2. Using numerical models and observational parameters of Galactic GCs, Askar et al. (2018) predict that NGC 6656 harbours a population of about 30 stellar mass black holes giving rise to its large half-light radius of 1.3 pc (Harris 1996, 2010 version).
2. MUSE observations and data reduction
We observed NGC 6656 over a period of seven nights in the period 2015–2017 with MUSE (Bacon et al. 2010), an integral-field spectrograph at the ESO Very Large Telescope (VLT). MUSE has a field of view of 1′×1′, a spatial sampling of 0 2, and spectral resolution R between 1800 and 3500 in the spectral range from 4750 to 9350 Å. These observations are part of an ongoing survey of 26 Galactic globular clusters (PI: S. Dreizler, Husser et al. 2016; Kamann et al. 2016, 2018; Giesers et al. 2018). For details on the observations and data reduction, we refer to Kamann et al. (2018). Details about observations of NGC 6656 are listed in Table 1, including the image quality measured in the final datacubes after reduction. Each MUSE observation of NGC 6656 has an integration time of ten minutes.
MUSE observations of the region containing the nebula.
3. A new nebula in NGC 6656
As part of a systematic search for emission line sources in Galactic globular clusters (Göttgens et al., in prep.), we detected a small emission nebula in NGC 6656 at a distance of about 14″ from the cluster centre. The region containing the nebula is shown in Fig. 1 with a MUSE observation collapsed along the spectral direction together with the [N II]λ6583 flux after the flux of adjacent layers is subtracted.
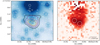 |
Fig. 1. MUSE whitelight detail image of the region in NGC 6656 containing the nebula created from a single observation (left). Contours give the combined [N II]λλ6548, 6583 emission flux after subtracting the stellar background (see Sect. 3.1). White circles represent HST sources from the catalogue of Nardiello et al. (2018), the diameter scales with F606W magnitude. The median flux in the four layers containing the [N II]λ6583 emission line is shown after the median flux in three adjacent layers was subtracted (right). The two apertures used to extract the spectrum of the nebula are shown as white circles. |
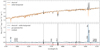 |
Fig. 2. Average spectrum extracted from two circular aperatures covering the new nebula (top panel, black). This is decomposed into stellar background (top panel, orange) and gas (bottom panel, black and blue). The residuals after fitting Gaussian functions to the emission lines are shown in red (bottom panel). Grey boxes indicate regions dominated by telluric features. |
3.1. Flux map and spectral properties
Flux maps and spectra that are extracted with a simple aperture contain a large amount of stellar flux from sources close to the nebula. To better disentangle stellar background and ionized gas emission, we employed pPXF (Python version 6.7.12, dated 9 July 2018, Cappellari & Emsellem 2004; Cappellari 2017), the penalized pixel-fitting method that is widely used for full-spectrum fitting with the goal of extracting kinematics of gas and stars and to estimate stellar populations. We chose to describe the spectra with two sets of templates:
-
1.
The stellar background was modelled using the empirical stellar library MILES (Sánchez-Blázquez et al. 2006; Falcón-Barroso et al. 2011). We took the full library of individual stars that samples the expected range of stars in NGC 6656 well enough. However, we did not preselect the stellar spectra, but let pPXF select the best fit.
-
2.
The gas emission was modelled with a set of Gaussian functions, at the positions of the expected relevant lines (see Table A.1).
pPXF then optimizes the stellar-background fit and also computes emission-line fluxes. We used 100 Monte-Carlo iterations using the fit residuals to estimate errors of the emission-line fluxes. As instrumental width, we took the FWHM of the wavelength-dependent MUSE line spread function as computed by the pipeline, convolved to 1.25 Å pix−1 sampling. As input spectra to pPXF we used two spectra integrated over 0 4 radial apertures (see Fig. 1), placed on the apparent peaks of the Hα emission, as well as all individual spectra in the region around the nebula. We extracted the spectra from a datacube that combined all available non-AO observing epochs (21 exposures over seven observations with a total integration time of 70 min). Since the AO data has a slightly different wavelength coverage and a broad gap in the region of NaD and in this case did not actually improve S/N or FWHM significantly, we chose not to include them in the combined deep dataset. The contour lines in Fig. 1 give the combined [N II]λλ6548, 6583 emission flux after subtracting the stellar background. In this map, the nebula appears as an ellipse of 2.5″ × 2″, corresponding to 0.04 pc × 0.03 pc at the cluster distance of 3.2 kpc (Cudworth 1986). Figure 1 also shows the [N II]λ6583 spectral layer after subtracting the mean flux of the adjacent layers. While this map does not rely on model assumptions, it contains stronger residuals from the bright star above the nebula. We have made the datacube created from all non-AO observations and the extracted spectrum publicly available1.
The average spectrum of the two circular apertures is shown in Fig. 2 together with its decomposition into the modelled stellar background and ionised gas. The spectrum clearly contains strong Hα, Hβ and [N II]λλ5755,6548,6583 emission lines, as well as weaker emission lines from [O III]λλ4959,5007, [S II]λλ6716,6731, and He Iλλ5876,6678.
Gaussian fits to the emission lines reveal a line-of-sight (LOS) velocity of −140 ± 1 km s−1. This is consistent with the assumption that the nebula is comoving with NGC 6656 which has a LOS velocity of −146 km s−1 (Harris 1996, 2010 version) and a central LOS velocity dispersion of 9 km s−1 (Kamann et al. 2018). The matching LOS velocity and the small apparent separation from the cluster centre of 14″ suggest that the nebula is located inside NGC 6656. We further justify this assumption by comparing the expected nova rates from the cluster and the Galactic field (see Appendix). There are narrow-band Hα HST observations taken with WFPC2 of this region but the nebula is not visible in them.
3.2. Mass of the nebula
We estimated the mass of the visible nebula using PyNeb (version 1.1.7, dated 18 October 2018, Luridiana et al. 2015) and the equation for the total gas mass given in Corradi et al. (2015) and used in Sahman et al. (2018). Since the total amount of intra-cluster medium in globular clusters is very low (e.g. about 0.3 M⊙ in the core of NGC 7078, van Loon et al. 2006), we assume that the nebula mass directly corresponds to the mass of the nova ejecta. This is not true for novae in the Galactic field, as the ejecta sweep up interstellar medium which increases the total mass of the nebula and decelerates its expansion (Duerbeck 1987; Shara et al. 2017; Darnley et al. 2019).
We used the measured emission line fluxes (given here in units of 10−17 erg s−1 cm−2) including 1-σ uncertainties of [N II] jλ5755 = 0.06 ± 0.08 and jλ6583 = 1.8 ± 0.1 together with the [S II] fluxes of jλ6731 = 0.15 ± 0.09 and jλ6716 = 0.13 ± 0.10 as input for PyNeb to estimate an electron temperature  K and an electron density
  cm−3.
cm−3.
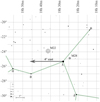 |
Fig. 3. Chart of the sky close to λ Sgr generated as it appeared to a Chinese observer in the May 48 BCE. The grey arrow points to the approximate location of the ancient observation. The globular cluster NGC 6656 (M 22) is located about 2.5° north-west of this location (about 2.3° north-east of λ Sgr). This chart was generated using XEphem (version 3.7.3, Downey 2011). |
To estimate the mass of the nebula, we used the equation given in Corradi et al. (2015) which requires the total de-reddened Hβ flux. We corrected the reddening using PyNeb with the extinction law of Fitzpatrick (1999) and an E(B − V) = 0.34 (Harris 1996, 2010 version), R = 3.1, and a distance to the nebula of 3.2 ± 0.3 kpc (Cudworth 1986). With a total de-reddened Hβ flux of (1.9 ± 0.3)×10−15 erg s−1 cm−2, we obtain an estimate for the nebula mass of 1–17 × 10−5M⊙. The range takes into account the distance and flux uncertainties as well as the resulting uncertainties in electron temperature and density. This mass estimate is well within both the expected and observed ranges for nova shells (see Table 3 in Yaron et al. 2005) of 10−7–10−4M⊙ (expected) and 1–30 × 10−5M⊙ (observed).
4. Discussion
While our mass estimate places the nebula in the range of nova remnants, there are no known novae at this position. This raises the question whether there are other indications of a nova origin.
4.1. Relation to the guest star 48 BCE
Ancient Chinese records in the Book of Han contain a guest star observed in May 48 BCE in the Chinese constellation Nandou (Stephenson & Green 2009). The name “guest star” was used by Chinese astronomers for what we today call a nova or a supernova. Comets were typically not called guest stars – they had their own category since they could be distinguished by their diffuse appearance and quick apparent motion on the sky. In the Book of Han, the location of the guest star in 48 BCE is given as 4 chi east of the second star in Nandou (= λ Sgr), the separation corresponds roughly to 4 degrees (Stephenson & Green 2009). Figure 3 illustrates where the stars in the region close to the guest star were located in May 48 BCE. The globular cluster NGC 6656 is located at  ,
,  , about 2.3° north-east of λ Sgr in the year 48 BCE, calculated with astropy
2 using Gaia DR2 coordinates and proper motions (Gaia Collaboration 2018; Helmi et al. 2018). According to Stephenson & Green (2009), there is no known supernova remnant within 15 deg of the recorded position. We argue that the guest star observed in 48 BCE was a nova that occurred in NGC 6656 and that it is the remnant of this nova that we have detected with MUSE.
, about 2.3° north-east of λ Sgr in the year 48 BCE, calculated with astropy
2 using Gaia DR2 coordinates and proper motions (Gaia Collaboration 2018; Helmi et al. 2018). According to Stephenson & Green (2009), there is no known supernova remnant within 15 deg of the recorded position. We argue that the guest star observed in 48 BCE was a nova that occurred in NGC 6656 and that it is the remnant of this nova that we have detected with MUSE.
4.1.1. Measurement errors in the year 48 BCE
The position of the recorded guest star and the observed nova remnant do not coincide exactly. NGC 6656 is rather to the north-east of the reference star instead of east, and the distance is not 4 deg but 2.3 deg. However, the uncertain conversion of chi to degrees and measurement errors in the recorded distance and direction have to be taken into account. For example, Shara et al. (2017) use a broad range of conversion factors from 0.44 to 2.8 chi deg−1. As determined by Kiyoshi (1967) and quoted by Ho et al. (1972), the error in stellar positions in observations made approximately 1000 years later is between 0.5 and 1 deg. This is the smallest error possible using the techniques available in 48 BCE. The Chinese recording associated with the supernova of 1054, which produced the Crab nebula (M 1), even gives a direction to a reference star that is exactly the opposite of what is observed today (Ho et al. 1972). Given these known inaccuracies of ancient Chinese measurements, we are confident that the guest star position matches the position of NGC 6656.
4.1.2. Nova and nebula brightness
Whether a nova from NGC 6656 would be visible to the naked eye depends on the distance to the cluster and the absolute nova brightness. A typical Milky Way nova has an absolute brightness of −7 ± 1.4 mag as determined by Schaefer (2018) using Gaia DR2 parallaxes. Combined with the distance to NGC 6656 (3.2 kpc, corresponding to a distance modulus of 12.38 mag, Cudworth 1986), this yields an apparent brightness of 5.38 ± 1.4 mag for a GC nova. Using this estimate, about 40% of all novae in NGC 6656 reach an apparent brightness of 5 mag or brighter, which could be seen with the naked eye. About 4–5% of all novae reach an apparent brightness of at least 3 mag. This shows that the nova that produced the emission nebula in NGC 6656 could have been visible to Chinese observers.
Furthermore, we estimate a brightness from the emission line spectrum without the stellar continuum of 25 mag in the Johnson V band. Using the nova remnant dimming rate of 10 ± 3 mmag yr−1 (Duerbeck 1992) and the nova brightness distribution above, we obtain an age of  years, which is consistent with the date of the guest star.
4.2. Alternative interpretations
There are several types of emission-line objects that have spectra resembling those of nova remnants, for example, planetary nebulae. The mass of a typical Galactic PN is 0.1 to 1 solar masses (Osterbrock 1974), while it can be as low as 10−4–10−3M⊙ for PNe with a binary central star (Corradi et al. 2015). Since our estimate yields a mass of 1–17 × 10−5M⊙ and because of our weak [O III]λ5007 flux, we can exclude a PN as an alternative explanation. In the case of a PN, one would also expect a very hot and bright (post-AGB) central star as the source of the ionisation energy but such a star is not visible in the HST photometry. We can exclude the possibility that the nebula is a supernova remnant because its flux ratio of [S II] to Hα is lower than the canonical value of 0.4 (Mathewson & Clarke 1973). Another explanation would be a merger of two stars which increases the overall brightness and thus could look similar to a nova during outburst. The Nova Vulpeculae 1670 seems to have been such a merger (Kamiński et al. 2015), possibly of a white dwarf and a brown dwarf (Eyres et al. 2018). The bipolar nebula identified with this merger was studied extensively, its mass is estimated to be between 0.01 and 0.1 solar masses (Eyres et al. 2018) or even as high as one solar mass (Kamiński et al. 2015). Thus, we can also exclude a stellar merger as a source of the observed nebula. Symbiotic stars, that is, binary systems consisting of interacting red giants and white dwarfs embedded in a nebula fuelled by stellar winds, can have spectra similar to novae. We can exclude a symbiotic star as a mimic because there is no red giant star in the centre of the nebula. We also checked the November 2017 pre-release of the Chandra Source Catalog Release 2.0 (Evans et al. 2010) for X-ray sources close to the nebula that could act as an ionisation source. The only X-ray source in this region is associated with M22-VLA2, one of the two stellar mass black holes in this globular cluster (Strader et al. 2012).
5. Summary
We detect a new emission nebula in the globular cluster NGC 6656 using MUSE integral-field observations. After combining exposures from seven observations and modelling the stellar background, we extract a clean spectrum of the nebula. The spectrum has very strong Balmer and [N II] emission lines, as well as several weaker emission lines from [O I], [O III], [S II] and He I. LOS velocity measurements are consistent with the assumption that the nebula is comoving with NGC 6656. We estimate that the mass of the nebula is between 1 and 17 × 10−5M⊙, this estimate is well within the typical observed mass range for the ejecta of classical novae and outside the typical values for planetary nebulae or stellar merger remnants, which can have a spectrum similar to that of novae.
Ancient Chinese records of astronomical observations include a guest star, a term used for supernovae and novae, which appeared in 48 BCE within ∼2.3° of the location of NGC 6656 on the sky. The position offset between the recorded guest star and NGC 6656 is within the uncertainty range of ancient observations. The expected absolute visual brightness of novae at the distance of NGC 6656 indicates that a cluster nova would have been visible to the naked eye. We conclude that the nebula detected with MUSE is a nova remnant that was caused by the guest star observed roughly 2000 years ago by Chinese astronomers.
Version 3.0.5, www.astropy.org
https://model.obs-besancon.fr/, last modified January 18, 2019; used on February 2, 2019.
Acknowledgments
We thank the anonymous referee for the constructive report which helped to improve the quality of the work. We also thank Frederic V. Hessman and Francis R. Stephenson for the helpful discussions. FG, SK and SD acknowledge support from the German Research Foundation (DFG) through projects KA 4537/2-1 and DR 281/35-1. SK gratefully acknowledges funding from a European Research Council consolidator grant (ERC-CoG-646928- Multi-Pop). PMW, SK, SD and BG also acknowledge support from the German Ministry for Education and Science (BMBF Verbundforschung) through projects MUSE-AO, grants 05A14BAC and 05A14MGA, and MUSE-NFM, grants 05A17MGA and 05A17BAA. JB acknowledges support by FCT/MCTES through national funds by this grant UID/FIS/04434/2019 and through the Investigador FCT Contract No. IF/01654/2014/CP1215/CT0003. AMI acknowledges support from the Spanish MINECO through project AYA2015-68217-P. RB acknowledges support from the ERC advanced grant 339659-MUSICOS. Based on observations made with ESO Telescopes at the La Silla Paranal Observatory under programme IDs 095.D-0629, 097.D-0295, 099.D-0019, and 0100.D-0161. Also based on observations made with the NASA/ESA Hubble Space Telescope, obtained from the data archive at the Space Telescope Science Institute. STScI is operated by the Association of Universities for Research in Astronomy, Inc. under NASA contract NAS 5-26555.
References
- Askar, A., Arca Sedda, M., & Giersz, M. 2018, MNRAS, 478, 1844 [NASA ADS] [CrossRef] [Google Scholar]
- Bacon, R., Accardo, M., Adjali, L., et al. 2010, in Ground-based and Airborne Instrumentation for Astronomy III, International Society for Optics and Photonics, 7735, 773508 [CrossRef] [Google Scholar]
- Barmby, P., Boyer, M. L., Woodward, C. E., et al. 2009, AJ, 137, 207 [NASA ADS] [CrossRef] [Google Scholar]
- Cappellari, M. 2017, MNRAS, 466, 798 [NASA ADS] [CrossRef] [Google Scholar]
- Cappellari, M., & Emsellem, E. 2004, PASP, 116, 138 [NASA ADS] [CrossRef] [Google Scholar]
- Corradi, R. L. M., Garcí-Rojas, J., Jones, D., & Rodríguez-Gil, P. 2015, ApJ, 803, 99 [NASA ADS] [CrossRef] [Google Scholar]
- Cudworth, K. M. 1986, AJ, 92, 348 [NASA ADS] [CrossRef] [Google Scholar]
- Curtin, C., Shafter, A. W., Pritchet, C. J., et al. 2015, ApJ, 811, 34 [NASA ADS] [CrossRef] [Google Scholar]
- Darnley, M. J., Hounsell, R., O’Brien, T. J., et al. 2019, Nature, 565, 460 [NASA ADS] [CrossRef] [Google Scholar]
- Downey, E. C. 2011, Astrophysics Source Code Library [recod ascl:1112.013] [Google Scholar]
- Duerbeck, H. W. 1987, Astrophys. Space Sci., 131, 461 [Google Scholar]
- Duerbeck, H. W. 1992, MNRAS, 258, 629 [NASA ADS] [CrossRef] [Google Scholar]
- Evans, I. N., Primini, F. A., Glotfelty, K. J., et al. 2010, ApJS, 189, 37 [NASA ADS] [CrossRef] [EDP Sciences] [Google Scholar]
- Eyres, S. P. S., Evans, A., Zijlstra, A., et al. 2018, MNRAS, 481, 4931 [NASA ADS] [Google Scholar]
- Falcón-Barroso, J., Sánchez-Blázquez, P., Vazdekis, A., et al. 2011, A&A, 532, A95 [NASA ADS] [CrossRef] [EDP Sciences] [Google Scholar]
- Fitzpatrick, E. L. 1999, PASP, 111, 63 [NASA ADS] [CrossRef] [Google Scholar]
- Gaia Collaboration (Brown, A. G. A., et al.) 2018, A&A, 616, A1 [NASA ADS] [CrossRef] [EDP Sciences] [Google Scholar]
- Giesers, B., Dreizler, S., Husser, T.-O., et al. 2018, MNRAS, 475, L15 [NASA ADS] [CrossRef] [Google Scholar]
- Gillett, F. C., Jacoby, G. H., Joyce, R. R., et al. 1989, ApJ, 338, 862 [NASA ADS] [CrossRef] [Google Scholar]
- Harris, W. E. 1996, AJ, 112, 1487 [NASA ADS] [CrossRef] [Google Scholar]
- Helmi, A., Leeuwen, F. V., McMillan, P. J., et al. 2018, A&A, 616, A12 [NASA ADS] [CrossRef] [EDP Sciences] [Google Scholar]
- Henze, M., Pietsch, W., Haberl, F., et al. 2009, A&A, 500, 769 [NASA ADS] [CrossRef] [EDP Sciences] [Google Scholar]
- Henze, M., Pietsch, W., Haberl, F., et al. 2013, A&A, 549, A120 [NASA ADS] [CrossRef] [EDP Sciences] [Google Scholar]
- Ho, P.-Y., Paar, F. W., & Parsons, P. W. 1972, Vistas Astron., 13, 1 [NASA ADS] [CrossRef] [Google Scholar]
- Hogg, H. S., & Wehlau, A. 1964, AJ, 69, 141 [CrossRef] [Google Scholar]
- Husser, T.-O., Kamann, S., Dreizler, S., et al. 2016, A&A, 588, A148 [NASA ADS] [CrossRef] [EDP Sciences] [Google Scholar]
- Iben, Jr., I., & Fujimoto, M. Y. 2008, in Classical Novae, eds. M. F. Bode, & A. Evans (Cambridge: Cambridge University Press), Cambridge Astrophysics Series, 43 [Google Scholar]
- Ivanova, N., Heinke, C. O., Rasio, F. A., et al. 2006, MNRAS, 372, 1043 [NASA ADS] [CrossRef] [Google Scholar]
- Jacoby, G. H., Morse, J. A., Fullton, L. K., Kwitter, K. B., & Henry, R. B. C. 1997, AJ, 114, 2611 [NASA ADS] [CrossRef] [Google Scholar]
- Johansson, G. H. I. 2007, Nature, 448, 251 [NASA ADS] [CrossRef] [Google Scholar]
- Kamann, S., Husser, T.-O., Brinchmann, J., et al. 2016, A&A, 588, A149 [NASA ADS] [CrossRef] [EDP Sciences] [Google Scholar]
- Kamann, S., Husser, T.-O., Dreizler, S., et al. 2018, MNRAS, 473, 5591 [NASA ADS] [CrossRef] [Google Scholar]
- Kamiński, T., Menten, K. M., Tylenda, R., et al. 2015, Nature, 520, 322 [NASA ADS] [CrossRef] [PubMed] [Google Scholar]
- Kelley, D. H., & Milone, E. F. 2005, Exploring Ancient Skies: An Encyclopedic Survey of Archaeoastronomy (New York: Springer-Verlag) [CrossRef] [Google Scholar]
- Kiyoshi, Y. 1967, Sōgen jidai no kagaku gijutsu shi (Kyoto: Kyoto Daigaku Jimbunkagaku Kenkyusho) [Google Scholar]
- Knigge, C. 2012, Mem. Soc. Astron. It., 83, 549 [NASA ADS] [Google Scholar]
- Luridiana, V., Morisset, C., & Shaw, R. A. 2015, A&A, 573, A42 [NASA ADS] [CrossRef] [EDP Sciences] [Google Scholar]
- Lynch, D. K., & Rossano, G. S. 1990, AJ, 100, 719 [NASA ADS] [CrossRef] [Google Scholar]
- Marks, M., & Kroupa, P. 2010, MNRAS, 406, 2000 [NASA ADS] [Google Scholar]
- Mathewson, D. S., & Clarke, J. N. 1973, ApJ, 180, 725 [NASA ADS] [CrossRef] [Google Scholar]
- Nardiello, D., Libralato, M., Piotto, G., et al. 2018, MNRAS, 481, 3382 [NASA ADS] [CrossRef] [Google Scholar]
- Osterbrock, D. E. 1974, Astrophysics of Gaseous Nebulae [Google Scholar]
- Pankenier, D. W. 2015, in Handbook of Archaeoastronomy and Ethnoastronomy, ed. C. L. Ruggles (New York, NY: Springer), 2069 [Google Scholar]
- Pease, F. G. 1928, PASP, 40, 342 [NASA ADS] [CrossRef] [Google Scholar]
- Pogson, N. 1860, MNRAS, 21, 32 [NASA ADS] [CrossRef] [Google Scholar]
- Robin, A. C., Reylé, C., Derrière, S., & Picaud, S. 2003, A&A, 409, 523 [NASA ADS] [CrossRef] [EDP Sciences] [Google Scholar]
- Sahman, D. I., Dhillon, V. S., Littlefair, S. P., & Hallinan, G. 2018, MNRAS, 477, 4483 [NASA ADS] [CrossRef] [Google Scholar]
- Sawyer, H. B. 1938, J. R. Astron. Soc. Canada, 32, 69 [NASA ADS] [Google Scholar]
- Schaefer, B. E. 2018, MNRAS, 481, 3033 [NASA ADS] [CrossRef] [Google Scholar]
- Shafter, A. W., & Quimby, R. M. 2007, ApJ, 671, L121 [NASA ADS] [CrossRef] [Google Scholar]
- Shara, M. M., Martin, C. D., Seibert, M., et al. 2007, Nature, 446, 159 [NASA ADS] [CrossRef] [Google Scholar]
- Shara, M. M., Mizusawa, T., Zurek, D., et al. 2012, ApJ, 756, 107 [NASA ADS] [CrossRef] [Google Scholar]
- Shara, M. M., Iłkiewicz, K., Mikołajewska, J., et al. 2017, Nature, 548, 558 [NASA ADS] [CrossRef] [Google Scholar]
- Sánchez-Blázquez, P., Peletier, R. F., Jiménez-Vicente, J., et al. 2006, MNRAS, 371, 703 [NASA ADS] [CrossRef] [Google Scholar]
- Stephenson, F. R., & Green, D. A. 2009, J. History of Astron., 40, 31 [NASA ADS] [CrossRef] [Google Scholar]
- Strader, J., Chomiuk, L., Maccarone, T. J., Miller-Jones, J. C. A., & Seth, A. C. 2012, Nature, 490, 71 [NASA ADS] [CrossRef] [Google Scholar]
- van Loon, J. T., Stanimirović, S., Evans, A., & Muller, E. 2006, MNRAS, 365, 1277 [NASA ADS] [CrossRef] [Google Scholar]
- Yaron, O., Prialnik, D., Shara, M. M., & Kovetz, A. 2005, ApJ, 623, 398 [NASA ADS] [CrossRef] [Google Scholar]
Appendix A: Emission lines used during fitting
Emission lines that are used to fit Gaussian functions to the observed spectrum.
Appendix B: Relative nova rates
Throughout the analysis we have assumed that the nebula is located inside NGC 6656 as indictated by its matching LOS velocity and its small separation to the centre of NGC 6656. We further justified this assumption by estimating the relative rate of novae originating from the cluster compared to that of the Milky Way stars in the same region of the sky. The nova rate of a population is the product of its stellar mass and the specific nova rate (i.e. novae rate per solar mass). For the stellar mass, we have to take both foreground and background stars into account because NGC 6656 is located between the solar system and the Galactic centre at a distance of about 3.2 kpc. Using a Besançon model3 (Robin et al. 2003) for the Milky Way, we estimated a foreground stellar mass in a 0.1 ° ×0.1°-field centred on NGC 6656 of 103 M⊙ (3 × 10⁴ M⊙ including background), while the cluster has a mass of 2.9 × 10⁵ M⊙ (Marks & Kroupa 2010). If the specific nova rate is the same for the Milky Way and globular clusters, this indicates that there are 300 GC novae per MW nova (or 10 GC novae per MW novae if the total stellar background behind the GC is included). The ratio could even be higher if the specific nova rate is higher in globular clusters compared to the Galactic field, as is the case in M 31 (Henze et al. 2013). In conclusion, a nova remnant with a small apparent separation to the centre of NGC 6656 is more likely to actually originate from the cluster compared to the Galactic fore- and background due to the higher amount of stellar mass in the cluster.
All Tables
Emission lines that are used to fit Gaussian functions to the observed spectrum.
All Figures
|
Fig. 1. MUSE whitelight detail image of the region in NGC 6656 containing the nebula created from a single observation (left). Contours give the combined [N II]λλ6548, 6583 emission flux after subtracting the stellar background (see Sect. 3.1). White circles represent HST sources from the catalogue of Nardiello et al. (2018), the diameter scales with F606W magnitude. The median flux in the four layers containing the [N II]λ6583 emission line is shown after the median flux in three adjacent layers was subtracted (right). The two apertures used to extract the spectrum of the nebula are shown as white circles. |
| In the text | |
|
Fig. 2. Average spectrum extracted from two circular aperatures covering the new nebula (top panel, black). This is decomposed into stellar background (top panel, orange) and gas (bottom panel, black and blue). The residuals after fitting Gaussian functions to the emission lines are shown in red (bottom panel). Grey boxes indicate regions dominated by telluric features. |
| In the text | |
|
Fig. 3. Chart of the sky close to λ Sgr generated as it appeared to a Chinese observer in the May 48 BCE. The grey arrow points to the approximate location of the ancient observation. The globular cluster NGC 6656 (M 22) is located about 2.5° north-west of this location (about 2.3° north-east of λ Sgr). This chart was generated using XEphem (version 3.7.3, Downey 2011). |
| In the text | |
Current usage metrics show cumulative count of Article Views (full-text article views including HTML views, PDF and ePub downloads, according to the available data) and Abstracts Views on Vision4Press platform.
Data correspond to usage on the plateform after 2015. The current usage metrics is available 48-96 hours after online publication and is updated daily on week days.
Initial download of the metrics may take a while.