| Issue |
A&A
Volume 627, July 2019
|
|
|---|---|---|
| Article Number | A58 | |
| Number of page(s) | 9 | |
| Section | Interstellar and circumstellar matter | |
| DOI | https://doi.org/10.1051/0004-6361/201935179 | |
| Published online | 01 July 2019 | |
Radio observations of evaporating objects in the Cygnus OB2 region
1
Facultad de Ciencias Astronomicas y Geofisicas, UNLP,
Paseo del Bosque s/n,
1900
La Plata,
Argentina
e-mail: nisequilla@fcaglp.unlp.edu.ar
2
Instituto Argentino de Radioastronomia, CONICET & CICPBA,
C.C.5, 1894
Villa Elisa,
Argentina
3
National Center for Radio Astrophysics, TIFR,
PB N3,
Ganeshkhind,
Pune 7,
India
Received:
31
January
2019
Accepted:
15
April
2019
We present observations of the Cygnus OB2 region obtained with the Giant Metrewave Radio Telescope (GMRT) at frequencies of 325 and 610 MHz. In this contribution we focus on the study of proplyd-like objects (also known as free-floating evaporating gas globules or frEGGs) that typically show an extended cometary morphology. We identify eight objects previously studied at other wavelengths and derive their physical properties by obtaining their optical depth at radio-wavelengths. Using their geometry and the photoionization rate needed to produce their radio-continuum emission, we find that these sources are possibly ionized by a contribution of the stars Cyg OB2 #9 and Cyg OB2 #22. Spectral index maps of the eight frEGGs were constructed, showing a flat spectrum in radio frequencies in general. We interpret these as produced by optically thin ionized gas, although it is possible that a combination of thermal emission, not necessarily optically thin, produced by a diffuse gas component and the instrument response (which detects more diffuse emission at low frequencies) can artificially generate negative spectral indices. In particular, for the case of the Tadpole we suggest that the observed emission is not of non-thermal origin despite the presence of regions with negative spectral indices in our maps.
Key words: ISM: individual objects: Cygnus OB2 / radio continuum: stars / stars: formation / stars: protostar
© ESO 2019
1 Introduction
The term protoplanetary disk (sometimes abbreviated to proplyd) was introduced by O’dell et al. (1993) to describe circumstellar disks around young low-mass stars, with the size of our own planetary system, revealed by Hubble Space Telescope images of the Orion Nebula (M42). These proplyds consist of a rotating neutral accreting disk with its surface ionized by an external source, usually a hot massive star. Proplyds are therefore usually found inside HII regions.
Photoevaporation of a circumstellar disk due to nearby young massive stars is an efficient mechanism for molecule and atom destruction, resulting in an important mass loss and producing ultra-compact HII regions (Hollenbach et al. 1994). Photoevaporation is produced either by EUV photons (hν > 13.6 eV) that ionize the gas and rise its temperature, or by UVL photons (6 eV < hν < 13.6 eV) that dissociate molecules and also heat the gas. In 1998, Johnstone et al. presented a model to explain the photoevaporation of circumstellar disks by an external source of ultraviolet radiation and applied it to the Orion proplyds. Their model regards the sound speed in the ionized gas and the escape velocity of the gas from the protostellar gravitational field to find out the shape of the heated ionized material from the disk surface, which finally forms a thermal disk wind with a cometary structure.
Proplyds have been observed in Orion at different wavelengths (O’dell et al. 1993; Henney & Arthur 1998; Graham et al. 2002; Bally et al. 2005; Ricci et al. 2008; Miotello et al. 2012; Mann et al. 2014; Kim et al. 2016; Eisner et al. 2016), as well as in other molecular clouds, such as the Carina Nebula (Smith et al. 2003), NGC 3603 (Brandner et al. 1999; Mücke et al. 2002), the Lagoon Nebula (Stecklum et al. 1998; Masqué et al. 2014), NGC 2024 (Stapelfeldt 2002), Sgr A* (Yusef-Zadeh et al. 2015), and Cygnus OB2 (Wright et al. 2012; Sahai et al. 2012a; Guarcello et al. 2014; Schneider et al. 2016) for example. Their characteristic sizes range from 40 to 1000 AU (Bally et al. 1998; Henney & O’Dell 1999; Sahai et al. 2012a). The masses of the ionized disks are similar to those measured in the nonionized protostellar disks in Taurus and Ophiuchus molecular clouds (typical masses in the range 0.003–0.07 M⊙, Andrews & Williams 2007; Mann & Williams 2010), with the only exception being the disks within 0.3 pc of θ1Ori C that show a slightly lighter mass distribution.
In the Cygnus OB2 region, Sahai et al. (2012a) defined a new kind of object called a frEGG (free-floating Evaporating Gas Globule). Like proplyds, these objects are also externally ionized and present extended cometary morphologies. The main difference is that proplyds harbor protostars in more evolved stages with protoplanetary disks already formed, whereas frEGGs are found to have larger molecular masses, indicating an earlier evolutionary stage in which the protostar is still undergoing strong accretion. The frEGGs are like the evaporating gas globules (EGGs) defined by Hester et al. (1996), but found in isolation, detached from their parental molecular clouds. In addition, frEGGs are about ten times larger than proplyds (frEGGs are typically greater than 20 000 AU), so they can contain not just one but several young protostars with their circumstellar disks (Sahai et al. 2012b). FrEGGs are also more massive than Orion proplyds with total molecular gas masses exceeding 1–2 M⊙ and contain molecular material inside the photoionized region. They are usually at greater distances from their ionizing source than those in Orion. Previous radio observations on frEGGs toward NGC 3603 and G5.97–1.17 (Mücke et al. 2002; Masqué et al. 2014) found that some of these objects present negative spectral indices associated with nonthermal emission. The nonthermal radiation from these ionized sources implies the presence of a population of relativistic electrons. Such particles can either be locally accelerated in the source or come from nearby cosmic-ray sources. In the case of G5.97–1.17, Masqué et al. (2014) suggest that electrons are accelerated at the shock produced by the photoevaporating flow. In this contribution, we present 325 and 610 MHz GMRT continuum observations toward the Cygnus OB2 region and report on the characteristics of the population of externally ionized proplyd-like objects also known as frEGGs. The paper is structured as follows. We review previous studies on these objects located in Cygnus in Sect. 2. In Sect. 3 we describe how the interferometric observations were taken and calibrated and the process for image production. We present the results in Sect. 4. In Sect. 5 we interpret the results and finally we summarize our main findings in Sect. 6.
2 Proplyds and frEGGs in Cygnus
Cygnus is a large northern-sky region of active star formation at an average distance of 2.5 kpc (Reipurth & Schneider 2008), which hosts nine stellar associations and a dozen bright clusters. Nearly at the center of this complex region lies the Cygnus OB2 association, probably one of the most massive associations in the Galaxy. The distance to the OB2 association is 1.4 kpc (Rygl et al. 2012). Cygnus OB2 contains pulsars (Bednarek 2003; Camilo et al. 2009), supernova remnants (Kimura et al. 2013; Boubert et al. 2017), and binary stellar systems (De Becker et al. 2004; Lyne et al. 2015), among other nonthermal radio-emitting sources. Recently, using IR and Hα observations, a sample of ten externally ionized objects was also identified toward this region (Wright et al. 2012, hereafter W12). Most of them are tadpole-shaped with a bright ionization front head roughly pointing to the central cluster of massive stars, and a tail extending in the opposite direction.
A more recent study with Herschel FIR observations at 70 μm in the Cygnus region (Schneider et al. 2016) classified several objects ionized in their peripheries by external UV radiation as pillars, globules, evaporation gas globules, and proplyd-like objects, measuring densities and temperatures for all of them. The EGGs and proplyd-like objects are 0.1–0.2 pc in size, with masses of 10–30 M⊙, densities of 2.2–15.0 × 104cm−3 and average dust temperatures of 17 K. They also show a clear orientation toward the center of the association Cygnus OB2.
Perhaps the most studied of these proplyd-like objects is IRAS 20324+4057, dubbed the Tadpole (Sahai et al. 2012a), toward which there is a battery of observations at different wavelengths (W12; Sahai et al. 2012a; Guarcello et al. 2014; Schneider et al. 2016). IRAS 20324+4057 is located at RA = 20:34:13.27, Dec = 41:08:13.8 [J2000], about 15′ (6 pc at a distance of 1.4 kpc) from the center of the Cygnus OB2 association. It consists of an extended cometary nebula (7.7 × 10⁴ AU) oriented east-west, brighter and well defined in the northern edge and with no apparent axial symmetry, as seen in optical wavelengths (Sahai et al. 2012a). Its morphology and orientation suggest a structure formed by the dynamic pressure of wind passing from a distant source or sources located west of the object, presumably a stellar wind from Cyg OB2 #8. Sahai et al. (2012b) observed the Tadpole using the VLA at 22 and 8.5 GHz. These latter authors derived a negative spectral index suggesting the presence of nonthermal emission. The confirmation of nonthermal radiation associated with frEGGs would suggest that these objects are possible accelerators of cosmic rays, and perhaps even putative gamma-ray sources. Hence, frEGGS could become new laboratories for the investigation of particle acceleration processes in slow (< 103 km s−1) flows, and possibly also as counterparts of unidentified gamma-ray sources. Because of their nonsymmetries, large sizes, and distances between the head and tail, these objects are different from those detected in the Orion Nebula.
3 GMRT observations
The field of IRAS 20324+4057 was observed with the Giant Metrewave Radio Telescope (GMRT)1 in Nov 2013 at the frequency bands of 325 and 610 MHz, for a duration of 6 and 3 h, respectively. The phase center was set at RA = 20:32:50, Dec = 41:16:50 (J2000), near the center of the Cyg OB2 association. The source 3C48 was used as the flux calibrator, and 2038+513 and 2052+365 were monitored as phase calibrators at 325 and 610 MHz, respectively.
The data reduction and imaging were performed with the Astronomical Image Processing System (AIPS, Greisen 2003) following standard procedures; see for example Marcote et al. (2015). In addition, and also as in Marcote et al. (2015), we applied a factor for the system temperatures at each frequency band to correct for the emission of the Galaxy. The factors, 2.2 ± 0.22 for the 325 MHz band and 1.3 ± 0.09 for the 610 MHz band, were derived from data taken in Jan 2018, exclusively for this purpose (see Marcote et al. 2015, Appendix A, for the characteristics of the corrective process).
We obtained a 325 MHz image of the field with a synthesized beam of 7.81″ × 6.60″, an rms of 0.2 mJy beam−1, and an intensity peak of 0.270 Jy beam−1. The corresponding image at 610 MHz was built with a synthesized beam of 7.60″ × 5.97″, resulting in an rms of 0.2 mJy beam−1, and an intensity peak of 0.201 Jy beam−1.
The imaging step produced a phase shift – specifically during the self-calibration stage – between the intensity peak at both frequencies. This was corrected by selecting several random point sources (radio galaxies preferentially) across the whole field of view, determining the coordinates of the intensity peak at both frequencies, computing the average offset between them, and applying this positional shift to the 610 MHz image (RAoffset = 3.19 ± 1.39′′, Decoffset = 0.34 ± 0.99′′). This step was crucial before producing spectral index images, because combining the offset images produced a gradual spectral index gradient with the same orientation as the positional shift in all the sources detected in the field of view.
To generate the maps of spectral indices in MIRIAD, we convolved and regridded the 610 MHz image to exactly the same grid as in the 325 MHz one (thus the pixel size in both maps is the same, 1.5″ × 1.5″).
4 Results
4.1 Observed parameters
The CygnusOB2 image at 325 MHz is shown in Fig. 1. The primary beam of the GMRT observationsincludes the Cygnus OB2 association itself, prominent HII regions spreading several arcminutes, such as DR18 (Comerón & Torra 1999) and 080.45+01.07 (Marti et al. 2007), radio galaxies like the double-sided NVSS J203201+413722 (Butt et al. 2006; Marti et al. 2007) and many others unresolved within the ~ 7′′ angular resolution, and outflows such as IRAS 20286+4105. In addition, this radio image contains most of the photoionized globules or frEGGs previously found by W12. The analysis of these frEGG sources is the focus of the present work. Only objects WDDGGHK 1 and WDDGGHK 5 from the list of W12 lie outside of the GMRT field of view. Objects WDDGGHK 7, WDDGGHK 8, and WDDGGHK 9 were also studied by Sahai et al. (2012a), who referred to them as objects A (or Tadpole), B (or Goldfish), and C. Close to these three sources there is another radio source with negative spectral index that we named GMRT 1 and we could not classify nor discard as another frEGG. Following W12, the O-type stars in the region are distributed over a large area and therefore, although the center of the association is probably between Cyg OB2 #8 and Cyg OB2 #22 (indicated by white stars in Fig. 1), other luminous stars are probably responsible for the ionization of the frEGGs. Figure 2 presents four zoom maps corresponding to these locations, where the color scale indicates the flux at 325 MHz and the white contours indicate the Herschel (Pilbratt et al. 2010) infrared emission, very similar to the radio emission distribution, which shows the cometary morphology of the frEGGs.
Table 1 summarizes the positions, fluxes at 325 and 610 MHz, spectral indices between both frequencies, and the sizes of each frEGG in the GMRT field of view. We note that sources WDDGGHK 2, WDDGGHK 3, and WDDGGHK 4 lie outside of the primary beam at 610 GHz and the corresponding fluxes are thus missing. We use a 3σ threshold tomeasure the integrated fluxes and estimate linear sizes, which range from about 10′′ to 60′′ (15 000 to 90 000 AU at the assumed distance of 1.4 kpc), similar to those obtained from optical images (W12). The average spectral indices (α = log(S2∕S1)∕log(ν2∕ν1)) are mostly around zero.
We build spectral index distribution images (Fig. 3) implementing in MIRIAD its mathematical expression. The smaller beam image was convolved with a beam corresponding to the one with the larger beam, forcing them to have the same synthesized beam. Some of these maps show differences on the spectral index across the sources, butwe comment more on these in Sect. 4.2. We determine the average optical depth (τ) of the frEGGs using the following equation, considering spherical symmetry and homogeneity and the Rayleigh-Jeans approach (Altenhoff et al. 1960),
 (1)
(1)
where Te is the electron temperature, ν the observing frequency, and E.M. the emission measure. In general, the emission is optically thin.
Besides τ values, Table 2 presents the physical properties that we obtain by analyzing the morphology of the sources (length and orientation) derived from Mezger & Henderson (1967) and Ainsworth et al. (2016) expressions for HII regions and evaluated at the frequency of 325 MHz. In doing this, as a first-order approximation we consider a model of free-free emission in an optically thin homogeneous sphere. We adopted the values Te = 104 K and d = 1.4 kpc (Rygl et al. 2012) to estimate the electron density, mass of ionized gas, emission measure, and rate of Lymann photons needed to ionize each source, the latter with (Ni∕s−1) = 7.6 × 1043(Sν∕mJy)  (Garay et al. 1987). The densities are typical of photoionized regions (102 cm−3) with ionized gas masses of 0.002 M⊙–0.2 M⊙. The photon rates range between 1043 and 1045 s−1, which can be produced by early B-type stars. We provide further insight into the physical properties in Sect. 4.2, where we review the main characteristics of each frEGG in our sample.
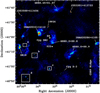 |
Fig. 1 Cygnus OB2 image at 325 MHz; the synthesized beam is 7.81′′ × 6.60′′, PA = 88.6°, the rms is 0.2 mJy beam−1, and the intensity peak is 0.270 Jy beam−1. The boxes in the figures show the regions where the proplyd sources studied here lie: source WDDGGHK 10 in box a, WDDGGHK 7, 8, and 9 in box b, WDDGGHK 6 in box c, WDDGGHK 2, 3, and 4 in box d. The white stars mark the position of putative ionizing agents. |
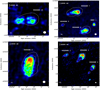 |
Fig. 2 Zoom in to the four white boxes marked in Fig. 1, 325 MHz emission in color scale, and IR contours of 470 and 1070 mJy beam−1. |
Observed parameters for the frEGGs on Cygnus OB2.
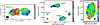 |
Fig. 3 Spectral index distribution. Left: source WDDGGHK 10 with 325 MHz contours of 0.5, 0.7, and 0.9 mJy beam−1. Center: sources WDDGGHK 7, 8, and 9, and GMRT 1, with 325 MHz contours of 0.5, 1, and 2 mJy beam−1. Right: source WDDGGHK 6 with 325 MHz contours of 0.5, 1, and 2 mJy beam−1. Since the error of the spectral index is largest at the edges of the sources because the emission is weaker, extreme values of the spectral index can be generated in those areas. |
Physical properties for the frEGGs of Cygnus OB2.
4.2 Individual sources
The observed frEGGs are distributed south of the OB2 association and are grouped in four distinct regions (boxes a, b, c and d in Fig. 1). There are two isolated objects (WDDGGHK 6 and WDDGGHK 10) and two groups of three objects each (boxes b and d, respectively in Figs. 1 and 2). All the sources show an elongated morphology and spectral indices around zero. The morphology in radio wavelengths perfectly matches the emission detected by Herschel at 70 μm. The electron density and the orientation of the sources is similar within the members of the two mentioned groups. We summarize the main findings of each object below.
WDDGGHK 2
This elongated (37 000 AU) source, also known as IPHASX J2034533+405321, is located at the southeast edge of the 325 MHz primary beam (box d in Figs. 1 and 2), lying outside of the 610 MHz primary beam. It is grouped with objects WDDGGHK 3 and WDDGGHK 4, with which it shares a northwest-southeast orientation and a similar electron density around 90–100 cm−3. As with these two other objects, the tail of WDDGGHK 2 seems to comprise two lateral threads. It has also been detected in infrared, submillimeter, and optical wavelengths (Wright et al. 2012; Schneider et al. 2016).
WDDGGHK 3
It is located about 0.5 pc west of WDDGGHK 2 and 0.5 pc east of WDDGGHK 4, and is one of the strongest sources of our sample at 325 MHz. This object presents a clear cometary shape with a prominent head, showing a bowshock structure (also detected in optical wavelengths; see Comerón et al. 2002) and a faint tail due southeast. Its 80 000 AU length makes it the largest frEGG in our sample. Additionally, it has the largest content of ionized gas (0.236 M⊙), needing an ionizing photon rate of 1045.8 s−1. WDDGGHK 3 contains a protostar probably associated with IRAS 20328+4042, a 100 L⊙ young stellar object embedded in a massive gaseous envelope or disk (Comerón et al. 2002; Roy et al. 2011).
WDDGGHK 4
This elongated source is spatially resolved at 325 MHz (50 000 AU in length). It splits into two clear parts: a head with a bowshock shape pointing northwest (PA = 141°) and a frayedtail comprised of faint shreds, one of them disconnected from the rest (Fig. 2). Previous far-infrared (FIR) observations between 500and 60 μm toward the head of this object identified a dusty core, BLAST C62, possibly harboring a stellar nursery (Roy et al. 2011). About 1.8′ south of the head of WDDGGHK 4 there is an unresolved source with a flux density of 2.7 mJy (at 325 MHz) that we do not include in our analysis of frEGGs, although it could be related with this group of photoionized sources because of its proximity and its similar orientation, maybe a tail emanating behind the bow shock.
WDDGGHK 6
Box c inFig. 1 contains this isolated source (see also, Figs. 2 and 3) with a north-south orientation (PA = 177°). As for manyof these objects, it has a very strong arc-shaped head followed by a frayed tail with two or three shreds, also observed in Hα and 8 μm images (W12). It is also one of the densest sources (230 cm−3)2. It needs an ionization photon rate of 1045.9 s−1. Roy et al. (2011) associated this photoionized region with IRAS 20315+4046, whose emission may be originated by a 400 L⊙ protostar(s).
WDDGGHK 7
This source was dubbed the Tadpole because of its morphological resemblance to the larval stage an amphibian and has been the focus of several works (Wright et al. 2012; Sahai et al. 2012a; Guarcello et al. 2014; Schneider et al. 2016). It is ~ 12′ southwest of DR18 (box b in Fig. 1) and consists of the characteristic bowshock head followed by a fainter tail (Figs. 2 and 3). The object is oriented almost east-west (PA = 108°), similarly to its frEGGs neighbors WDDGGHK 8 and possibly WDDGGHK 9. From the radio emission detected with the GMRT we derive an average spectral index of − 0.2 ± 0.2. However, the spatial distribution of the spectral index is not homogeneous, varying from positive at the head to negative at the tail. In Sect. 4.3 we analyze its spectral energy distribution (SED) in detail.
WDDGGHK 8
This source, also called the Goldfish, is about 1′ south of the Tadpole. It is as dense as the Tadpole (233 cm−3) but with a slightly smaller ionized mass. We find an average spectral index of − 0.16 ± 0.19 which in this case is homogeneously distributed throughout the source (i.e., no apparent variations). Within the errors it is consistent with emission from an optically thin plasma.
WDDGGHK 9
Another neighbor of the Tadpole but barely detected by GMRT observations. The weakness of the emission makes estimates of its physical properties very uncertain. We estimate its length to be ~ 15 000 AU and its orientation to be PA = 127°, similar to those of the Tadpole and the Goldfish.
Flux density values of WDDGGHK7 (the Tadpole).
WDDGGHK 10
This is an isolated source located inside the box a in Fig. 1. It is 3.′5 west of the prominent 4′ long bowshock of the DR18 ionized region. Figure 2 shows that WDDGGHK 10 comprises two main radio components, oriented east-west, interestingly the same orientation aimed by the DR18 bow shock. Near-infrared (NIR) and optical images (W12) show WDDGGHK 10 has a head-tail bowshock morphology, in good agreement with the GMRT image, which displays stronger emission toward the head of the shock (west) and somewhat fainter emission toward the tail (east). At radio wavelengths, the contrast between head and tail is not as large as in the other frEGGs studied here. One reason for this feature could be that the shreds of the tail of this object are apparently twisted and cross each other at the position of the eastern radio peak (noticeable in the optical and NIR images; Wright et al. 2012). This would explain the emission enhancement from the tail. On average, this source has the steepest spectral index in our sample (α = 0.3). It is worth noting that the two isolated frEGGs have average positive spectral indices, while the other sources have flat or slightly negative spectral indices. The spatial distribution of the spectral index toward WDDGGHK 10 (Fig. 3) is also interesting since it varies from the head at α approximately − 0.1, growing in the center to α ~0.5, and decreasing toward the easternmost part of the tail to α ~ 0.3. These variations in the spectral index could be due to differences in the optical depth along the source.
Regarding the protostellar content of WDDGGHK 10, the only IR source inside the photoionized region found by Wright et al. (2012) is IRAS 20329+4104, which is about 10′′ (14 000 AU) away from the peak emission in radio from this frEGG.
4.3 Tadpole spectral energy distribution
In this section we analyze the SED of the object WDDGGHK7, the Tadpole, built up with data from previous radio and IR observations (Table 3). We selected the Tadpole as an example of a frEGG with a flat/negative spectral index (regarding to our data), and one with a suspicious negative spectral index at higher frequencies (Sahai et al. 2012a).
At radiowavelengths we use a power law obtaining an average slope of 0.26 (see Fig. 4) which is consistent with thermal emission from a partially optically thin plasma. The thermal emission is expected to be stationary unless the thermodynamical quantities of the gas (e.g., ne) suffer a quick evolution over a timescale of one year, which is highly unlikely. Therefore, the mismatch between our observations and the values reported by Setia Gunawan et al. (2003) are likely to be explained by differences in beamsize or calibration errors.
Although partial power-law fits in specific ranges of the radio spectrum show negative spectral indices, the overall index from frequencies below 1 to 22.5 GHz is consistent with thermal emission. If the data at 8 and 22 GHz by Sahai et al. (2012a) is interpreted as nonthermal emission, one would expect the flux detected at lower frequencies of 0.325–1.4 GHz to be much higher. The only way to reconcile this would be to summon the action of absorption processes which reduce the observed low-frequency emission (Melrose 1980). However, this would lead to a positive spectral index at low frequencies which is in contradiction to the flat spectrum that we observe. Therefore, we favor an explanation involving calibration uncertainties and/or the presence of diffuse emission which is lost (not detected) athigh frequencies (as the LAS is smaller at higher frequencies), which could artificially generate the observed slightly negative spectral index. More observations at intermediate frequencies will help to settle this issue.
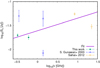 |
Fig. 4 SED of the Tadpole (WDDGGHK7). We have fitted a power-law to the available radio interferometer data (dashed green line); the purple line shows the sum of both components. |
5 Discussion
In this section, we present a short discussion about the sources causing the ionization of the proplyd-like objects found in Cygnus OB2. We also discuss the possible origin of the flat radio-spectral indices of some of them, focusing particularly on the Tadpole, which has been observed at several wavelengths and whose radio emission has been interpreted as nonthermal in the past (Sahai et al. 2012a).
5.1 Sources causing the ionization
In Table 4 we report the photon rate necessary to ionize the Cygnus OB2 frEGGs. It ranges between 5 × 1043 and almost 1046 s−1, corresponding to main sequence stars with spectral types B3-B1 (Panagia 1973). According to Wright et al. (2012), the ionizing stars responsible for photoionizing all the Cygnus OB2 frEGGs could be OB2 #8 (RA = 20:33:15.07, Dec = 41:18:50.47) or OB2 #22 (RA = 20:33:08.79, Dec = 41:13:18.21), although they do not provide quantitative evidence. These systems (see e.g., Wright et al. 2015) are binaries comprised of an O6 I star plus an O4.5 III star (OB2 #8A) along with an O6.5 III (OB2 #8B), and another binary with an O3 If star plus an O6 V star (OB2 #22). The aggregated ionization rates of these systems are 7.52 × 1049 and 7.00 × 1049 photons per second, respectively. We use the Lyman photon rates tabulated by Martins et al. (2005), which take into account line-blanketing and wind effects. In addition to these stellar systems we have tested another two massive systems favorably located in the area, meaning that they could also be responsible for ionizing all the frEGGs (Wright et al. 2015): OB2 #9 (comprised of an O5 I plus an O3.5 III), and MT 516 (an O5.5 V star, with the number 516 in the system by Massey & Thompson 1991). These spectral types lead to total ionizing photon fluxes of 9.30 × 1049 and 1.26 × 1049 per second, respectively. From all four massive stellar systems, the only one with accurate Gaia DR2 parallax reported is OB2 #9 (π = 0.60), at a distance of 1663 pc. Now, to test if these stars are ionizing the Cygnus OB2 frEGGs we use as a first criterion the prescription in Garay et al. (1987). In particular, their Eq. (4):
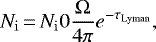
which provides the ionizing photon rate Ni incident on a source that subtends a solid angle Ω as seen from a star with a Ni0 ionizing photon rate. Here  , where d is the distance from the ionized object to the ionizing source and r the projected radius of the object as seen from the ionizing stars. For the calculations we use the projected distance as d (therefore the obtained Ni would be upper limits), and assume that the Lyman continuum optical depth τLyman is negligible. We compare these rates with the ionization photon flux needed to ionize the frEGGs derived from their associated radio continuum emission (Table 4). A second criterion to decipher whether or not a star is effectively ionizing the OB2 frEGGs is the relative agreement between the orientation of the projected line linking the star with the head of a frEGG and the position angle of that frEGG (Table 5). The positional alignment is quite good for stars #22, #9, and MT 516, with deviations that are generally less than 1.5 times the PA uncertainty (although #9 and WDDGGHK 7-8 are not that well aligned). On the contrary, #8 shows large deviations for some frEGGs, whether in the group of WDDGGHK 2, WDDGGHK 7, or with WDDGGHK 10. Thus, system OB2 #8 seems not to be adequately located to be a good candidate. Regarding the Lyman photon fluxes, none of the stellar systems provide a high-enough rate to ionize the southern WDDGGHK 2-4 frEGGs; especially WDDGGHK 3, which needs 7.2 × 1045 photons s−1. The single star MT 516, although closer to all the frEGGs, is of a later type and cannot ionize the sources on its own. Only systems #9 and #22 are close to the required values; they provide more-than-adequate fluxes for frEGGs WDDGGHK 7-10, slightly lower for WDDGGHK 6 and half of the needed rate for WDDGGHK 3. The reason for a more-than-adequate rate may simply be a projection effect, while less-than-adequate rates may indicate that a combination of fluxes from different stellar systems are responsible for the final ionization. When adding the contribution from both stellar systems (#9 and #22), the resulting photon flux is higher than needed, which may be lowered if unprojected distances are used in the calculations. Therefore, the most favorable ionizing sources for the Cygnus OB2 frEGGs are OB2 #9 and OB2 #22, and a small amount of photons would also be provided by the other stellar systems. We notice that all the stellar candidates could provide Lyman photon fluxes hundreds of times the rate needed to ionize WDDGGHK 9.
5.2 Spectral indices
In Table 1 we report the measured spectral indices extracted from the fluxes obtained at the two observing frequencies, 325 and 610 MHz. The determination of the spectral indices produces small values with relatively large uncertainties. All spectral indices are below the canonical 0.6 index typical of HII regions (e.g., Churchwell & Walmsley 1975). Moreover, two of the frEGGs (WDDGGHK 7 and WDDGGHK 8) show negative spectral indices of − 0.2 ± 0.2, consistent with flat indices if the uncertainties are taken into account. As already pointed out in previous sections, a negative spectral index may indicate the presence of nonthermal emission. However, in this case, the reason behind the low spectral indices measured inthe Cygnus OB2 frEGGs may be the existence of significant amounts of diffuse gas (extended and tenuous emission), preferentially detected at lower frequencies by the GMRT (see also Ramachandran et al. 2017). Supporting this argument, we check for any well-known HII region lying within the field of view of our Cygnus OB2 GMRT observations. We found DR 18, for example. Using our observations, we obtain a radio-spectral index of 0.3 ± 0.01 for this extended object, which is also lower than the expected value of 0.6. For DR 18, it is also evident that for extended objects, the GMRT is more sensitive to the extended weak emission at 325 MHz than to that at 610 MHz. This effect can be quantitatively accounted for by reporting the number of pixels with significant emission at each frequency. Again, the continuum emission of DR 18 at 325 MHz spreads over 4% more pixels than at 610 MHz. Similar results are obtained for most of the frEGGs: for WDDGGHK 8 the diffuse emission extends over 10% more pixels at 325 MHz, while for WDDGGHK 10, this percentage rises to 30%. This effect is more pronounced in the tail of WDDGGHK 7 and WDDGGHK 8, which is the region with the most diffuse emission and negative values of the spectral index (Fig. 3). As a consequence the radio-spectral indices are smaller than they are in reality and therefore we are no longer interpreting them as originating from nonthermal emission. For future usage of our results, we suggest that diffuse emission must be accounted for when estimating the spectral index in these sources. Subsequently, the values of τ, ne, Mion and E.M. from Table 2 were determined at the frequency of 325 MHz since they are not affected by the loss of emission at the frequency of 610 MHz.
A special case among the studied frEGGs is that of WDDGGHK 7, the Tadpole, since Sahai et al. (2012a) have reported the detection of a negative spectral index between 8.5 and 22.0 GHz. Our low-frequency spectral index is consistent with a slightly negative or flat value, which cannot be reconciled with the data of Sahai et al. (2012a) (Fig. 4). As already mentioned, we only detect negative spectral index values between − 1.0 and − 0.5 along the tail of this object (Fig. 3). Therefore, any nonthermal emission should belong to this part of the object. However, 15% of the pixels of Tadpole at 325 MHz are not seen at 610 MHz and most of them are lost in the tail. This suggests that the tail of the Tadpole is probably affected by diffuse emission, which artificially produces the negative index. When studying the GMRT measured fluxes together with those of Sahai et al. (2012a) for the Tadpole (Fig. 4) a power-law fit produces a slope of 0.3 ± 0.1. This is probably a more reliable value for the radio-spectral index of this source. It shows that thermal emission of the Tadpole dominates its radio emission (a black-body is a good fit for its IR emission in addition), although more data at intermediate and larger frequencies would improve this fit to finally constrain the nature of the radio emission.
Differences between needed ionizing photon rates and those expected from nearby massive Cygnus OB2 stars.
Differences between the PA of frEGGs and its orientation with respect to nearby massive Cygnus OB2 stars.
6 Summary and conclusions
We studied the externally ionized objects of the Cygnus OB2 region previously identified in Wright et al. (2012) through GMRT 325 and 610 MHz observations. After describing them observationally we determined their physical properties, such as their electronic densities, ionized mass, optical depth, and the amount of photons needed to be ionized. We compared the ionizing photon rate with that produced by different massive stars in the neighborhood searching for good ionizing candidates. We also compared the orientation of the frEGGs with the position angle between the ionizing stars and the frEGGs. Weconclude that the stellar systems Cyg OB2 #9 and Cyg OB2 #22 are probably responsible for their ionization.
We also obtained radio spectral indices between 325 and 610 MHz for five frEGGs of our sample. Some sources show an average flat spectral index consistent with thermal free-free emission. However, some of the spectral index maps show regions of negative values, which we interpret as a possible effect of the presence of diffuse gas, since the interferometer would be more sensitive to the extended diffuse gas at low frequencies, resulting in spectral index values close to or below zero. Nevertheless, our observations are not conclusive concerning the existence of regions with nonthermal emission in the frEGGs, although they suggest that the main contribution to the continuum radio emission is thermal.
Regarding the object WDDGGHK 7 (the Tadpole), thought to be nonthermal at radio wavelengths, we collected data from the literature to build its SED. We fit a power-law function to the radio-continuum measurements obtaining a 0.3 spectral index consistent with thermal emission. Therefore, according to our data, most of the radio emission from frEGGs is nonthermal.
Acknowledgements
N.L.I. thanks the National University of La Plata, Argentina – Faculty of Astronomical and Geophysical Sciences of which she is a Ph.D. student. We thank the staff of the GMRT that made these observations possible. GMRT is run by the National Centre for Radio Astrophysics of the Tata Institute of Fundamental Research. This research has made use of the SIMBAD database, operated at CDS, Strasbourg, France.
References
- Ainsworth, R. E., Scaife, A. M. M., Green, D. A., Coughlan, C. P., & Ray, T. P. 2016, MNRAS, 459, 1248 [NASA ADS] [CrossRef] [Google Scholar]
- Altenhoff, W. J., Mezger, P. G., Wendker, H., & Westerhout, G. 1960, Technical Report Veroeff, Univ. Sternwarte Bonn, 59, 48 [Google Scholar]
- Andrews, S. M., & Williams, J. P. 2007, ApJ, 659, 705 [NASA ADS] [CrossRef] [Google Scholar]
- Bally, J., Testi, L., Sargent, A., & Carlstrom, J. 1998, AJ, 116, 854 [NASA ADS] [CrossRef] [Google Scholar]
- Bally, J., Licht, D., Smith, N., & Walawender, J. 2005, AJ, 129, 355 [NASA ADS] [CrossRef] [Google Scholar]
- Bednarek, W. 2003, MNRAS, 345, 847 [NASA ADS] [CrossRef] [Google Scholar]
- Boubert, D., Fraser, M., Evans, N. W., Green, D. A., & Izzard, R. G. 2017, A&A, 606, A14 [NASA ADS] [CrossRef] [EDP Sciences] [Google Scholar]
- Brandner, W., Grebel, E. K., Chu, Y.-H., et al. 1999, AAS Meeting Abstracts 194, 932 [Google Scholar]
- Butt, Y. M., Drake, J., Benaglia, P., et al. 2006, ApJ, 643, 238 [NASA ADS] [CrossRef] [Google Scholar]
- Camilo, F., Ray, P. S., Ransom, S. M., et al. 2009, ApJ, 705, 1 [NASA ADS] [CrossRef] [Google Scholar]
- Churchwell, E., & Walmsley, C. M. 1975, A&A, 38, 451 [NASA ADS] [Google Scholar]
- Comerón, F., & Torra, J. 1999, A&A, 349, 605 [Google Scholar]
- Comerón, F., Pasquali, A., Rodighiero, G., et al. 2002, A&A, 389, 874 [NASA ADS] [CrossRef] [EDP Sciences] [Google Scholar]
- De Becker, M., Rauw, G., & Manfroid, J. 2004, A&A, 424, L39 [NASA ADS] [CrossRef] [EDP Sciences] [Google Scholar]
- Eisner, J. A., Bally, J. M., Ginsburg, A., & Sheehan, P. D. 2016, ApJ, 826, 16 [NASA ADS] [CrossRef] [Google Scholar]
- Garay, G., Moran, J. M., & Reid, M. J. 1987, ApJ, 314, 535 [NASA ADS] [CrossRef] [Google Scholar]
- Graham, M. F., Meaburn, J., Garrington, S. T., et al. 2002, ApJ, 570, 222 [NASA ADS] [CrossRef] [Google Scholar]
- Greisen, E. W. 2003, Information Handling in Astronomy – Historical Vistas, Astrophys. Space Sci. Lib., ed. A. Heck (New York: Kluwer Academic Publishers), 285, 109 [NASA ADS] [Google Scholar]
- Guarcello, M. G., Drake, J. J., Wright, N. J., García-Alvarez, D., & Kraemer, K. E. 2014, ApJ, 793, 56 [NASA ADS] [CrossRef] [Google Scholar]
- Henney, W. J., & Arthur, S. J. 1998, AJ, 116, 322 [NASA ADS] [CrossRef] [Google Scholar]
- Henney, W. J., & O’Dell, C. R. 1999, AJ, 118, 2350 [NASA ADS] [CrossRef] [Google Scholar]
- Hester, J. J., Scowen, P. A., Sankrit, R., et al. 1996, AJ, 111, 2349 [NASA ADS] [CrossRef] [Google Scholar]
- Hollenbach, D., Johnstone, D., Lizano, S., & Shu, F. 1994, ApJ, 428, 654 [NASA ADS] [CrossRef] [Google Scholar]
- Kim, J. S., Clarke, C. J., Fang, M., & Facchini, S. 2016, ApJ, 826, L15 [NASA ADS] [CrossRef] [Google Scholar]
- Kimura, M., Tsunemi, H., Tomida, H., et al. 2013, PASJ, 65, 14 [NASA ADS] [CrossRef] [Google Scholar]
- Lyne, A. G., Stappers, B. W., Keith, M. J., et al. 2015, MNRAS, 451, 581 [NASA ADS] [CrossRef] [Google Scholar]
- Mann, R. K., & Williams, J. P. 2010, ApJ, 725, 430 [NASA ADS] [CrossRef] [Google Scholar]
- Mann, R. K., Di Francesco, J., Johnstone, D., et al. 2014, ApJ, 784, 82 [NASA ADS] [CrossRef] [Google Scholar]
- Marcote, B., Ribó, M., Paredes, J. M., & Ishwara-Chandra, C. H. 2015, MNRAS, 451, 59 [NASA ADS] [CrossRef] [Google Scholar]
- Marti, J., Paredes, J. M., Ishwara, C. H. C., & Bosch-Ramon, V. 2007, VizieR Online Data Catalog: 347 [Google Scholar]
- Martins, F., Schaerer, D., & Hillier, D. J. 2005, A&A, 436, 1049 [NASA ADS] [CrossRef] [EDP Sciences] [Google Scholar]
- Masqué, J. M., Dzib, S., & Rodríguez, L. F. 2014, ApJ, 797, 60 [NASA ADS] [CrossRef] [Google Scholar]
- Massey, P., & Thompson, A. B. 1991, AJ, 101, 1408 [NASA ADS] [CrossRef] [Google Scholar]
- Melrose, D. B. 1980, Plasma astrohysics. Nonthermal Processes in Diffuse Magnetized Plasmas - Vol.1: The Emission, Absorption and Transfer of Waves in Plasmas; Vol.2: Astrophysical Applications (New York: Gordon and Breach Science Publishers) [Google Scholar]
- Mezger, P. G., & Henderson, A. P. 1967, ApJ, 147, 471 [NASA ADS] [CrossRef] [Google Scholar]
- Miotello, A., Robberto, M., Potenza, M. A. C., & Ricci, L. 2012, ApJ, 757, 78 [NASA ADS] [CrossRef] [Google Scholar]
- Mücke, A., Koribalski, B. S., Moffat, A. F. J., Corcoran, M. F., & Stevens, I. R. 2002, ApJ, 571, 366 [NASA ADS] [CrossRef] [Google Scholar]
- O’dell, C. R., Wen, Z., & Hu, X. 1993, ApJ, 410, 696 [CrossRef] [Google Scholar]
- Panagia, N. 1973, AJ, 78, 929 [NASA ADS] [CrossRef] [Google Scholar]
- Pilbratt, G. L., Riedinger, J. R., Passvogel, T., et al. 2010, A&A, 518, L1 [CrossRef] [EDP Sciences] [Google Scholar]
- Ramachandran, V., Das, S. R., Tej, A., et al. 2017, MNRAS, 465, 4753 [NASA ADS] [CrossRef] [Google Scholar]
- Reipurth, B., & Schneider, N. 2008, Handbook of Star Forming Regions, ed. B. Reipurth (San Francisco: ASP), 36 [Google Scholar]
- Ricci, L., Robberto, M., & Soderblom, D. R. 2008, AJ, 136, 2136 [NASA ADS] [CrossRef] [Google Scholar]
- Roy, A., Ade, P. A. R., Bock, J. J., et al. 2011, ApJ, 727, 114 [NASA ADS] [CrossRef] [Google Scholar]
- Rygl, K. L. J., Brunthaler, A., Sanna, A., et al. 2012, A&A, 539, A79 [NASA ADS] [CrossRef] [EDP Sciences] [Google Scholar]
- Sahai, R., Güsten, R., & Morris, M. R. 2012a, ApJ, 761, L21 [NASA ADS] [CrossRef] [Google Scholar]
- Sahai, R., Morris, M. R., & Claussen, M. J. 2012b, ApJ, 751, 69 [NASA ADS] [CrossRef] [Google Scholar]
- Schneider, N., Bontemps, S., Motte, F., et al. 2016, A&A, 591, A40 [NASA ADS] [CrossRef] [EDP Sciences] [Google Scholar]
- Setia Gunawan, D. Y. A., de Bruyn, A. G., van der Hucht, K. A., & Williams, P. M. 2003, ApJS, 149, 123 [NASA ADS] [CrossRef] [Google Scholar]
- Smith, N., Bally, J., & Morse, J. A. 2003, ApJ, 587, L105 [NASA ADS] [CrossRef] [Google Scholar]
- Stapelfeldt, K. 2002, Externally Illuminated Circumstellar Material in the Young Nebulous Cluster NGC 2024, HST Proposal [Google Scholar]
- Stecklum, B., Henning, T., Feldt, M., et al. 1998, AJ, 115, 767 [NASA ADS] [CrossRef] [Google Scholar]
- Wright, N. J., Drake, J. J., Drew, J. E., et al. 2012, ApJ, 746, L21 [NASA ADS] [CrossRef] [Google Scholar]
- Wright, N. J., Drew, J. E., & Mohr-Smith, M. 2015, VizieR Online Data Catalog: 744 [Google Scholar]
- Yusef-Zadeh, F., Roberts, D. A., Wardle, M., et al. 2015, ApJ, 801, L26 [NASA ADS] [CrossRef] [Google Scholar]
All Tables
Differences between needed ionizing photon rates and those expected from nearby massive Cygnus OB2 stars.
Differences between the PA of frEGGs and its orientation with respect to nearby massive Cygnus OB2 stars.
All Figures
|
Fig. 1 Cygnus OB2 image at 325 MHz; the synthesized beam is 7.81′′ × 6.60′′, PA = 88.6°, the rms is 0.2 mJy beam−1, and the intensity peak is 0.270 Jy beam−1. The boxes in the figures show the regions where the proplyd sources studied here lie: source WDDGGHK 10 in box a, WDDGGHK 7, 8, and 9 in box b, WDDGGHK 6 in box c, WDDGGHK 2, 3, and 4 in box d. The white stars mark the position of putative ionizing agents. |
| In the text | |
|
Fig. 2 Zoom in to the four white boxes marked in Fig. 1, 325 MHz emission in color scale, and IR contours of 470 and 1070 mJy beam−1. |
| In the text | |
|
Fig. 3 Spectral index distribution. Left: source WDDGGHK 10 with 325 MHz contours of 0.5, 0.7, and 0.9 mJy beam−1. Center: sources WDDGGHK 7, 8, and 9, and GMRT 1, with 325 MHz contours of 0.5, 1, and 2 mJy beam−1. Right: source WDDGGHK 6 with 325 MHz contours of 0.5, 1, and 2 mJy beam−1. Since the error of the spectral index is largest at the edges of the sources because the emission is weaker, extreme values of the spectral index can be generated in those areas. |
| In the text | |
|
Fig. 4 SED of the Tadpole (WDDGGHK7). We have fitted a power-law to the available radio interferometer data (dashed green line); the purple line shows the sum of both components. |
| In the text | |
Current usage metrics show cumulative count of Article Views (full-text article views including HTML views, PDF and ePub downloads, according to the available data) and Abstracts Views on Vision4Press platform.
Data correspond to usage on the plateform after 2015. The current usage metrics is available 48-96 hours after online publication and is updated daily on week days.
Initial download of the metrics may take a while.