Fig. 3
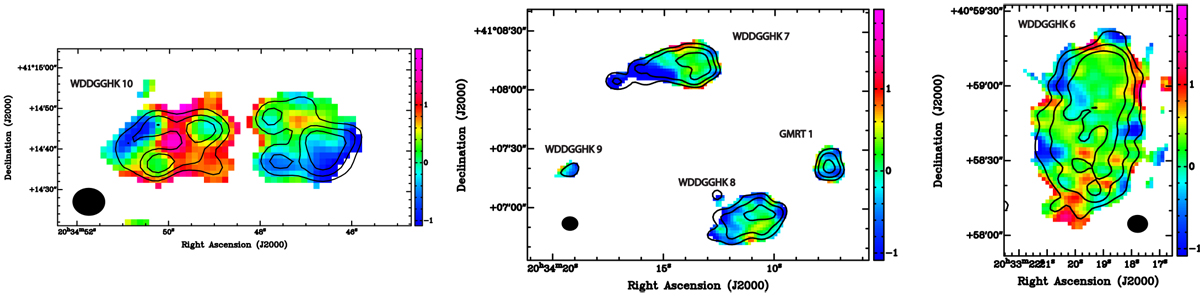
Spectral index distribution. Left: source WDDGGHK 10 with 325 MHz contours of 0.5, 0.7, and 0.9 mJy beam−1. Center: sources WDDGGHK 7, 8, and 9, and GMRT 1, with 325 MHz contours of 0.5, 1, and 2 mJy beam−1. Right: source WDDGGHK 6 with 325 MHz contours of 0.5, 1, and 2 mJy beam−1. Since the error of the spectral index is largest at the edges of the sources because the emission is weaker, extreme values of the spectral index can be generated in those areas.
Current usage metrics show cumulative count of Article Views (full-text article views including HTML views, PDF and ePub downloads, according to the available data) and Abstracts Views on Vision4Press platform.
Data correspond to usage on the plateform after 2015. The current usage metrics is available 48-96 hours after online publication and is updated daily on week days.
Initial download of the metrics may take a while.