| Issue |
A&A
Volume 603, July 2017
|
|
|---|---|---|
| Article Number | A97 | |
| Number of page(s) | 11 | |
| Section | Extragalactic astronomy | |
| DOI | https://doi.org/10.1051/0004-6361/201630245 | |
| Published online | 11 July 2017 | |
A search for extended radio emission from selected compact galaxy groups
1 Astronomical Observatory, Jagiellonian University, ul. Orla 171, 30-244 Kraków, Poland
e-mail: iwan@oa.uj.edu.pl
2 Max-Planck-Institut für Radioastronomie, Auf dem Hügel 69, 53121 Bonn, Germany
3 Astronomisches Institut, Ruhr-Universität-Bochum, 44780 Bochum, Germany
Received: 13 December 2016
Accepted: 21 April 2017
Context. Studies on compact galaxy groups have led to the conclusion that a plenitude of phenomena take place in between galaxies that form them. However, radio data on these objects are extremely scarce and not much is known concerning the existence and role of the magnetic field in intergalactic space.
Aims. We aim to study a small sample of galaxy groups that look promising as possible sources of intergalactic magnetic fields; for example data from radio surveys suggest that most of the radio emission is due to extended, diffuse structures in and out of the galaxies.
Methods. We used the Effelsberg 100 m radio telescope at 4.85 GHz and NRAO VLA Sky Survey (NVSS) data at 1.40 GHz. After subtraction of compact sources we analysed the maps searching for diffuse, intergalactic radio emission. Spectral index and magnetic field properties were derived.
Results. Intergalactic magnetic fields exist in groups HCG 15 and HCG 60, whereas there are no signs of them in HCG 68. There are also hints of an intergalactic bridge in HCG 44 at 4.85 GHz.
Conclusions. Intergalactic magnetic fields exist in galaxy groups and their energy density may be comparable to the thermal (X-ray) density, suggesting an important role of the magnetic field in the intra-group medium, wherever it is detected.
Key words: radio continuum: galaxies / galaxies: magnetic fields / galaxies: groups: general / polarization / intergalactic medium
© ESO, 2017
1. Introduction
Hickson compact groups (HCG) constitute a scientifically interesting selection of dense galaxy systems containing a small number of galaxies. Originally described by Hickson (1982), these objects are well known for the plenitude of interaction-driven phenomena, such as morphological and kinematical peculiarities of the member galaxies, bursts of star formation in their disks, nuclear radio and infrared emission due to starbursts, or active galactic nuclei (AGN; all reported by Hickson 1997). Also observed are giant gaseous outflows (e.g. in HCG44, Serra et al. 2012), or even large-scale shocks (e.g. in Stephan’s Quintet; Appleton et al. 2006; O’Sullivan et al. 2009). Even though it has been proven that some of the originally defined HCGs do not to fulfil the selection criteria, the acronym HCG stands for a well-defined class of objects.
Among the different domains of the electromagnetic spectrum, the radio domain seems to be one of the least studied for the galaxy groups. This is because in galaxy groups only compact sources of radio emission (e.g. the aforementioned nuclei) can be observed at radio wavelengths reasonably easily. Extended structures, with only a few exceptions, usually pose many technical and observational difficulties. Interferometric observations of objects in which bright compact sources are embedded in a weak diffuse emission are particularly exposed to the missing zero-spacing problem caused by incomplete spacing of the (u,v) plane. Reliable results need single-dish data. However, in this case the beam-smearing effect mixes compact and diffuse emission. Additionally, a decaying electron population, especially in the intergalactic areas, directs the attention to lower frequencies. However, for most of the radio telescopes such a combination results low angular resolution that is too low to study dense, and hence angularly small, galactic systems. Only in the advent of newest instruments, such as LOFAR (van Haarlem et al. 2013), LWA (Ellingson et al. 2009), or MWA (Tingay et al. 2013) can high-resolution studies at low radio frequencies be carried out. Unfortunately, galaxy group studies have not yet been performed at any of these facilities.
Despite the impediments mentioned above, an increasing interest in studying the properties of the radio emission of HCGs can be observed recently. A selection of compact groups has been studied using the GMRT (Giacintucci et al. 2011) with interesting results obtained. For example, Giacintucci et al. found the elliptical-dominated system HCG 15 has a large halo of radio emission that is visible both at 240 and 612 MHz. Another compact group, HCG 62, was also featured in their study, and in that case, extended emission was detected as well. A further example of a compact group that is a radio emitter is the Stephan’s Quintet, also known as HCG 92. Moreover, the Quintet is, so far, the only compact group for which the polarised intergalactic emission was detected (Nikiel-Wroczyński et al. 2013b) and magnetic field properties (Xu et al. 2003; Nikiel-Wroczyński et al. 2013b) were studied; the study of two southern compact galaxy groups (Farnes et al. 2014) did not reveal any intergalactic polarised structures.
In our paper on HCG 92 we focused on the magnetic field properties. We found that the energy density of the magnetic field in the shock region compares with that of the thermal component (estimated using the X-ray data from Trinchieri et al. 2003, 2005; and O’Sullivan et al. 2009). Similar energy densities of the magnetic field have also been reported for intergalactic structures in objects where no lookalikes of the shock region in the Quintet are present, for example in the Taffy Galaxies (Condon et al. 1993, 2002). A strong suggestion is that the magnetic field plays an important role in the dynamics of those groups where it is present. Additionally, the orientation of the ordered magnetic field, which is detectable via the study of the polarised synchrotron emission, turns out to be a powerful tool for identifying possible intergalactic bridges and outflows.
In this paper we present the results of a pilot study of the magnetic field properties in a selected, small sample of HCGs. We used the 100 m Effelsberg radio telescope to observe selected Hickson groups for which archival high-resolution VLA data from the NRAO VLA Archive Survey (NVAS) showing no extended emission, but only compact structures were available. To ensure full data compatibility and also the best compromise of sensitivity and resolution of the Effelsberg radio telescope, we chose the frequency of 4.85 GHz. Because the single-dish data are now accompanied by short-time high-resolution observations showing only compact structures, unwanted contribution (after convolution) can be safely subtracted from the single-dish observations leaving only the extended emission.
Additionally, to obtain the spectral information we used the NRAO VLA Sky Survey (NVSS; Condon et al. 1998) data showing both compact and some diffuse emission at a resolution somewhat higher than that of the 100 m dish. At this frequency, the subtraction was also based on the archive data from the NVAS. Wherever possible, magnetic field estimations have been carried out and the morphology of the radio emission was investigated.
2. Observations and data reduction
2.1. Selection criteria
We have chosen four objects, for which the integrated flux density in the NRAO VLA Sky Survey (NVSS) at 1400 MHz – representing the emission of both extended and compact sources – is significantly higher than the flux density in the high-resolution archive data, representing the compact sources exclusively. The list consists of HCG 15, 44, 60, and 68.
The 4.85 GHz radio data used in our study were recorded at the 100 m radio telescope in Effelsberg using a dual-horn backend with an ability to detect Stokes I, Q, U, and V signals. The total bandwidth was 500 MHz. For each of the targets, we obtained several coverages that were scanned in the Az-El frame. All these coverages were reduced in the same manner via the NOD2 package (Haslam 1974); radio frequency interferences (RFI) and luminous sources detected by one horn only were flagged in the original (beam-switched) maps, which were then restored, mirrored, and translated to the RA-Dec scheme. The total number of coverages that went through this procedure as well as other basic information on the single-dish data can be found in Table 1. For each of the groups, component maps were combined in the Fourier domain so the scanning effects can be reduced (Emerson & Gräve 1988). The flux density scale, both for total power and linear polarisation, was established using observations of 3C 48, 3C 147, and 3C 286, according to values given by Mantovani et al. (2009) (absolute calibration based on Baars et al. 1977). We used the Astronomical Image Processing System (aips) to alter the geometry of the final images to match that of the optical images and to combine the Q and U maps to produce polarisation intensity and angle distributions. The NVSS data were acquired from the NRAO Postage Stamp Server, thus were not re-calibrated; therefore, the full processing scheme can be found in Condon et al. (1998).
To include the calibration uncertainties, we introduced a 5% uncertainty for compact sources for all the channels (peak values). In case of extended sources, the final uncertainty is calculated as a quadratic sum of the calibration uncertainty and the map rms noise multiplied by the square root of the number of beams per a given structure.
2.2. Subtraction of the compact structures
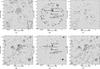 |
Fig. 1 Radio maps of HCG 15. Upper panels: Effelsberg maps at 4.85 GHz are shown. Lower panels: NVSS maps at 1.40 GHz are shown. Common for both frequencies: the left map is the TP emission with apparent B vectors overlaid. The central map is the TP emission from the NVAS data smoothed to 20 arcsec resolution. The right map is the TP emission with compact sources subtracted. The background map is a POSS-II R-band image. The contour levels are −5,−3 (dashed), 3,5,10 × rms noise level. The beam is represented by a circle in the lower left corner of the image. The 1 arcsec length of the apparent B vectors corresponds to 0.03 mJy/beam. 1 arcmin is equal to ≈27 kpc at the position of HCG 15. |
Basic information on the datasets used in this study.
Basic information on archive data used for subtraction.
The beam of the single-dish observations is large enough so that unwanted contribution from compact sources, i.e. background objects, disks of member galaxies, or AGN activity within the groups, can be smeared together with the extended intergalactic emission, which is the target of our study. Before the magnetic field can be analysed, subtraction of such sources must be performed. We searched the NRAO Archive and the NVAS for high-resolution observations of our target groups taken at 1.40 and 4.85 GHz. We completed a set of eight total power datasets, i.e. two per each group for 4.85 and 1.40 GHz maps, which represented the compact sources contribution. These datasets (details on them can be found in Table 2) were reduced following the standard VLA continuum data reduction procedure (as outlined in the aips cookbook). At 4.85 GHz, these maps were then convolved with the Effelsberg beam image (acquired from the calibrator observations) using aips. As a consistency check of the flux density scale, we performed a similar operation with a Gaussian image of the same half power beam width (HPBW) and then with (u,v)-tapered maps. In both cases, the resulting images were consistent with those obtained using the first method within the derived flux density uncertainties. Convolved VLA maps were subtracted from the Effelsberg observations. A similar procedure was applied to the 1.40 GHz data with the exception that the beam was assumed to have a Gaussian profile, and the beam shape was assumed to be same as for the NVSS (circular, HPBW of 45 arcsec).
The final images for the specific galaxies (cropped so only the galaxy groups are present, without large void areas) are presented in the right panels of Figs. 1–4; 4.85 GHz results are always in the upper corner and the 1.40 GHz are in the lower corner. Flux densities before and after subtraction, as well as the total flux density for all the subtracted sources, are given in Table 3. The subtracted spectral index value was calculated using the flux density values measured in the diffuse emission-only maps. As these values are sometimes close to the map rms noise, their uncertainties are much higher. Therefore, they should be treated with caution. In several cases when the flux density was given only as an upper limit (rms value), the flattest possible index value was inserted. All such examples are listed in the table.
It should be indicated here that no polarisation has been detected in the high-resolution data, rendering the subtraction of the compact, polarised structures impossible.
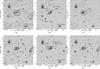 |
Fig. 2 Radio maps of HCG 44. Upper panels: Effelsberg maps at 4.85 GHz are shown. Lower panels: NVSS maps at 1.40 GHz are shown. Common for both frequencies: the left map is the TP emission with apparent B vectors overlaid. The central map is the TP emission from the NVAS data smoothed to 20 arcsec resolution. The right map is the TP emission with compact sources subtracted. The background map is a POSS-II R-band image. The contour levels are −5,−3 (dashed), 3,5,10,25 × rms noise level. The beam is represented by a circle in the lower left corner of the image. The 1-arcsec length of the apparent B vectors corresponds to 0.03 mJy/beam. 1 arcmin is equal to ≈7 kpc at the position of HCG 44. |
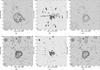 |
Fig. 3 Radio maps of HCG 60. Upper panels: Effelsberg maps at 4.85 GHz are shown. Lower panels: NVSS maps at 1.40 GHz are shown. Common for both frequencies: the left map is the TP emission with apparent B-vectors overlaid. The central map is the TP emission from the NVAS data, smoothed to 20 arcsec resolution. The right map is the TP emission with compact sources subtracted. The background map is a POSS-II R-band image. The background map is a POSS-II R-band image. The contour levels are −5,−3 (dashed), 3,5,10,25,50,100,250 × rms noise level. The beam is represented by a circle in the lower left corner of the image. The 1-arcsec length of the apparent B vectors corresponds to 0.06 mJy/beam; 1 arcmin is equal to ≈75 kpc at the position of HCG 60. |
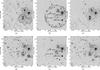 |
Fig. 4 Radio maps of HCG 68. Upper panels: Effelsberg maps at 4.85 GHz are shown. Lower panels: NVSS maps at 1.40 GHz are shown. Common for both frequencies: the left map is the TP emission with apparent B vectors overlaid. The central map is the TP emission from the NVAS data smoothed to 20 arcsec resolution. The right map is the TP emission with compact sources subtracted. The background map is a POSS-II R-band image. The background map is a POSS-II R-band image. The contour levels are −5,−3 (dashed), 3,5,10,25,50,100 × rms noise level. The beam is represented by a circle in the lower left corner of the image. The 1-arcsec length of the apparent B vectors corresponds to 0.03 mJy/beam; 1 arcmin is equal to ≈11 kpc at the position of HCG 68. |
3. Results
Figures 1–4 consist of six panels. The upper left panel is comprised of contours from the 4.85 GHz total power data with apparent B-vectors of the magnetic field superimposed; the upper middle has contours from the 4.85 GHz high-resolution total power data with galaxy designations superimposed; the upper right has contours from the 4.85 GHz total power data after subtraction of the compact sources; the lower left has contours from the 1.40 GHz total power data with apparent B vectors of the magnetic field superimposed; the lower middle is comprised of contours from the 1.40 GHz high-resolution total power data with galaxy designations superimposed; and the lower right has contours from the 1.40 GHz total power data after subtraction of the compact sources.
All presented magnetic field vectors are apparent, i.e. they have not been corrected for the foreground Faraday rotation. Table 3 lists the averaged foreground rotation measure taken from Taylor et al. (2009) and the angle corrections – upper limits for the foreground Faraday rotation – are given in the appropriate paragraphs. Throughout the paper, the Sν ∝ ν− α convention is adopted. The H0 parameter is assumed to be 73 km s-1 Mpc-1.
3.1. HCG 15
The 4.85 GHz emission of HCG 15 (Fig. 1a) is dominated by the central engine of its “D” galaxy UGC 1618. The emission region covers two other galaxies; however, its extent is similar to the size of the telescope beam. No emission has been detected in the Effelsberg observations either from other group members or from intergalactic areas. The NVSS map shows a lot more extended region of emission, covering a vast area of the group. The central galaxy is still the strongest source of radiation and is embedded in the aforementioned structure.
The polarimetric information in the case of this group is, however, unreliable, as the signal barely exceeds 3× the rms value. The NVSS map shows polarisation vectors extending into the intergalactic space in the central part of the radio halo. However, it is impossible to clarify whether this is not just a smeared out contribution of background sources. The vectors are rotated by approximately 90° clockwise by the foreground Faraday rotation.
3.2. HCG 44
Unlike HCG 15 described above, HCG 44 (Fig. 2a) looks like a much more interesting system. Its central galaxy (NGC 3190) is immersed in a bubble of radio emission with total flux density of 13.8 ± 1.0 mJy. The peak flux density refers to a point that is located south from the centre of this galaxy. A bridge of radio emission that reaches 5× rms contour near NGC 3190, extends northwestward pointing at another member object, i.e. the barred spiral galaxy NGC 3187; surprisingly, this bridge is visible only at 4.85 GHz. The disk of NGC 3187 is not visible at 4.85 GHz. The southernmost member, NGC 3185, is also surrounded by the radio emission, and, similar to the case of the central galaxy, the peak flux density of the radio emitting region is shifted from its optical centre – this time, in the northern direction. The elliptical NGC 3193 was not detected at both frequencies.
Not much polarisation can be seen from this galaxy group. At 4.85 GHz, the disk of NGC 3190 seems to be polarised. However, at 1.40 GHz, the polarised signal comes instead from the background sources south from it. The foreground Faraday rotation is negligible at 4.85 GHz, but at the lower frequency it alters the apparent B-vector orientation by approximately –30° clockwise.
3.3. HCG 60
HCG 60 is dominated by a radio loud region in the centre of this galaxy group. Its size is significantly larger than the beam area; the 4.85 GHz total flux density of 244 ± 15 mJy makes it the brightest galaxy group in our study; it is also the brightest group at 1.40 GHz (657 ± 33 mJy). The morphology of radio emission is very similar at both of these frequencies. The high-resolution images reveal that this group hosts a head-tail radio source, previously reported and studied by Rudnick & Owen (1976), Miley & Harris (1977), and Jägers (1987). The 4.85 GHz map of HCG 60 has the highest noise level among the set. This is because of a limited number of coverages. Hence, the polarisation information cannot be used. Nevertheless, the radio emitting region is easily distinguishable from its surroundings.
3.4. HCG 68
The last object in our study is the group HCG 68. At 4.85 GHz the radio emitting structure covers three group members: northernmost NGC 5350 is connected with the close pair NGC 5353 and 5354 through a narrow trail that is most probably an effect of the beam smearing. The whole envelope extends far beyond the closest vicinity of the member galaxies, also containing an object without an optical counterpart (most possibly a background source) on its western side. Its northern part forms an envelope surrounding NGC 5350. At 1.40 GHz, there is no connection between this galaxy and the aforementioned pair, but hints at the presence of an envelope remain. Other group members are radio quiet and there are no intergalactic structures that connect them either at 1.40 or at 4.85 GHz.
Several spots of polarised emission can be easily seen at the higher frequency. However, the signal-to-noise ratio for these objects is rather low: it barely exceeds 3× rms and in most of the cases is lower than 5× the rms Therefore it is possible that the emitting area is not a real signal. This claim seems to be supported by the results from the 1.40 GHz emission, where only the western background source is polarised.
Flux densities (with uncertainties) obtained for the selected regions of radio emission.
4. Discussion
4.1. Magnetic field estimation
The magnetic field was estimated in specific areas of the studied objects following the formulae derived by Beck & Krause (2005). An assumption of (revised) energy equipartition between the magnetic field and cosmic ray particles was made. All the estimations were made via the bfeld code presented by Beck & Krause (2005). This code derives magnetic field parameters based on the supplied values of the proton-to-electron energy density ratio K0, total path length through the source D, the mean synchrotron surface brightness of the chosen region, and the non-thermal spectral index α. The value K0 was fixed at the typical value of 100. We caution that in general this parameter may adopt other values and its proper estimation is difficult; however, the magnetic field strength is only weakly dependent on it. The spectral index was calculated between the NVSS and Effelsberg maps after subtraction of the compact sources; it complies with the Sν ∝ ν− α convention. As the thermal fraction of the emission is unknown, we assumed that the synchrotron spectral index required in magnetic field estimation can be well approximated by our calculated subtracted value. In case of objects where the subtracted value was unreliable because they were not detected in the subtracted 4.85 GHz maps, the total value was adopted (see specific subsections for details). The path length was calculated one of two ways. For groups Nos. 15 and 60 it was calculated under the assumption of spherical symmetry of the studied object; however, this probably gives an upper path-length limit so that both strength and energy density are higher than those estimated. In case of groups Nos. 44 and 68, the path length was calculated assuming the magnetic disk thickness of 1–2 kpc; this presumption is widely used in literature (see e.g. Beck et al. 1996, and references therein). The total uncertainty of the estimated values accounts for a factor of two uncertainties rising from the unknown thermal fraction of the emission, exact path length, and surface brightness. All the estimated values can be found in Table 3.
4.2. Overview of the individual groups
4.2.1. HCG 15
This group was expected to be the most promising target of our study. However, as already mentioned in Sect. 3.1, the extent of the radio emission from this galaxy group is comparable to the size of the Effelsberg telescope beam at 4.85 GHz. Subtraction of the compact sources, in this case, the AGN in the central galaxy UGC 1618, leaves nothing but noise, as less then 10% of the original flux density remains. There are no signs of over-subtraction, as the negative signal barely extends the 3× rms contour only in isolated, small areas. HCG 15 is known to have its galaxies shrouded in a large halo and is visible very well both at 612 MHz and in the X-ray regime (Giacintucci et al. 2011); a large part of this structure is still detectable at 1.40 GHz in the NVSS and more than 80% of the total flux density at that frequency is attributed to the diffuse structure. Even more surprising is the value of the spectral index; assuming the noise level as the flux density at 4.85 GHz and using the NVSS signal with the AGN contribution subtracted, one arrives at α of ≈2.7. The unusual steepness cannot be attributed to the incomplete subtraction of the flux density of point sources at 1.40 GHz. Even if the maximum subtraction method (Chyży et al. 2003) is used, the residual flux density is sufficient to yield a spectral index of ≈2.2; to achieve a typical index of ≈1.0, more than 80% of total flux density should be subtracted, and this value is clearly too high. Having in mind that the NVSS is a snapshot survey and the faintest emission can still remain undetected, the value of 2.7 can be treated as the flattest spectral index possible. The unusually steep spectrum is consistent with an age estimate based on the calculation of time needed for the electrons to travel from the centre of the group to its outskirts (a distance of app. 55 kpc): assuming they travel with Alfvén speed (here adopted as 500 km s-1), it takes ≈110 Myr to produce the observed radio halo, which is a reasonably large amount of time to explain the spectral index value.
To perform the magnetic field estimation, we assumed that the spectral index value is between 2.0 and 3.0. Spherical symmetry has been adapted to derive the path length; from the angular size and distance to the group, values between 15 and 25 kpc seem to be reasonable. Substitution of these values to bfeld yielded magnetic field strength of 4.7 ± 2.3μG and magnetic field energy density of 9.3 ± 4.6 × 10⁻¹³erg cm-3. These values are lower than those estimated for already studied compact galaxy systems (such as the Stephan’s Quintet or Taffy galaxies). In particular, the magnetic field energy density is about a factor of several lower than for the aforementioned objects. As there was no detection of polarised signal, it is impossible to estimate the ordered component strength; substitution of noise values to derive the upper constraint is also not feasible.
If calculated via the 1.40 GHz flux density and the same (assumed) spectral index, the magnetic field strength rises to 7.8 ± 1.8 μG. The apparent difference is due to the assumed spectral index value not accounting for, for example spectrum curvature. The magnetic field energy density derived this way increases to half of the value estimated for Stephan’s Quintet and total field strength reaches values typical for galaxies.
4.2.2. HCG 44
At a distance of approximately 20 Mpc away, HCG 44 is the nearest object in our study (and the nearest HCG; Hickson et al. 1992). Its central galaxy NGC 3190 dominates the group at both frequencies. Subtraction of the compact sources, including two background objects south from the galaxy disk leaves an extended structure that is still significant (nearly 70% of the original flux density), with the total flux density of 9.2 ± 1.0 at 4.85 GHz. The strength of the magnetic field in the disk of NGC 3190 is thereby 6.7 ± 1.3μG and its energy density is equal to 1.8 ± 0.7 × 10⁻¹²erg cm-3. Such values are comparable to what was found for most of the normal (non-starburst and non-AGN) spiral galaxies by Niklas (1995), i.e. 9 ± 1.3μG. The emission seems to be polarised with apparent polarisation vectors visible over the galactic disk. For the southern galaxy, similar values of BTOT and EB have been derived and therefore similar conclusions can be drawn.
HCG 44 is known to contain a large HI tail (Serra et al. 2012), i.e. 300 kpc long. This tail is possibly a remnant of the encounter between NGC 3187 and other group members. Albeit the tail itself is located north of the group centre, it is still interesting to search for any radio structures that might result from this interaction. There is one intergalactic structure that draws attention: a bridge-like extension between NGC 3190 and 3187. If real, it would suggest that the interaction–driven stripping of the neutral and ionised matter proceeded in a significantly different way. However, the detected structure is relatively weak, just exceeding the 3× rms level. Its angular extent, compared to the beam size, is small. Having in mind that it lies close to a strong source (disk of the central galaxy and background sources) it is possible that it could be a scanning effect. Although careful analysis of individual projections failed to identify any single maps that could cause emergence of the bridge, the limited parallactic angle coverage certainly makes performance of the basket weaving method worse. Despite having an angular size that is smaller than the size of the largest observable structure at 1.40 GHz, there is no trace of its counterpart in the NVSS data; however, on the other hand, the NVSS consists of snapshots and may miss a significant amount of faint, extended emission. Additional coverages and additional data from other telescopes are necessary to confirm or reject its existence.
Similarly to the case of HCG 15, we tried to estimate the age of the bridge. If electron velocity equal to the Alfvén speed (adopted as 500 km s-1) is assumed, then the age the structure is equal to approximately 25 Myr. A supposedly flat spectrum is coherent with this value.
4.2.3. HCG 60
HCG 60 is one of those HCGs that actually do not meet the criteria to be identified as compact groups. Because it is in the central region of the rich cluster Abell 1452, HCG 60 does not fulfil the isolation requirement. Nevertheless, it is still an interesting target, confirming the claim that physical conditions in some of the compact groups might be similar to those in the central regions of galaxy clusters (Hickson 1982). The central galaxy of HCG 60 has an active nucleus that was originally described by Rudnick & Owen (1976). Miley & Harris (1977) suggested that the unique morphology of this object might be due to a sharp change in the propagation direction of the host galaxy through the intra-group medium, and (or) its immersion in the intergalactic wind. Jägers (1987) compiled their results together with his new data at 0.6 GHz, concluding that the first possibility is supported by his findings. A study of the polarised emission from this object was also presented.
Compared to the Jägers maps, the NVSS data seem to show more polarised emission. However, both at 4.85, and 1.40 GHz instrumental effects seem to dominate the picture, yielding the analysis of ordered magnetic field component impossible. Subtraction of the compact sources leaves a significant remaining structure both at 1.40 and 4.85 GHz (approximately 55% and 30%, respectively). Assuming spherical symmetry (thus, path length of 100–300 kpc), we estimate the magnetic field to be equal to 3.2 ± 1.7μG.
It is interesting to ask what is the origin of the emission that remains after subtraction of the compact sources. Both 1.40 and 4.85 GHz high-resolution, archive data reproduce the head-tail structure of the radio galaxy very well, so all the structures resulting from recent activity could be efficiently subtracted. This would leave the remaining emission to be either emerging from old lobes, from non-AGN-related intergalactic structures, or from both. This claim is supported by the comparison of “extended” and “compact” emission fractions at both frequencies. At 1.40 GHz, the “extended” component dominates over the “compact” component, whereas this situation gets reversed at 4.85 GHz, where the flux density losses cannot be attributed to the missing flux density problem. However, at this moment it is impossible to exclude any of the presented, possible origins of that “extended” component.
4.2.4. HCG 68
The last object in our study is HCG 68. This group is very close to the Milky Way (≈30 Mpc) and its main galaxies are listed under the NGC designation. The most recognisable part of the group is the triplet of galaxies NGC 5350–5353–5354. All of these galaxies are radio loud, with NGC 5350 classified as either LINER, or starburst (Chapelon et al. 1999) and NGC 5354 as a possible Seyfert galaxy (Véron–Cetty & Véron 2006). Subtraction of the compact sources at 1.40 GHz leaves most of the emission from NGC 5354 intact, as well as two small extensions of the envelope of NGC 5350. At 4.85 GHz, the radio emission from two central galaxies and the nearby background source is significantly oversubtracted, with negative signal exceeding the 5× rms level in an area about one beam in size. The reasons for this effect are yet unknown; possible explanations include the variability of the AGN during the period between the high-resolution observations made with the VLA (more than 25 years), or that additional flux density errors induced by the weather conditions and not completely ruled out by the beam-switching system; hence, re-observations for this group might be of use. Therefore, the total (non-subtracted) spectral index was used to estimate the magnetic field properties of NGC 5353/54. The resulting values suggest a rather typical field of microgauss strength. The northernmost galaxy NGC 5350 possesses a slightly weaker field. Both at 1.40 and 4.85 GHz, the size of the radio halo is larger than that of the optical disk. However, there are no signs of outflows from the halo or its distortions, which could signify ongoing interactions.
4.3. Question of the intergalactic magnetic fields
The main reason behind this study was to estimate the intergalactic field strength and energy density for a selected sample of HCGs in a manner particularly sensitive to weak extended radio emission. This study combined with our previous investigations of intergalactic emission from galaxy groups has revealed the following (phenomenological) classes of such objects:
-
1.
Spiral-dominated groups with no detectable intergalacticemission: Leo Triplet (Nikiel-Wroczyński etal. 2013a), and HCG 68(possibly also HCG 44).
-
2.
Spiral-dominated groups with strong intergalactic magnetic fields: Stephan’s Quintet (SQ, Nikiel-Wroczyński et al. 2013b).
-
3.
E/S0-dominated groups with intergalactic emission and a currently active nucleus in at least one of the member galaxies: HCG 60.
-
4.
E/S0-dominated groups with intergalactic emission but no jet-producing nuclei: HCG 15.
In HCG 68, the only large-scale structure could be the halo of its member galaxy NGC 5350. To make any conclusions much better data are needed; nevertheless, it is likely that there is no genuine diffuse intergalactic radio emission in this system.
What could generally be expected is that systems of galaxies that usually host magnetic fields would be those that contain intergalactic magnetic fields as well. Late-type spiral galaxies are known to be sources of magnetic fields: phenomena that are responsible for their effective amplification, such as the dynamo process, star formation, or supernovae, are common in such objects. However, the Stephan’s Quintet, (SQ), possessing intergalactic radio emission (class (2.) described above) is a much tighter group than those belonging to class (1.). Moreover, it shows indications of star formation and intergalactic shock between member galaxies (Xu et al. 2005). Indeed the intergalactic emission in SQ has a relatively flat spectrum, as it is easily recognisable at frequencies as high as 8.35 GHz (Nikiel-Wroczyński et al. 2013b). This indicates a mutual proximity between electron-producing, star-forming regions and those producing radio emission.
The first class of systems contains these objects, which do not host intergalactic radio emission. For loose groups, the spatial scale of galaxy distribution may be too large to be efficiently filled with magnetic fields and cosmic rays pulled out from member galaxies. The differences between magnetic fields in loose (Leo Triplet) and tight (SQ) groups are emphasised by the fact that the tidal dwarf formed in the gaseous tail is unmagnetised in the first case, while housing strong magnetic fields (≥6 μG) in case of the SQ tidal dwarf (Nikiel-Wroczyński et al. 2013b, 2014).
HCG 44 falls into one of the two categories described in the former paragraphs. The weak bridge is the single sign of intergalactic magnetic fields, but its low signal-to-noise ratio and lack of detection at any other frequency makes it hard to discuss. If this structure is not a real one, it falls into the first category – and indeed the size of the group and some of the features (e.g. the giant neutral gas tail) bears resemblance with the Leo Triplet; but even if the structure is real, still, the extent of the intergalactic emission and its character are incomparable to the opulence of magnetised structures seen in the SQ. HCG 44 could be regarded as a transitional state between classes (1.) and (2.), but it does not violate the general conclusion that loose groups are less prone to be brimful of magnetised IGM.
Elliptical, or lenticular, early-type galaxies are usually believed to lack mechanisms such as the large-scale dynamo generating disk magnetic fields or star formation (thus supernovae) that produce cosmic-ray electrons. They are not expected to contribute to intergalactic radio emission. An alternative is the supply of the magnetic fields and relativistic particles via jets or large-scale structures propelled by AGNs. This may be the case for HCG 60 representing class (3.) as defined above. These kinds of radio structures are frequent in the survey by Giacintucci et al. (2011). The diffuse radio emission seems to form a cocoon encompassing the pair of jets and extending even further into extragalactic space. As expected for an ageing population of relativistic electrons, this radio envelope has a rather (but not extremely) steep spectrum (Table 3). In this class of galaxy groups the intergalactic magnetic fields may be spread around by AGNs.
The jets of HCG 60 are perpendicular to each other, which is a clear indication of ram pressure caused by galaxy motion through the intragroup matter. Indeed, many groups from the HCG list exhibit a substantial H i deficiency (e.g. Hutchmeier 1997) possibly due to ram pressure effects (or, at least partly). Also, the estimated intergalactic magnetic fields in the cocoon of HCG 60 are rather weak. However, as mentioned in Sect. 4.2.3, the path length through the emitting matter was estimated assuming a spherical symmetry of the cocoon. Thus, the obtained field strength and energy density can be regarded as lower limits while the true values can be somewhat higher.
HCG 15 represents the most interesting objects denoted above as class (4.). Its early-type member galaxies lack star formation signatures (hence dynamo mechanism and sources of relativistic electrons). They also lack strong, jet-producing AGNs, the origin of intergalactic synchrotron emission is therefore not obvious. Da Rocha et al. (2008) found a faint stellar glow in the intragroup space of HCG 15; however, its colour resembles that of the old stars. Such stars cannot produce supernovae, so the cosmic rays might originate only from supernovae remnants from former generation of stars; this old electron content is unlikely to explain the observed radio structure. Giacintucci et al. (2011) suggested that the radio structure of HCG 15 may be an analogon of the shock region in Stephan’s Quintet. Apparently this is not case because of the lack of traces of intergalactic starburst activity (Da Rocha et al. 2008).
The lack of identifiable sources of intra-group magnetic fields in HCG 15, together with its very steep high-frequency spectrum (Table 3), bears some similarities with halo-like relics found in clusters. Slee et al. (2001), following Giovannini et al. (1999), states that approximately 10% of the clusters contain such structures. Even though most of the relics are arc-like objects, nevertheless there are also a number of halo-like relics, such as the relic in the Coma cluster (Willson 1970). The sizes of such structures, usually 1–2 Mpc, are significantly larger than the relic found in HCG 15, however clusters themselves are also larger than galaxy groups; in addition, the so-called mini-haloes of hundreds of kpc have also been reported. With its spatial extent of ≈100 kpc, the radio envelope of HCG 15 can possibly be treated as a lower boundary for such structures. Slee et al. (2001) surveyed several cluster relics and found their high-frequency spectral indices to be in the range 2.1–4.4, which is considerably steeper than for the large-scale Coma halo (1.34, Kim et al. 1990) and dramatically steeper than for galactic disks. HCG 15 belongs to one of the most H i deficient HCGs (Verdes-Montenegro et al. 2007), which may indicate strong gas-stripping processes, hence possible compression phenomena in the intergalactic gas. However, polarisation information is still missing in this picture; the cluster relics are known to be polarised. Unfortunately, without sensitive polarimetric observations around or below 1 GHz, the true character of the detected structure cannot be revealed.
The frequency coverage of our study is too scarce to accurately estimate the age of the radio emitting structure in HCG 15. Nevertheless, a crude estimate can be made under the assumption that the break frequency is located somewhere between 1.40 and 4.85 GHz. This is probable as the flux density values measured by Giacintucci et al. (2011) yield a total spectral index of approximately 0.8 between 0.61 and 1.40 GHz. The contribution of compact sources at 1.40 GHz is not too high, at about 10%, so the low-frequency spectral index of the diffuse emission should not be larger than 0.8–1.0, signifying a considerably flatter spectrum than at frequencies above 1.4 GHz. Using the magnetic field strength values derived in Sect. 4.1 and substituting them to the spectral age equation from Murgia (1996), we estimate the radiative age of the envelope to be between 0.3 and 1.0 × 10⁸ years. This is very similar to what Slee et al. (2001) found for four relics they studied, it is also similar to the estimate based on the electron propagation velocity presented in Sect. 4.2.1.
Irrespectively of its origin, this intergalactic reservoir of gas hosts magnetic field that, albeit weaker than in individual galaxies, can still be dynamically important; its energy density is lower than in Stephan’s Quintet, but still of the same order of magnitude. The thermal energy density of the IGM of HCG 15 is likely to be lower than for the Quintet if the main source of its heating was the passage of an intruder. As the electrons have not been supplied for a long time, it must have had taken place long ago and the gas has probably significantly cooled down. Altogether, this suggests that the dynamics of the intergalactic gas in HCG 15 is likely to be highly dependent on the magnetic field contained within it.
As shown by our study there are more examples of intra-group magnetic fields able to contribute pressure to the intergalactic gas dynamic. There is clear evidence that the magnetic pressure cannot be neglected in modelling the dynamics of gaseous processes in the intergalactic gas.
5. Conclusions
We performed a sensitive search for extended radio emission from four galaxy groups from the list of HCGs. We selected the following objects: spiral-dominated HCG 44 and HCG 68 as well as E/SO-dominated HCG 15 and HCG 60. To ensure the maximum sensitivity for extended, diffuse structures we used the Effelsberg 100 m radio telescope at 4.85 GHz. To avoid contamination of extended emission by beam-smeared compact structures we used the NVAS data at the same frequency, convolved to the resolution of the Effelsberg telescope, and then subtracted from our observations. To obtain the spectral information for our objects we used the archive NVSS data, also performing the subtraction of beam-smoothed compact structures from high-resolution VLA archive data.
The following results were obtained:
-
The spiral-dominated group HCG 68apparently does not show intergalactic emission, hence theintra-group magnetic fields are very weak. The same was found inour previous studies for another spiral-dominated group, i.e. theLeo Triplet (Nikiel-Wroczyński et al. 2013a).This remains in contrast with our recent finding for anotherspiral-dominated group, which is the much more tightly packedStephan’s Quintet, where strong intergalactic magnetic fields(≈10 μG) apparently pulled out from member galaxies were found. The second spiral-dominated object in the sample, HCG 44, may contain a magnetised outflow, but it has too low signal-to-noise ratio to be discussed. It might be a transitional case: a still loose object, but with weak intergalactic emission already present.
-
The E/S0-dominated group HCG 60 contains an active radio galaxy with two jets. Their subtraction still leaves a diffuse radio emitting envelope with a moderately steep spectrum (α = 1.3). Apparently the radio galaxy supplies magnetic fields and cosmic rays to the intra-group space. Substantial ram pressure effects, which are probably caused by the intra-group medium, can be seen here. This phenomenon may also be responsible for the H i deficiency in many groups (e.g. Hutchmeier 1997).
-
The E/S0-dominated group HCG 15 has been found to contain extended radio emission, signifying the existence of a 5–7 μG magnetic field. This is surprising as this group lacks obvious sources of magnetic fields and cosmic rays: the member galaxies show no signatures of recent star-forming activity. The colour of the optical glow between galaxies (Da Rocha et al. 2008) implies that only old stars are present there. The member galaxies also do not contain jet-forming AGNs. Indeed the radio structure shows an extremely steep spectrum with α not lower than ≈2.7, which means that the relativistic electron supply ceased long ago. In these respects the diffuse radio emission in HCG 15 resembles micro-haloes found in galaxy clusters (e.g. Slee et al. 2001). What we observe in HCG 15 may be a scaled down in size phenomenon similar to cluster relics; however, polarimetric data recorded beyond 1400 MHz is needed to clarify this hypothesis.
Our studies (also the previous ones) show that at least some galaxy groups contain large reservoirs of magnetised intergalactic matter. The magnetic fields and cosmic rays may be either supplied by star-forming spiral galaxies (Stephan’s Quintet), by active nuclei in group galaxies, or even by processes that bear similarities to those in cluster haloes. Whatever is the origin of this magnetism, the magnetic energy density seems comparable to the thermal (X-ray) energy density. The role of magnetic forces and pressures in the dynamics of the intergalactic gas of such galaxy groups cannot be neglected.
Acknowledgments
B.N.W. and M.S. are indebted to the staff of the radio telescope Effelsberg for all the help and guidance during the observations. The authors wish to thank Aritra Basu from the MPIfR Bonn for valuable comments. We acknowledge the usage of the HyperLeda database (http://leda.univ-lyon1.fr) and the NASA/IPAC Extragalactic Database (NED), which is operated by the Jet Propulsion Laboratory, California Institute of Technology, under contract with the National Aeronautics and Space Administration. This work was supported by the National Research Centre (NCN) grants UMO-2011/03/B/ST9/01859, and UMO-2012/07/B/ST9/04404. R.B. and D.J.B. acknowledge support from the DFG Research Unit FOR1254.
References
- Appleton, P. N., Xu, K. C., Reach, W., et al. 2006, ApJ, 639, L51 [NASA ADS] [CrossRef] [Google Scholar]
- Baars, J. W. M., Genzel, R., Pauliny-Toth, I. I. K., & Witzel, A. 1977, A&A, 61, 99 [NASA ADS] [Google Scholar]
- Beck, R., & Krause, M. 2005, Astron. Nachr., 326, 414 [NASA ADS] [CrossRef] [Google Scholar]
- Beck, R., Brandenburg, A., Moss, D., Shukurov, A., & Sokoloff, D. 1996, ARA&A, 34, 155 [NASA ADS] [CrossRef] [Google Scholar]
- Becker, R. H., White, R. L., & Helfand, D. J. 1995, ApJ, 450, 559 [NASA ADS] [CrossRef] [Google Scholar]
- Chapelon, S., Contini, T., & Davoust, E. 1999, A&A, 345, 81 [NASA ADS] [Google Scholar]
- Chyży, K. T., Knapik, J., Bomans, D. J., et al. 2003, A&A, 405, 513 [NASA ADS] [CrossRef] [EDP Sciences] [Google Scholar]
- Condon, J. J., Helou, G., Sanders, D. B., & Soifer, B. T. 1993, ApJ, 105, 1730 [NASA ADS] [CrossRef] [Google Scholar]
- Condon, J. J., Cotton, W. D., Greisen, E. W., et al. 1998, ApJ, 115, 1693 [Google Scholar]
- Condon, J. J., Helou, G., & Jarrett, T. H. 2002, ApJ, 123, 1881 [NASA ADS] [CrossRef] [Google Scholar]
- Da Rocha, C., Ziegler, B. L., & Mendes de Oliveira, C. 2008, MNRAS, 388, 1433 [Google Scholar]
- Ellingson, S. W., Clarke, T. E., Cohen, A., et al. 2009, Proc. IEEE, 97, 1421 [NASA ADS] [CrossRef] [Google Scholar]
- Emerson, D. T., & Gräve, R. 1988, A&A, 190, 353 [NASA ADS] [Google Scholar]
- Farnes, J. S., Green, D. A., & Kantharia, N. G. 2014, MNRAS, 437, 3236 [NASA ADS] [CrossRef] [Google Scholar]
- Giacintucci, S., O’Sullivan, E., Vrtilek, J., et al. 2011, ApJ, 732, 95 [NASA ADS] [CrossRef] [Google Scholar]
- Giovannini, G., Tordi, M., & Feretti, L. 1999, New Astron., 4, 141 [NASA ADS] [CrossRef] [Google Scholar]
- Haslam, C. G. T. 1974, A&AS, 15, 333 [NASA ADS] [Google Scholar]
- Hickson, P. 1982, ApJ, 255, 382 [NASA ADS] [CrossRef] [Google Scholar]
- Hickson, P. 1997, ARA&A, 35, 357 [NASA ADS] [CrossRef] [Google Scholar]
- Hickson, P., Mendes de Oliveira, C., Huchra, J. P., & Palumbo, G. G. 1992, ApJ, 299, 353 [NASA ADS] [CrossRef] [EDP Sciences] [MathSciNet] [PubMed] [Google Scholar]
- Hutchmeier, W. K. 1997, A&A, 325, 473 [NASA ADS] [Google Scholar]
- Jägers, W. J. 1987, A&AS, 71, 603 [NASA ADS] [Google Scholar]
- Kim, K.-T., Kronberg, P. P., Dewdney, P. E., & Landecker, T. L. 1990, ApJ, 355, 29 [NASA ADS] [CrossRef] [Google Scholar]
- Mantovani, F., Mack, K.-H., & Montenegro-Montes, F. M., et al. 2009, A&A, 502, 61 [NASA ADS] [CrossRef] [EDP Sciences] [Google Scholar]
- Miley, G. K., & Harris, D. E. 1977, A&A, 61, L23 [NASA ADS] [Google Scholar]
- Murgia M. 1996, Laurea Thesis, University of Bologna [Google Scholar]
- Nikiel-Wroczyński, B., Soida, M., Urbanik, M., et al. 2013a, A&A, 553, A4 [NASA ADS] [CrossRef] [EDP Sciences] [Google Scholar]
- Nikiel-Wroczyński, B., Soida, M., Urbanik, M., Beck, R., & Bomans, D. J. 2013b, MNRAS, 435, 149 [NASA ADS] [CrossRef] [Google Scholar]
- Nikiel-Wroczynski, B., Soida, M., Bomans, D. J., & Urbanik, M. 2014, ApJ, 786, 144 [NASA ADS] [CrossRef] [Google Scholar]
- Niklas S. 1995, Ph.D. Thesis, University of Bonn [Google Scholar]
- O’Sullivan, E., Giacintucci, S., Vrtilek, J. M., Raychaudhury, S., & David, L. P. 2009, ApJ, 701, 1560 [NASA ADS] [CrossRef] [Google Scholar]
- Rudnick, L., & Owen, F. N. 1976, ApJ, 203, 107 [Google Scholar]
- Serra, P., Koribalski, B., Duc, P.-A., et al. 2013, MNRAS, 428, 370 [NASA ADS] [CrossRef] [Google Scholar]
- Slee, O. B., Roy, A. L., Murgia, M., Andernach, H., & Ehle, M. 2001, AJ, 122, 1172 [NASA ADS] [CrossRef] [Google Scholar]
- Taylor, A. R., Stil, J. M., & Sunstrum, C. 2009, ApJ, 702, 1230 [NASA ADS] [CrossRef] [Google Scholar]
- Tingay, S. J. 2013, PASA, 30, 7 [Google Scholar]
- Trinchieri, G., Sulentic, J., Pietsch, W., & Breitschwerdt, D. 2003, A&A, 401, 73 [NASA ADS] [CrossRef] [EDP Sciences] [Google Scholar]
- Trinchieri, G., Sulentic, J., Pietsch, W., & Breitschwerdt, D. 2005, A&A, 444, 697 [NASA ADS] [CrossRef] [EDP Sciences] [Google Scholar]
- van Haarlem, M. P. 2013, A&A, 556, A2 [NASA ADS] [CrossRef] [EDP Sciences] [Google Scholar]
- Verdes-Montenegro, L., Yun, M. S., Borthakur, S., Rasmussen, J., & Ponman, T. 2007, New Astron. Rev., 51, 87 [NASA ADS] [CrossRef] [Google Scholar]
- Véron-Cetty, M.-P., & Véron, P. 2006, A&A, 455, 773 [NASA ADS] [CrossRef] [EDP Sciences] [Google Scholar]
- Willson, M. A. G. 1970, MNRAS, 151, 1 [NASA ADS] [CrossRef] [Google Scholar]
- Xu, C. K., Lu, N., Condon, J. J., Dopita, M., & Tuffs, R. J. 2003, ApJ, 595, 665 [NASA ADS] [CrossRef] [Google Scholar]
- Xu, C. K., Iglesias-Páramo, J., Burgarella, D., et al. 2005, ApJ, 619, L95 [NASA ADS] [CrossRef] [Google Scholar]
All Tables
Flux densities (with uncertainties) obtained for the selected regions of radio emission.
All Figures
|
Fig. 1 Radio maps of HCG 15. Upper panels: Effelsberg maps at 4.85 GHz are shown. Lower panels: NVSS maps at 1.40 GHz are shown. Common for both frequencies: the left map is the TP emission with apparent B vectors overlaid. The central map is the TP emission from the NVAS data smoothed to 20 arcsec resolution. The right map is the TP emission with compact sources subtracted. The background map is a POSS-II R-band image. The contour levels are −5,−3 (dashed), 3,5,10 × rms noise level. The beam is represented by a circle in the lower left corner of the image. The 1 arcsec length of the apparent B vectors corresponds to 0.03 mJy/beam. 1 arcmin is equal to ≈27 kpc at the position of HCG 15. |
| In the text | |
|
Fig. 2 Radio maps of HCG 44. Upper panels: Effelsberg maps at 4.85 GHz are shown. Lower panels: NVSS maps at 1.40 GHz are shown. Common for both frequencies: the left map is the TP emission with apparent B vectors overlaid. The central map is the TP emission from the NVAS data smoothed to 20 arcsec resolution. The right map is the TP emission with compact sources subtracted. The background map is a POSS-II R-band image. The contour levels are −5,−3 (dashed), 3,5,10,25 × rms noise level. The beam is represented by a circle in the lower left corner of the image. The 1-arcsec length of the apparent B vectors corresponds to 0.03 mJy/beam. 1 arcmin is equal to ≈7 kpc at the position of HCG 44. |
| In the text | |
|
Fig. 3 Radio maps of HCG 60. Upper panels: Effelsberg maps at 4.85 GHz are shown. Lower panels: NVSS maps at 1.40 GHz are shown. Common for both frequencies: the left map is the TP emission with apparent B-vectors overlaid. The central map is the TP emission from the NVAS data, smoothed to 20 arcsec resolution. The right map is the TP emission with compact sources subtracted. The background map is a POSS-II R-band image. The background map is a POSS-II R-band image. The contour levels are −5,−3 (dashed), 3,5,10,25,50,100,250 × rms noise level. The beam is represented by a circle in the lower left corner of the image. The 1-arcsec length of the apparent B vectors corresponds to 0.06 mJy/beam; 1 arcmin is equal to ≈75 kpc at the position of HCG 60. |
| In the text | |
|
Fig. 4 Radio maps of HCG 68. Upper panels: Effelsberg maps at 4.85 GHz are shown. Lower panels: NVSS maps at 1.40 GHz are shown. Common for both frequencies: the left map is the TP emission with apparent B vectors overlaid. The central map is the TP emission from the NVAS data smoothed to 20 arcsec resolution. The right map is the TP emission with compact sources subtracted. The background map is a POSS-II R-band image. The background map is a POSS-II R-band image. The contour levels are −5,−3 (dashed), 3,5,10,25,50,100 × rms noise level. The beam is represented by a circle in the lower left corner of the image. The 1-arcsec length of the apparent B vectors corresponds to 0.03 mJy/beam; 1 arcmin is equal to ≈11 kpc at the position of HCG 68. |
| In the text | |
Current usage metrics show cumulative count of Article Views (full-text article views including HTML views, PDF and ePub downloads, according to the available data) and Abstracts Views on Vision4Press platform.
Data correspond to usage on the plateform after 2015. The current usage metrics is available 48-96 hours after online publication and is updated daily on week days.
Initial download of the metrics may take a while.