Fig. 3
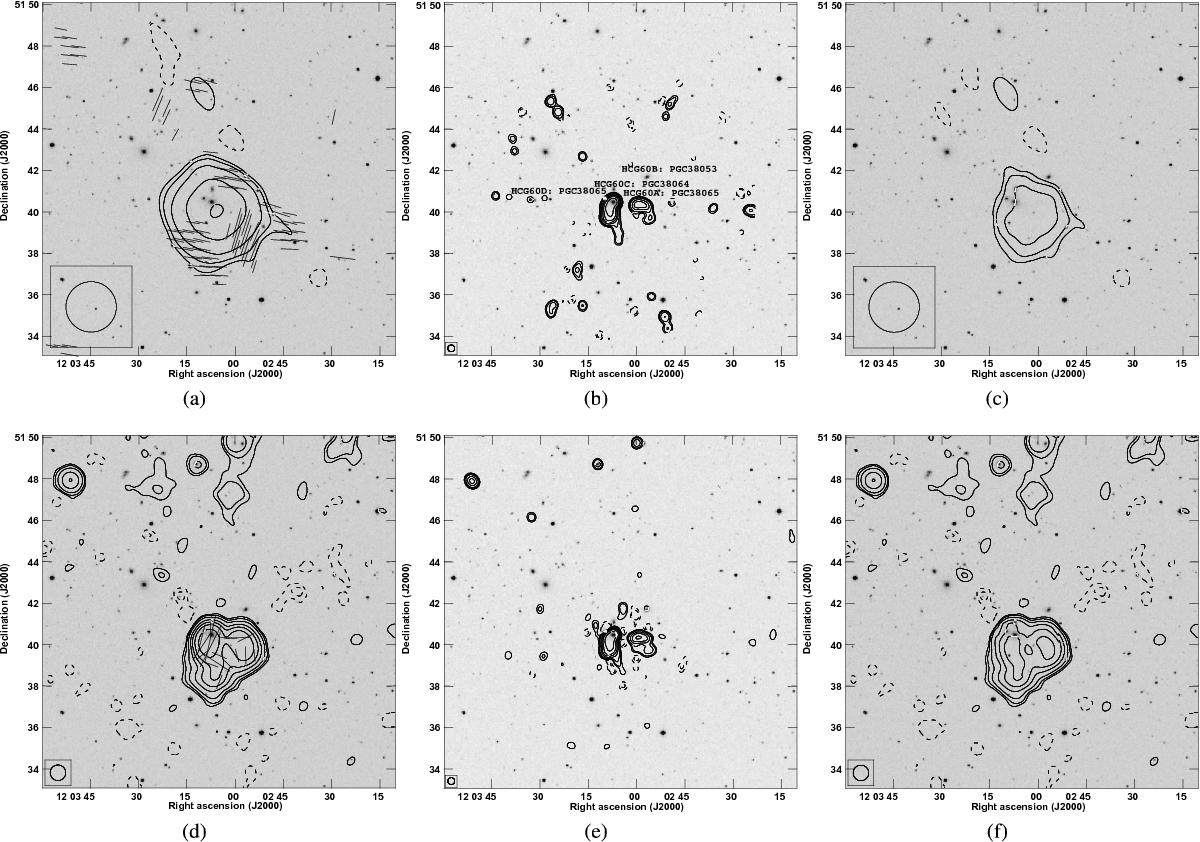
Radio maps of HCG 60. Upper panels: Effelsberg maps at 4.85 GHz are shown. Lower panels: NVSS maps at 1.40 GHz are shown. Common for both frequencies: the left map is the TP emission with apparent B-vectors overlaid. The central map is the TP emission from the NVAS data, smoothed to 20 arcsec resolution. The right map is the TP emission with compact sources subtracted. The background map is a POSS-II R-band image. The background map is a POSS-II R-band image. The contour levels are −5,−3 (dashed), 3,5,10,25,50,100,250 × rms noise level. The beam is represented by a circle in the lower left corner of the image. The 1-arcsec length of the apparent B vectors corresponds to 0.06 mJy/beam; 1 arcmin is equal to ≈75 kpc at the position of HCG 60.
Current usage metrics show cumulative count of Article Views (full-text article views including HTML views, PDF and ePub downloads, according to the available data) and Abstracts Views on Vision4Press platform.
Data correspond to usage on the plateform after 2015. The current usage metrics is available 48-96 hours after online publication and is updated daily on week days.
Initial download of the metrics may take a while.