| Issue |
A&A
Volume 566, June 2014
|
|
|---|---|---|
| Article Number | A133 | |
| Number of page(s) | 5 | |
| Section | Interstellar and circumstellar matter | |
| DOI | https://doi.org/10.1051/0004-6361/201322564 | |
| Published online | 25 June 2014 | |
Research Note
CRIRES-VLT high-resolution spectro-astrometry as a tool in the search for disks inside the cores of planetary nebulae⋆
1 Instituto de Astrofísica de Andalucía (IAA-CSIC), Glorieta de la Astronomía s/n, 18008 Granada, Spain
e-mail: mblanco@iaa.es; mar@iaa.es
2 European Southern Observatory (ESO), Karl Schwarzschild Str. 2, 85748 Garching bei München, Germany
e-mail: hukaufl@iaa.es
3 Universidad de Vigo, Departamento de Física Aplicada, Facultad de Ciencias, Campus Lagoas-Marcosende s/n, 36310 Vigo, Spain
e-mail: lfm@iaa.es
4 Consejo Superior de Investigaciones Científicas (CSIC), C/ Serrano 117, 28006 Madrid, Spain
5 Department of Astronomy and Astrophysics, University of Chicago, Chicago, IL 60637, USA
e-mail: seifahrt@oddjob.uchicago.edu
Received: 29 August 2013
Accepted: 15 May 2014
The onset of asymmetry in planetary nebulae (PNe) occurs during the short transition between the end of the asymptotic giant branch (AGB) phase and the beginning of the PN phase. Sources in this transition phase are compact and emit intensely in infrared wavelengths, making high spatial resolution observations in the infrared mandatory to investigate the shaping process of PNe. Interferometric VLTI IR observations have revealed compelling evidence of disks at the cores of PNe, but the limited sensitivity, strong observational constraints, and limited spatial coverage place severe limits on a universal use of this technique. Inspired by the successful detection of proto-planetary disks using spectro-astrometric observations, we apply this technique here for the first time to search for subarcsecond structures in PNe. Our exploratory study using CRyogenic high-resolution Infra-Red Echelle Spectrograph (CRIRES) commissioning data of the proto-PN IRAS 17516−2525 and the young PN SwSt 1 has revealed small-sized structures after the spectro-astrometric analysis of the two sources. In IRAS 17516−2525, the spectro-astrometric signal has a size of only 12 ± 5 mas, as detected in the Brγ line, whereas the structures found in SwSt 1 have sizes of 230 ± 29 mas in the [Fe iii] line and 130 ± 21 mas in the Brγ line. The spectroscopic observations required to perform spectro-astrometry of sources in the transition towards the PN phase are less time-consuming and much more sensitive than VLTI IR observations. The results presented here open a new window in the search for the small-sized collimating agents that shape the complex morphologies of extremely axisymmetric PNe.
Key words: techniques: spectroscopic / techniques: high angular resolution / ISM: jets and outflows / planetary nebulae: general / planetary nebulae: individual: IRAS 17516 / 2525 / planetary nebulae: individual: SwSt 1
© ESO, 2014
1. Planetary nebulae: shapes, shaping, and observational challenges
Planetary nebulae (PNe) emerge after the asymptotic giant branch (AGB) phase of low- and intermediate-mass stars (0.8 M⊙<Mi< 8 M⊙). PNe display an exceptional variety of morphologies whose shaping involves dramatic changes in the otherwise round envelopes of their progenitors. The most axisymmetric PNe represent a challenge to the understanding of their formation, since they contradict the canonical generalized interacting stellar wind model (GISW, Balick & Frank 2002). These PNe are believed to be sculpted by fast collimated outflows (jets), whose collimation and launch could be produced by strong magnetic fields (García-Segura et al. 2005) and/or binary systems (Soker 1998). De Marco (2009) proposed that disks might be associated with the binary evolution through a common-envelope phase.
As revealed by multiwavelength observations in the mid-IR and radio (Sahai et al. 2007), the onset of asymmetry in PNe occurs during the short transition between the end of the AGB phase and the beginning of the PN phase, when they are optically obscured. IR observations have revealed asymmetries in post-AGB sources and early proto-PNe such as bipolar lobes, and pinched waists and bright cores that appear as dark lanes at optical wavelengths (Suárez et al. 2009, 2011; Verhoelst et al. 2009; Lagadec et al. 2011; Blanco et al. 2013). Meanwhile, radio and mid-IR spectroscopic and interferometric observations have found strong evidence of small-sized dust and/or gaseous disks at the core of a few proto-PNe and young PNe. Bujarrabal et al. (2005) found a Keplerian disk of 900 mas in size at the center of AFGL 915, whereas disks of ~30 mas have been detected by MIDI-VLTI in M 2-9 and Mz 3 (Chesneau et al. 2007; Lykou et al. 2011) and a disk of 40 mas traced by water maser emission has been found in radio observations of the core of the young PNe K 3-35 (Miranda et al. 2001; Uscanga et al. 2008).
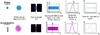 |
Fig. 1 Sketch of the SA technique (adapted from Whelan & Garcia 2008) showing the analysis of the long-slit spectra of a point source (top) and a compact bipolar PN (bottom). The major axis of the bipolar PN is assumed to be tilted with respect to the observer, with one lobe approaching (blue) and the other receding (red). The observation conditions smear out both sources into objects resembling unresolved point sources (magenta for the bipolar PN). The SA signal does not reveal an offset for the true point source, but these are unveiled for the bipolar PN after the SA analysis. In the latter, an antisymmetric SA signature arises because the velocity shifts of the approaching and receding lobes are correlated with their location at both sides of the adjacent central star continuum. |
These results illustrate the need for high-resolution IR and radio observations. MIDI-VLTI and AMBER-VLTI have achieved super-spatial resolutions, but these interferometric observations are challenging and time consuming. Furthermore, the interpretation of the few available baselines, which are not always suitably aligned with the orientation of the source on the sky, is strongly dependent on models. Finally, the sensitivity of these observations is limited.
An alternative to overcome the difficulties of VLTI observations are high-resolution spectro-astrometric (SA) studies. This observational technique has proven its efficiency in the search for close binaries (Bailey 1998; Takami et al. 2001), disks around B[e] stars (Oudmaijer et al. 2008), jets launched by brown dwarfs (Whelan et al. 2005), and proto-planetary disks (Pontoppidan et al. 2008, 2011). In the latter, Keplerian disks traced by the CO rovibrational fundamental band at 4.7 μm with sizes in the range of 60–180 mas (Pontoppidan et al. 2008) have been detected using CRIRES-VLT (Käufl et al. 2004). This instrumental setup overcomes previous attempts to use this technique with optical data that lack the spatial resolution to unveil small-sized nebular components (e.g. HM Sagittae nova and the young PNe Vy 2-2, Solf 1984; Miranda & Solf 1991). Compared with spectro-astrometry at optical wavelengths, the IR observations are less affected by extinction. The resolved scales suggest compact objects that are hence less sensitive to local extinction. This fact maybe a decisive advantage of IR spectro-astrometry when it comes to reconstruct source geometries from the spectro-astrometric signatures. Therefore, CRIRES high-resolution SA observations can open a new window in the search for compact structures in which high spatial resolution is crucial.
In this work we explore the SA capabilities of CRIRES for detecting and analyzing disk-like structures and small-scale asymmetrical features in objects in their transition to PNe. In Sect. 2 we describe the SA technique at high-resolution and the CRIRES commissioning observations used in this exploratory program. Preliminary results are described in Sect. 3 and a short summary is presented in Sect. 4.
2. CRIRES high-resolution spectro-astrometry
The SA technique takes advantage of high-resolution spectral observations to recover spatial details at mas scales by adopting the stellar continuum adjacent to a spectral feature as an astrometric reference. By using a low-order adaptive optics module, CRIRES allows one to push the spatial resolution limit while rejecting artifacts that have been reported from the applications of the SA technique to seeing-limited data. The SA technique is very attractive because it can be used to retrieve spatial information on scales that normally require interferometric observations, but here can be obtained using a single telescope with a standard instrumental setup.
The SA technique is illustrated in Fig. 1 for a point source (a star) and a compact bipolar PN with its major axis tilted with respect to the observer. Both sources are blurred by the diffraction of the telescope, optical imperfections of the system, and residual seeing, and appear unresolved according to the Rayleigh criterion, but the information of small-sized bipolar lobes is embedded within the dispersed spectrum. The SA analysis can trace the centroid of the signal along the spatial axis (xv) of the two-dimensional spectrum as a function of the radial velocity (vi). The accuracy to trace this centroid will depend on the S/N, which determines the PSF fitting precision. The centroid at each velocity is determined by fitting a Gaussian function to the spatial intensity profile as such a function is a reasonable approximation to the point spread function (PSF) along the spatial direction of a dispersed spectrum (Stone 1989). When the centroid at a certain velocity (xvi) is computed for all velocities in the wavelength range (va) of interest, the variations of the spatial position of the centroid as a function of the velocity can be traced without the dilution caused by diffraction, optical imperfections, and seeing.
The true spatial offset of a line may be more extended than measured because of drag induced on its centroid by the continuum emission. The drag depends on the relative intensities of line and continuum. In this work we adopted the formulation of Pontoppidan et al. (2008) to derive and correct for these effects on the SA signature, such that the corrected offset is computed as  (1)where ΔXvi is the corrected offset, Δxvi is the offset measured by the Gaussian fitting, and Fc and Fl are the continuum and line fluxes, respectively. We refer to ΔXvi as the SA signature.
When the signal-to-noise ratio in the spectrum is high enough, the original spatial structure produces an SA signature. This signature varies with the slit orientation: a physical structure tilted with respect to the plane of the sky and aligned along the slit results in maximal SA signature, but a minimal or no signature if oriented across the slit. A true point source shows an SA signature with no spatial offsets, independently of the orientation of the slit on the sky. Conversely, a bipolar PN will show an antisymmetric SA signature because its spectral signatures (the emission line from the approaching and receding lobes) are correlated with spatial coordinates.
The SA technique can reveal spatial structures with angular sizes down to small fractions of a pixel, on scales typically as small as 1/100th of the telescope diffraction pattern. We recall, however, that this technique does not produce direct images of a source; only after spatio-kinematically modeling several slit positions can a given source geometry be favored. If there is not enough information, the spatio-kinematical modeling may result in solutions that are not unique.
3. Observations, data reduction, and analysis
We used CRIRES commissioning data to search for mas structures in sources in their transition towards the PN phase. CRIRES operates in the near-IR, from 1 to 5 μm, offering the possibility of studying ionized and molecular material as well as the dust features already present in the near-IR L-band. CRIRES can reach a spectral resolution of ~100 000 when the 0 2 slit width and the adaptive optic (AO) module are used.
The proto-PN IRAS 17516−2525 and the young PN SwSt 1 were observed on June 11, 2006, and June 5, 2006, respectively. The observations were taken with the AO loop closed and the 02 slit width. The slit was oriented along a PA of 0°, and two nodding positions were used, with exposure times of 120 s. The observational template AutoNodOnSlit with a small nodding throw ~10″, commonly used for compact sources, was used for IRAS 17516−2525. The observational template Generic with a large nodding throw >25″, ideal for extended sources, was used for SwSt 1. The data were registered by a 4 × 1 mosaic of Raytheon 1024 × 1024 pixel InSb Aladin III detectors with pixel size of 27 μm. The detector readout mode was FowlerNsamp. The observations covered the spectral range 2.115–2.168 μm.
The data were reduced using standard IRAF procedures for long-slit spectra. Self-developed IDL programs were used to complete the necessary corrections. The combined spectra were corrected for telluric absorptions using the spectro-photometric standard stars HR 5985 for IRAS 17516−2525 and HR 7933 for SwSt 1. The spatial resolution before the SA analysis, as derived from the full width at half maximum (FWHM) of the stellar continuum, was 0.̋44 for the Brγ line of IRAS 17516−2525, and 0.̋70 and 0.̋66 for the Brγ and [Fe iii] lines of SwSt 1. We note that CRIRES was not optimally focused during this first commissioning run.
The combined spectra used for SA analyses were corrected for detector misalignment at mas scales that might affect the signatures obtained by fitting the continuum position using a second-order polynomial fit for SwSt 1 and a third-order polynomial fit for IRAS 17516-2525. The centroid along the slit (spatial) direction was derived at each wavelength around lines of interest by fitting a Gaussian profile to the spatial intensity profile obtained in small apertures of 2 × 60 pixel2 ≡ 3 km s-1 × 5.̋16. Additional IDL programs were written to perform the SA analysis. It is important to mention that even though the observations presented here were not specifically tailored to this purpose, they have allowed us to develop the methodology and programing tools to apply the SA technique to search for mas structures in proto-PNe and young PNe.
4. Spectro-astrometric preliminary results
IRAS 17516−2525 has been classified as a proto-PN, although its morphology has not been revealed yet; the source appears to be compact in near-IR images (1″ in size, Ramos-Larios et al. 2009, 2012) and is not resolved in the mid-IR imaging catalog of post-AGB stars presented by Lagadec et al. (2011), despite the nearly diffracted angular resolution of these images. The spectroscopic study of Sánchez-Contreras et al. (2008) found a P-Cygni profile in the Hα line, but the Pa lines do not show this profile. We selected the Brγλ2.160 μm line detected in the CRIRES (Fig. 2) spectrum to carry out the SA analysis. A preliminary inspection revealed that the line profile appears broad and single peaked. The SA analysis shows a compact antisymmetric position-velocity (PV) pattern extending ~ 12 ± 5 mas in size (ΔV ~ 80 km s-1). Although this SA signature is reminiscent of those interpreted by Pontoppidan et al. (2008) as protoplanetary disks, a disk rotating at this speed would require a gravitational potential unfeasible for a proto-PN. Small-sized bipolar lobes arising from the central regions of this source provide a more likely interpretation for this SA signature.
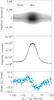 |
Fig. 2 PV map (top), line profile (middle), and SA signature (bottom) of the Brγ λ2.160 μm line of IRAS 17516−2525. Gray levels in the PV map are in intervals of 10% and start at 20% on the intensity peak. The dashed line in the top and bottom panels marks the centroid of the continuum emission. |
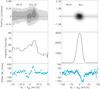 |
Fig. 3 PV map (top), line profile (middle), and SA signature (bottom) of the [Fe iii] λ2.14 μm (left) and Brγ λ2.160 μm (right) lines of SwSt 1. The SA signal for the two lines are basically reversed, suggesting that they trace different nebular components. Gray levels in the PV map of the [Fe iii] line are at 15%, 20%, and 30% of the intensity peak: gray levels in the PV map of the Brγ line start at 2% of the intensity peak in steps of 10%. The dashed line at the top and bottom panels mark the centroid of the continuum emission. |
The source SwSt 1 is a compact PN with a C-rich central star. Spectroscopic studies have found P-Cygni profiles in the C iiiλ4650 Å and C ivλ5801 Å lines, but these are absent in the Hα, Hβ, and Hδ lines (De Marco et al. 2001). The morphology of SwSt 1 is not fully resolved in HST images (De Marco et al. 2001), but they suggest a compact, ~2″ toroidal structure elongated in the east-west direction and likely tilted by 30° with respect to the plane of the sky. In near-IR K-band (Likkel et al. 2006) and far-UV (Sterling et al. 2005) observations, SwSt 1 shows high iron abundances and inhomogeneities in the dust-to-gas ratio across the nebula.
The PV plots of the [Fe iii] λ2.145 μm and Brγ λ2.160 μm (Fig. 3) show a certain asymmetry, particularly the [Fe iii] line. The SA analysis reveals antisymmetric PV features ~ 230 ± 29 mas in size (ΔV ≈ 22 km s-1) in the [Fe iii] line and ~ 130 ± 21 mas in size in the Brγ line (ΔV ≈ 50 km s-1). In addition to the different sizes, there is an obvious change in the shape and orientation of the signatures. This is reminiscent of sources in which distinct structural components with varying physical conditions are traced by different emission lines, such as the young PN Hb 12 (Welch et al. 1999) and the proto-PN CRL 2688 (Sahai et al. 1998). We argue that in SwSt 1 the [Fe iii] line (IP = 30.7 eV) arises from discrete locations in the nebula where the higher density and temperature conditions enhance its emissivity (Bautista & Pradhan 1998; Zhang et al. 2012), whereas the location of the Brγ line (IP = 13.6 eV) is less constrained and very likely affected by projection effects, which results in the detection of smaller offsets.
5. Summary
Using long-slit high-resolution spectra, the SA technique enables us to resolve small-sized structures in different astronomical objects. Inspired by these results, we investigated the use of this technique in the search for structures at mas scales at the innermost regions of sources in the transition from the AGB to the PN phase. For this purpose, we used CRIRES commissioning data of the proto-PN IRAS 17516−2525 and the young PN SwSt 1 to develop the methodology and tools to perform such SA analyses.
Our SA analysis detected a small-sized structure, ~12 mas in size, in IRAS 17516−2525 that can be interpreted as small bipolar lobes. For SwSt 1, the SA analysis shows two structures with different sizes, ~130–230 mas, and inclinations in the [Fe iii] and Brγ lines. Tailored SA observations at different PAs with its corresponding calibrations and a proper model fitting are mandatory to derive a conclusive interpretation of the SA signatures.
Remarkably, the SA analysis based on CRIRES commissioning data has been able to detect structures that are similar in size to those resolved by MIDI-VLTI in Mz 3 and M 2-9, and more compact than those detected in AFGL 915 with radio-interferometric observations at Plateau de Bure. Compared with MIDI-VLTI, CRIRES SA observations are more sensitive, not restricted by fixed baselines, and the data interpretation is less model dependent. We conclude that the SA technique is very suitable for the search of small-sized disks and asymmetric structures in the short transition from the AGB to the PN phase.
Acknowledgments
M.W.B.C. and M.A.G. are supported by the Spanish MICINN (Ministerio de Ciencia e Innovación) grant AYA 2011-29754-C03-02, and LFM by grant AYA 2011-30228-C03-01, both co-funded with FEDER funds. M.W.B.C. would like to thank the EEBB-FPI for the grant for the short-term stay in 2012, and thanks the European Southern Observatory (ESO) Headquarters in Garching, Germany, for all the facilities provided during her stay. We thank X. Fang for helpful discussion on the excitation of the [Fe iii] λ2.14 μm in PNe. We appreciate the valuable feedback and comments of the anonymous referee that improved this Research Note.
References
- Bailey, J. 1998, MNRAS, 301, 161 [NASA ADS] [CrossRef] [Google Scholar]
- Balick, B., & Frank, A. 2002, ARA&A, 40, 439 [NASA ADS] [CrossRef] [Google Scholar]
- Bautista, M. A., & Pradhan, A. K. 1998, ApJ, 492, 650 [NASA ADS] [CrossRef] [Google Scholar]
- Blanco Cárdenas, M. W., Guerrero, M. A., Ramos-Larios, G., et al. 2013, A&A, 551, A64 [NASA ADS] [CrossRef] [EDP Sciences] [Google Scholar]
- Bujarrabal, V., Castro-Carrizo, A., Alcolea, J., & Neri, R. 2005, A&A, 441, 1031 [NASA ADS] [CrossRef] [EDP Sciences] [Google Scholar]
- Chesneau, O., Lykou, F., Balick, B., et al. 2007, A&A, 473, L29 [NASA ADS] [CrossRef] [EDP Sciences] [Google Scholar]
- Coffey, D., Bacciotti, F., Podio, L., & Nisini, B. 2010, ApJ, 719, 505 [NASA ADS] [CrossRef] [Google Scholar]
- De Marco, O. 2009, PASP, 121, 316 [NASA ADS] [CrossRef] [Google Scholar]
- De Marco, O., Crowther, P. A., Barlow, M. J., Clayton, G. C., & de Koter, A. 2001, MNRAS, 328, 527 [NASA ADS] [CrossRef] [Google Scholar]
- García-Segura, G., López, J. A., & Franco, J. 2005, ApJ, 618, 919 [NASA ADS] [CrossRef] [Google Scholar]
- Kaeufl, H.-U., Ballester, P., Biereichel, P., et al. 2004, Proc. SPIE, 5492, 1218 [CrossRef] [Google Scholar]
- Lagadec, E., Verhoelst, T., Mékarnia, D., et al. 2011, MNRAS, 417, 32 [NASA ADS] [CrossRef] [Google Scholar]
- Likkel, L., Dinerstein, H. L., Lester, D. F., Kindt, A., & Bartig, K. 2006, AJ, 131, 1515 [NASA ADS] [CrossRef] [Google Scholar]
- Lykou, F., Chesneau, O., Zijlstra, A. A., et al. 2011, A&A, 527, A105 [NASA ADS] [CrossRef] [EDP Sciences] [Google Scholar]
- Miranda, L. F., & Solf, J. 1991, A&A, 252, 331 [NASA ADS] [Google Scholar]
- Miranda, L. F., Gómez, Y., Anglada, G., & Torrelles, J. M. 2001, Nature, 414, 284 [NASA ADS] [CrossRef] [PubMed] [Google Scholar]
- Oudmaijer, R. D., Parr, A. M., Baines, D., & Porter, J. M. 2008, A&A, 489, 627 [NASA ADS] [CrossRef] [EDP Sciences] [Google Scholar]
- Pontoppidan, K. M., Blake, G. A., van Dishoeck, E. F., et al. 2008, ApJ, 684, 1323 [NASA ADS] [CrossRef] [Google Scholar]
- Pontoppidan, K. M., Blake, G. A., & Smette, A. 2011, ApJ, 733, 84 [NASA ADS] [CrossRef] [Google Scholar]
- Ramos-Larios, G., Guerrero, M. A., Suárez, O., Miranda, L. F., & Gómez, J. F. 2009, A&A, 501, 1207 [NASA ADS] [CrossRef] [EDP Sciences] [Google Scholar]
- Ramos-Larios, G., Guerrero, M. A., Suárez, O., Miranda, L. F., & Gómez, J. F. 2012, A&A, 545, A20 [NASA ADS] [CrossRef] [EDP Sciences] [Google Scholar]
- Sahai, R., Hines, D. C., Kastner, J. H., et al. 1998, ApJ, 492, L163 [NASA ADS] [CrossRef] [Google Scholar]
- Sahai, R., Morris, M., Sánchez Contreras, C., & Claussen, M. 2007, AJ, 134, 2200 [NASA ADS] [CrossRef] [Google Scholar]
- Sánchez Contreras, C., Sahai, R., Gil de Paz, A., & Goodrich, R. 2008, ApJS, 179, 166 [NASA ADS] [CrossRef] [Google Scholar]
- Soker, N. 1998, MNRAS, 299, 1242 [NASA ADS] [CrossRef] [Google Scholar]
- Solf, J. 1984, A&A, 139, 296 [NASA ADS] [Google Scholar]
- Sterling, N. C., Dinerstein, H. L., Bowers, C. W., & Redfield, S. 2005, ApJ, 625, 368 [NASA ADS] [CrossRef] [Google Scholar]
- Stone, R. C. 1989, AJ, 97, 1227 [NASA ADS] [CrossRef] [Google Scholar]
- Suárez, O., Gómez, J. F., Miranda, L. F., et al. 2009, A&A, 505, 217 [NASA ADS] [CrossRef] [EDP Sciences] [Google Scholar]
- Suárez, O., Lagadec, E., Bendjoya, P., et al. 2011, Asymmetric Planetary Nebulae 5 Conference, 7 [Google Scholar]
- Takami, M., Bailey, J., Gledhill, T. M., Chrysostomou, A., & Hough, J. H. 2001, MNRAS, 323, 177 [NASA ADS] [CrossRef] [Google Scholar]
- Uscanga, L., Gómez, Y., Raga, A. C., et al. 2008, MNRAS, 390, 1127 [NASA ADS] [CrossRef] [Google Scholar]
- Verhoelst, T., Waters, L. B. F. M., Verhoeff, A., et al. 2009, A&A, 503, 837 [NASA ADS] [CrossRef] [EDP Sciences] [Google Scholar]
- Whelan, E., & Garcia, P. 2008, in Jets from Young Stars II, Lect. Notes Phys., 742, 123 [NASA ADS] [CrossRef] [Google Scholar]
- Whelan, E. T., Ray, T. P., Bacciotti, F., et al. 2005, Nature, 435, 652 [NASA ADS] [CrossRef] [PubMed] [Google Scholar]
- Welch, C. A., Frank, A., Pipher, J. L., Forrest, W. J., & Woodward, C. E. 1999, ApJ, 522, L69 [NASA ADS] [CrossRef] [Google Scholar]
- Zhang, Y., Fang, X., Chau, W., et al. 2012, ApJ, 754, 28 [NASA ADS] [CrossRef] [Google Scholar]
All Figures
|
Fig. 1 Sketch of the SA technique (adapted from Whelan & Garcia 2008) showing the analysis of the long-slit spectra of a point source (top) and a compact bipolar PN (bottom). The major axis of the bipolar PN is assumed to be tilted with respect to the observer, with one lobe approaching (blue) and the other receding (red). The observation conditions smear out both sources into objects resembling unresolved point sources (magenta for the bipolar PN). The SA signal does not reveal an offset for the true point source, but these are unveiled for the bipolar PN after the SA analysis. In the latter, an antisymmetric SA signature arises because the velocity shifts of the approaching and receding lobes are correlated with their location at both sides of the adjacent central star continuum. |
| In the text | |
|
Fig. 2 PV map (top), line profile (middle), and SA signature (bottom) of the Brγ λ2.160 μm line of IRAS 17516−2525. Gray levels in the PV map are in intervals of 10% and start at 20% on the intensity peak. The dashed line in the top and bottom panels marks the centroid of the continuum emission. |
| In the text | |
|
Fig. 3 PV map (top), line profile (middle), and SA signature (bottom) of the [Fe iii] λ2.14 μm (left) and Brγ λ2.160 μm (right) lines of SwSt 1. The SA signal for the two lines are basically reversed, suggesting that they trace different nebular components. Gray levels in the PV map of the [Fe iii] line are at 15%, 20%, and 30% of the intensity peak: gray levels in the PV map of the Brγ line start at 2% of the intensity peak in steps of 10%. The dashed line at the top and bottom panels mark the centroid of the continuum emission. |
| In the text | |
Current usage metrics show cumulative count of Article Views (full-text article views including HTML views, PDF and ePub downloads, according to the available data) and Abstracts Views on Vision4Press platform.
Data correspond to usage on the plateform after 2015. The current usage metrics is available 48-96 hours after online publication and is updated daily on week days.
Initial download of the metrics may take a while.