Fig. 3
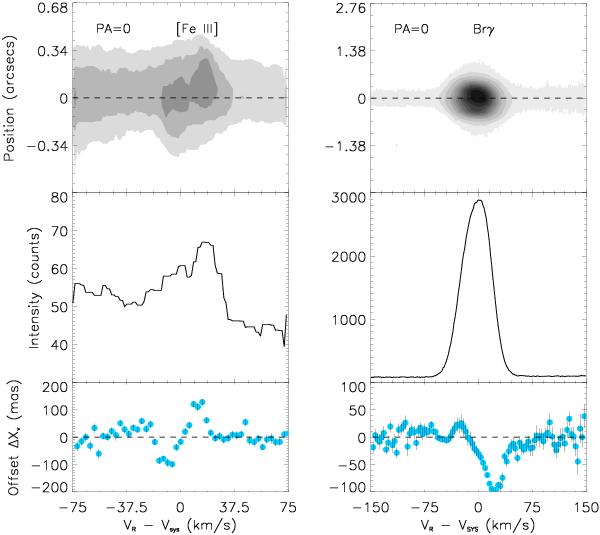
PV map (top), line profile (middle), and SA signature (bottom) of the [Fe iii] λ2.14 μm (left) and Brγ λ2.160 μm (right) lines of SwSt 1. The SA signal for the two lines are basically reversed, suggesting that they trace different nebular components. Gray levels in the PV map of the [Fe iii] line are at 15%, 20%, and 30% of the intensity peak: gray levels in the PV map of the Brγ line start at 2% of the intensity peak in steps of 10%. The dashed line at the top and bottom panels mark the centroid of the continuum emission.
Current usage metrics show cumulative count of Article Views (full-text article views including HTML views, PDF and ePub downloads, according to the available data) and Abstracts Views on Vision4Press platform.
Data correspond to usage on the plateform after 2015. The current usage metrics is available 48-96 hours after online publication and is updated daily on week days.
Initial download of the metrics may take a while.