Fig. 1
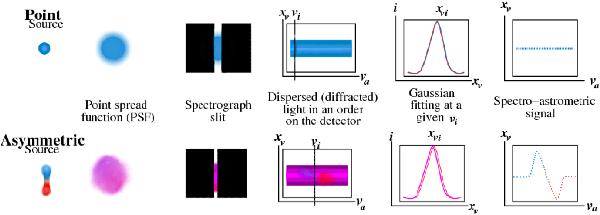
Sketch of the SA technique (adapted from Whelan & Garcia 2008) showing the analysis of the long-slit spectra of a point source (top) and a compact bipolar PN (bottom). The major axis of the bipolar PN is assumed to be tilted with respect to the observer, with one lobe approaching (blue) and the other receding (red). The observation conditions smear out both sources into objects resembling unresolved point sources (magenta for the bipolar PN). The SA signal does not reveal an offset for the true point source, but these are unveiled for the bipolar PN after the SA analysis. In the latter, an antisymmetric SA signature arises because the velocity shifts of the approaching and receding lobes are correlated with their location at both sides of the adjacent central star continuum.
Current usage metrics show cumulative count of Article Views (full-text article views including HTML views, PDF and ePub downloads, according to the available data) and Abstracts Views on Vision4Press platform.
Data correspond to usage on the plateform after 2015. The current usage metrics is available 48-96 hours after online publication and is updated daily on week days.
Initial download of the metrics may take a while.