| Issue |
A&A
Volume 547, November 2012
|
|
|---|---|---|
| Article Number | L3 | |
| Number of page(s) | 5 | |
| Section | Letters | |
| DOI | https://doi.org/10.1051/0004-6361/201220330 | |
| Published online | 07 November 2012 | |
ALMA and VLA observations of recombination lines and continuum toward the Becklin-Neugebauer object in Orion⋆
1 European Southern Observatory, Karl-Schwarzschild-Str. 2, 85748 Garching, Germany
e-mail: rgalvan@eso.org
2 Centro de Radioastronomía y Astrofísica, Universidad Nacional Autónoma de Mexico, 58090 Morelia, Mexico
3 Astronomy Department, Faculty of Science, King Abdulaziz University, PO Box 80203, 21589 Jeddah, Saudi Arabia
Received: 3 September 2012
Accepted: 4 October 2012
Compared to their centimeter-wavelength counterparts, millimeter recombination lines (RLs) are intrinsically brighter and are free of pressure broadening. We report observations of RLs (H30α at 231.9 GHz, H53α at 42.9 GHz) and the millimeter and centimeter continuum toward the Becklin-Neugebauer (BN) object in Orion, obtained from the Atacama Large Millimeter/submillimeter Array (ALMA) science verification archive and the Very Large Array (VLA). The RL emission appears to be arising from the slowly-moving, dense (Ne = 8.4 × 106 cm-3) base of the ionized envelope around BN. This ionized gas has a relatively low electron temperature (Te < 4900 K) and small (≪ 10 km s-1) bulk motions. Comparing our continuum measurements with previous (non)detections, it is possible that BN has large flux variations in the millimeter. However, dedicated observations with a uniform setup are needed to confirm this. From the H30α line, the central line-of-sight LSR velocity of BN is 26.3 km s-1.
Key words: stars: massive / HII regions / radio continuum: ISM / radio lines: ISM
Appendices are available in electronic form at http://www.aanda.org
© ESO, 2012
1. Introduction
Understanding the nature of the radio sources in the Orion BN/KL region is important because these sources exhibit significant diverging proper motions that may trace the recent (~500 yr ago) disintegration of a compact cluster of young massive stars (Rodríguez et al. 2005; Gómez et al. 2008; Goddi et al. 2011b). This past interaction may also have caused the explosive outflow seen in vibrationally-excited H2 and CO lines (Zapata et al. 2009; Bally et al. 2011; Nissen et al. 2012).
In particular, observing hydrogen recombination lines (RLs) can be used to obtain the line-of-sight velocities of the radio sources, which are needed to complement the proper-motion information. Millimeter (mm) RLs are in principle better suited to giving the central velocity of the system because they are more optically thin, much less pressure broadened, and intrinsically brighter than centimeter (cm) lines (e.g., Gordon & Sorochenko 2002; Peters et al. 2012). However, longer wavelength lines are a valuable complement because they are sensitive to the gas density. By observing multiple RL transitions, hints to the structure of the ionized nebula can be obtained even in unresolved observations (Keto et al. 2008; Galván-Madrid et al. 2009).
In this paper we report our findings in the recently released science verification (SV) data taken toward Orion BN/KL with the Atacama Large Millimeter/submillimeter Array (ALMA). We also report on previous RL observations obtained with the Very Large Array (VLA), as well as on the continuum obtained with both interferometers.
2. Data
Orion BN/KL was observed on January 19, 2012 with ALMA as part of the SV program. In this paper we make use of the fully calibrated visibilities released on April 12, 2012. The data consisted of 20 different spectral windows covering the frequency range from 213.72 GHz to 246.62 GHz. Each spectral window had a uniform spectral resolution of 0.488 MHz (~0.6 km s-1) and was observed for an on-source time of ~15 min. The array used 16 12-m antennas in a compact configuration with baselines in the range of 15 kλ to 269 kλ. The pointing center was  ,
,  .
.
The absolute amplitude scale was derived from observations of Callisto and Mars. The phase calibrator was J0607–085. We imaged the phase calibrator and measured a flux density of S = 1.40 Jy. The SMA data base1 reports flux densities for J0607–085 within ten days of the ALMA observation: S09 Jan. 2012 = 1.25 ± 0.06 Jy, S27 Jan. 2012 = 1.37 ± 0.07 Jy. From this, we estimate that the amplitude scale of the ALMA observations is accurate to ~10%. The processing was done in CASA versions 3.3.0 and 3.4.0.
We also present archival Very Large Array2 (VLA) data. The H53α (ν0 = 42.95197 GHz) B-array observations have been previously presented by Rodríguez et al. (2009) (project AR635).
Finally, several epochs of continuum observations at 8.4 GHz in the A configuration were processed using standard methods in the AIPS software. In all epochs 1331+305 was used as amplitude calibrator with an adopted flux density of 5.21 Jy. The epochs, project codes, phase calibrators, and their bootstrapped flux densities are given in Table 1.
VLA calibrators at 8.4 GHz.
3. Results
Continuum subtraction was done in the u-v domain by carefully selecting the line-free channels in each spectral window and fitting a linear spectral baseline. Continuum images from different spectral windows are consistent with each other, indicating a low contamination from unaccounted line emission.
All the spectral windows were imaged with a threefold purpose: to detect the H30α RL in the BN/KL radio sources (I, BN, and n), to detect molecular emission from BN, and to make a continuum image. Whereas we succeeded in detecting the RL in BN, it was not detected elsewhere. Also, no molecular emission was detected from BN. We present maps that have not been corrected for primary beam attenuation. The corrected fluxes are quoted in the text and tables.
3.1. Continuum
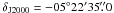
The low declination of Orion BN/KL, as well as the bright, extended emission dominated by the “hot core” (HC), limit the dynamic range of synthesis imaging and complicate the detection of weak sources in this field at (sub)mm wavelengths. Figure 1 shows a deep continuum image from the ALMA data obtained by co-adding the line-free continuum visibilities from all spectral windows. The average frequency (wavelength) in this map is 230.17 GHz (1.30 mm). The dynamic range in this image is determined by limitations in the u-v coverage, and it is in the range of ~10 to 15 mJy. Our continuum map is ~× 2 deeper than the released continuum image3, and similar in quality to the CARMA 1.3-mm map reported by Friedel & Snyder (2008).
The centimeter radio source I (Reid et al. 2007; Goddi et al. 2011b) is only ~ from the 1.3-mm peak of the HC, which has an extension of ~
 (see Fig. 1). Therefore, the continuum emission of source I cannot be resolved from the HC in arcsecond-resolution images (e.g., Beuther et al. 2005; Goddi et al. 2011a). The BN object, as traced by its cm continuum, is ~
 from the hot-core continuum peak. In the map shown in Fig. 1 we detect BN with a peak intensity of 55 mJy beam-1 (112 mJy beam-1 when primary beam attenuation is taken into account). However, it is still at the intensity level of some of the extended emission.
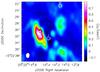 |
Fig. 1 Continuum ALMA image centered at 230.17 GHz (1.3 mm) of the Orion BN/KL region. The centimeter sources I, BN, and n are marked with circles. The emission is dominated by the bright, extended emission from the Orion “Hot Core”, with a peak intensity of 834 mJy beam-1. The rms noise is σ ~ 10 to 15 mJy. The half-power beam width (HPBW) is |

To disentangle the compact continuum emission from the extended emission in the field, we made cleaned maps after removing the short baselines. This degradation of the u-v coverage produces artifacts (closely-spaced sidelobes) close to source I and the HC, and we refrained from using this part of the image. However, at the position of BN, where emission is fainter, the restricted u-v coverage effectively removes the extended emission around BN. We found that a minimum baseline length of ≈ 100 kλ gives optimal results, filtering out the emission on scales > . Figure 2 shows this continuum map around BN. The noise is × 5 lower than in Fig. 1 (~3 mJy). The 1.3-mm flux density of BN in this image is 62 mJy. After primary beam correction, the flux density of BN is S1.3 mm = 126 mJy. We note that the flux density for BN is the same, within 20%, regardless of the u-v coverage restriction applied. A faint compact source with primary beam corrected flux S1.3 mm = 26 mJy is also detected
  south of BN. This newly detected source is possibly associated with the extended mid-infrared sources IRc6 and IRc6 N (Shuping et al. 2004).
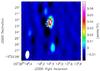 |
Fig. 2 Continuum ALMA image centered at 231.17 GHz (1.3-mm) of the compact emission of the BN object. Only baselines with length B > 100 kλ were used to filter out the extended emission in the field. The BN object is detected as an unresolved source with flux density of 62 mJy. The rms noise around BN in this map is σ ~ 3 mJy. |

It is possible that BN is variable in the (sub)mm continuum. While our detection of BN is consistent with the 218 GHz flux of S = 150 ± 50 mJy (from OVRO observations in 1993 and 1994) reported by Plambeck et al. (1995) and Blake et al. (1996), Friedel & Snyder (2008) do not detect BN at 231 GHz down to a 3σ level of ~34 mJy (CARMA observations in 2007). However, the significance of these variations can be affected by the inhomogeneity of the mm observations. We have reprocessed three epochs of VLA archival data at 3.6 cm (8.4 GHz) to look for possible variations in the continuum emission from BN. Table 2 lists the measured 3.6-cm fluxes, together with the four epochs reported by Zapata et al. (2004), also at 3.6 cm, and the available 1-mm band measurements. Based on this data set, the 3.6-cm flux is quite stable (within 30% of the maximum value).
BN fluxes.
3.2. Recombination lines
We report the first detection of mm RL emission toward the BN object. We also searched for H30α emission in the rest of the Orion BN/KL field, in particular from sources I and n, without success. Just as with the continuum, the proximity of source I to the HC contaminates any emission from the relatively faint RL with brighter, more extended molecular lines with rest frequencies within a few MHz of the H30α line. Figure 3 shows the H30α and the H53α (data originally presented in Rodríguez et al. 2009) spectra toward BN. The line parameters are summarized in Table 3. Figure 4 shows the velocity-integrated intensity maps (moment 0) for both lines. Similar to the mm continuum, the H30α map uses only baselines with length >100 kλ4.
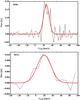 |
Fig. 3 Hydrogen recombination line spectra (gray) and Gaussian fits (red) toward BN. The top panel shows the H30α line observed with ALMA. The flux is corrected by primary beam attenuation. The bottom panel shows the H53α line observed with the VLA. The channel widths are 2.0 km s-1 and 10.9 km s-1, respectively. |
Recombination line parameters.
The H30α line is narrower than the H53α line, and it is redshifted by a few km s-1. This behavior has been observed in hypercompact HII regions around embedded young massive stars (Keto et al. 2008; Galván-Madrid et al. 2009). Although BN is not deeply embedded in molecular gas, the same interpretation seems to apply: that the difference in linewidth is caused by the action of “pressure” broadening from particle collisions in the low-frequency line, whereas the velocity differences are caused by optical depth effects. In an outflowing gas where the denser part is closer to the central star, the optically thinner, higher frequency line will trace the centermost gas from both the front and the back sides of the nebula. In contrast, the optically thicker, lower frequency line, will trace gas farther away from the central star, mainly from the front (blueshifted) side of the nebula (see Keto et al. 2008). Therefore, the H30α line should give a better estimation of the line-of-sight velocity of the star inside the BN nebula, vLSR(BN) = 26.3 ± 0.5 km s-1.
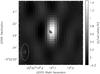 |
Fig. 4 Maps of the velocity-integrated (moment 0) emission of the recombination lines. The color scale shows the H30α line observed with ALMA ( |


The total RL width (Δv) has contributions from thermal broadening (Δvth), dynamical broadening from macroscopic gas motions (Δvdy), and pressure broadening (Δvpr). We elaborate this aspect in Appendix A. The line FWHM of the combined profile is given by (Eq. (2) of Galván-Madrid et al. 2009):  (1)The H30α line is only broadened thermally and by dynamical motions (Δvpr < 0.6 km s-1 from Eq. (A.4)). Also, in the BN object this line appears to be too narrow (15.4 km s-1) even for pure thermal broadening at Te = 104 K (Eq. (A.2)). Therefore, for the gas traced by the H30α line, Te is at most 4900 K, and the bulk gas motions are constrained to be much smaller than the thermal width. Finally, using Eq. (3) of Keto et al. (2008), the average electron density traced by these RLs is Ne = 8.4 × 106 cm-3.
Non-LTE effects and dust opacity may play a role for (sub)mm RLs. In Appendix B we show that the RLs in BN are reasonably close to LTE and that it is possible that dust in the line-of-sight makes a considerable contribution to the 1.3-mm continuum.
4. Discussion
One possible explanation for the differences in the mm fluxes that have been reported for BN is that they are, at least partially, caused by systematic errors in the measurements. All the compiled cm fluxes are measured with the VLA A-array, which has an absolute flux-scale uncertainty of a few percent, while the flux scale of mm interferometers is known to be only accurate to within ~10%5. Differences in u-v coverage may also mimic flux variations, but since the continuum emission from BN is less than one arcsecond in size, this effect should not be important. Indeed, the flux that we recover from BN is the same within ~20% for different u-v restrictions (see Sect. 3.1). Alternatively, if BN is variable in the mm, it could be caused by the sudden recombination of dense gas (the timescale of which is ~1 month for densities Ne ~ 106 cm-3, Osterbrock 1989). We emphasize that only dedicated multiepoch observations with a uniform setup can clarify this issue.
The BN object is known to be a young star with a mass M⋆ ≈ 10 M⊙ (Rodríguez et al. 2005). In the absence of other forces (e.g., wind acceleration mechanisms), this mass is enough to gravitationally confine ionized hydrogen within a radius of ≈ 55 AU (see Keto 2007). If the H30α is emitted within a volume as small as the radio continuum (radius ~25 AU, Rodríguez et al. 2009), this could explain the lack of bulk motions in this RL. The H53α line appears to be tracing gas that is outflowing toward us with a velocity ~6.5 km s-1 blueshifted with respect to the systemic. Infrared and optical RLs have also been detected toward BN and extend to velocities >100 km s-1 (Scoville et al. 1983). However, these RLs are significantly affected by obscuration and non-LTE effects, so they may trace gas from a different volume than the radio and (sub)mm RLs.
5. Conclusions
We report the first detection of 1.3 mm RL (H30α) emission toward Orion from the BN object. The mm RL appears to be arising from the dense (Ne = 8.4 × 106 cm-3), static (bulk motions ≪ 10 km s-1) base of the ionized nebula around the central
massive star in BN, whose line-of-sight LSR velocity is now estimated to be vLSR(BN) = 26.3 ± 0.5 km s-1. Compared to the H30α line, the optically thicker H53α seems to trace gas outflowing toward us at ~6.5 km s-1.
Dedicated ALMA observations at subarcsecond resolution would be able to detect RL emission from the rest of the Orion BN/KL sources, to obtain their 3D velocities by combining them with the available proper motion measurements, and to quantify their possible flux variations.
Online material
Appendix A: Linewidth of recombination lines
RLs are broadened by several mechanisms: a natural broadening from the quantum uncertainty ΔE of the energy level E, a thermal/microturbulence Gaussian broadening from the motions of the emitting particles and of parcels of gas that are much smaller than the beam, the Stark (or “pressure”) broadening from the perturbation of the atomic energy levels by the electric field of neighboring charged particles, and a dynamical broadening from bulk flows (e.g., infall, rotation, outflow) in the gas. A detailed discussion of these processes and the physics of RLs can be found in Gordon & Sorochenko (2002).
For n > 20 (where Hnα is a n + 1 → n transition), the natural linewidth in velocity units is  (A.1)where c is the speed of light. For H30α and H53α, ΔvN is 1.3 × 10⁻³ km s-1 and 0.5 × 10⁻³ km s-1, respectively. The natural broadening is negligible for radio and (sub)mm RLs.
The thermal distributions of velocities of both the individual particles and small pockets of gas (“microturbulence”) produce a Gaussian contribution to the broadening. Neglecting microturbulence, the thermal FWHM is  (A.2)where kB is the Boltzmann constant, mH is the hydrogen-atom mass, and it is assumed that all the gas is thermalized to the electron temperature Te. For a pure-hydrogen gas with Te = 9000 K, Δvth = 20.3 km s-1.
The pressure broadening has a Lorentzian shape, and it increases with density and quantum number. Collisions with ions and electrons make different contributions. The contribution from ions has the form (Gordon & Sorochenko 2002) 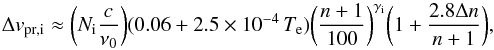 (A.3)where γi = 6−2.7 × 10⁻⁵ Te−0.13(n + 1)/100. For Te = 9000 K and Ni = 107 cm-3, the H30α line is virtually free from ion broadening (0.04 km s-1, and decreases close to linearly with decreasing Te), whereas the H53α line is broadened by 5.1 km s-1.
The collisions with electrons dominate the collisions with ions under most conditions. They produce a broadening of width (Smirnov et al. 1984): 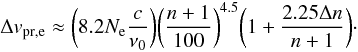 (A.4)For Ne = 107 cm-3, the electron broadenings for the H53α and H30α are ≈ 37.3 km s-1 and 0.6 km s-1, respectively.
Finally, the last source of broadening is bulk motions (Δvdy) of the ionized gas, which may be in the form of outflows/winds, infall/accretion, and/or rotation. For unresolved observations, the method outlined here permits estimating the magnitude of these motions from the nonthermal linewidth of the line that is free of pressure broadening. Of course, ideally one wishes to spatially resolve these motions. ALMA in its Cycle 1 is now able to resolve the ionized-gas motions in sources as faint as ~10 mJy at the line peak at subarcsecond resolution.
Including all the contributions to the broadening, the total linewidth will have a Voigt profile with FWHM given by Eq. (1) in the text.
Appendix B: Cm and (sub)mm recombination lines
Here we discuss the advantages and limitations that cm and (sub)mm RLs have compared to each other. The cm lines are intrinsically fainter and optically thicker, and can be partially absorbed by the relatively high continuum opacity at their wavelengths (see e.g., Wilson et al. 2009). A possible drawback of (sub)mm RLs is that the free-free continuum may be contaminated by dust emission. Another problem is that they are out of LTE more easily than cm lines, so their interpretation may require careful modeling (e.g., Jiménez-Serra et al. 2011; Peters et al. 2012). As shown below, our simple LTE interpretation seems to be reasonable, but it is possible that a significant fraction of the 1.3-mm continuum comes from dust in the line of sight.
Let bn be the ratio of the population of level n to its LTE population. Then the actual line absorption coefficient κL is related to the LTE coefficient κL,LTE by (Gordon & Sorochenko 2002) 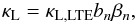 (B.1)with
 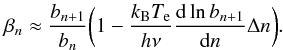 (B.2)While 0 < bn < 1 expresses the non-LTE level depopulation, βn can be negative when there are conditions for maser amplification.
In the optically-thin case (τC,1.3mm ~ 0.08 from the data), the non-LTE corrected line intensity IL is (Gordon & Sorochenko 2002)  (B.3)Using the tabulated values in the calculations of Walmsley (1990), b30 ≈ 0.98 and β30 ~−1.5 for a density Ne = 107 cm-3. Therefore, the intensity of the H30α line is only amplified by ~3%. The H53α is even closer to LTE, with b53 ≈ 0.999 and β53 ~ 0.5.
Sub(mm) RLs are more opticaly thin and intrinsically brighter than cm RLs. For a given Te and Ne, and in the Rayleigh-Jeans regime (hν ≪ kBTe), the line absorption coefficient decreases linearly with frequency κL ∝ ν-1, so the LTE line emission coefficient jL = κLBν(Te) ∝ ν. Similarly, the continuum absorption coefficient κC ∝ ν-2.1, so the LTE continuum emissivity jC ∝ ν-0.1. Therefore, in the optically thin regime, the line-to-continuum ratio increases almost linearly with frequency SLΔv/SC ∝ ν1.1. Under these assumptions, the expected ratio of the H30α to H53α line-to-continuum ratios is 6.4. However, the observed value is 1.6. If we assume that only ~32 mJy of the 1.3-mm continuum are due to free-free then the line-to-continuum ratio would increase to the expected value. This suggests that dust contributes a significant fraction to the (sub)mm continuum of BN. However, it is known (and we have confirmed this with the ALMA data set) that BN is not embedded in dense molecular gas. Therefore, it is unlikely that this line-of-sight dust arises in a dense core around BN.
Acknowledgments
R.G.-M. and C.G. acknowledge funding from the European Community’s Seventh Framework Programme (/FP7/2007-2013/) under grant agreement No. 229517R. L.F.R. acknowledges the support of DGAPA, UNAM, and CONACyT (Mexico). This paper makes use of the following ALMA data: ADS/JAO.ALMA#2011.0.00009.SV. ALMA is a partnership of ESO (representing its member states), NSF (USA) and NINS (Japan), together with NRC (Canada) and NSC and ASIAA (Taiwan), in cooperation with the Republic of Chile. The Joint ALMA Observatory is operated by ESO, AUI/NRAO and NAOJ. The authors are grateful to the ALMA staff for doing the observations and calibrating the data. The referee, Dr. T. L. Wilson, and the editor, Dr. M. Walmsley, provided prompt and useful comments to this manuscript. The authors also thank Dr. Richard Plambeck for providing corrections.
References
- Bally, J., Cunningham, N. J., Moeckel, N., et al. 2011, ApJ, 727, 113 [NASA ADS] [CrossRef] [Google Scholar]
- Beuther, H., Zhang, Q., Greenhill, L. J., et al. 2005, ApJ, 632, 355 [NASA ADS] [CrossRef] [Google Scholar]
- Blake, G. A., Mundy, L. G., Carlstrom, J. E., et al. 1996, ApJ, 472, L49 [NASA ADS] [CrossRef] [Google Scholar]
- Friedel, D. N., & Snyder, L. E. 2008, ApJ, 672, 962 [NASA ADS] [CrossRef] [Google Scholar]
- Galván-Madrid, R., Keto, E., Zhang, Q., et al. 2009, ApJ, 706, 1036 [NASA ADS] [CrossRef] [Google Scholar]
- Goddi, C., Greenhill, L. J., Humphreys, E. M. L., Chandler, C. J., & Matthews, L. D. 2011a, ApJ, 739, L13 [NASA ADS] [CrossRef] [Google Scholar]
- Goddi, C., Humphreys, E. M. L., Greenhill, L. J., Chandler, C. J., & Matthews, L. D. 2011b, ApJ, 728, 15 [NASA ADS] [CrossRef] [Google Scholar]
- Gómez, L., Rodríguez, L. F., Loinard, L., et al. 2008, ApJ, 685, 333 [NASA ADS] [CrossRef] [Google Scholar]
- Gordon, M. A., & Sorochenko, R. L. 2002, Radio Recombination Lines, Their Physics and Astronomical Applications, Astrophys. Space Sci. Lib. (Dordrecht: Kluwer Academic Publishers), 282 [Google Scholar]
- Jiménez-Serra, I., Martín-Pintado, J., Báez-Rubio, A., Patel, N., & Thum, C. 2011, ApJ, 732, L27 [NASA ADS] [CrossRef] [Google Scholar]
- Keto, E. 2007, ApJ, 666, 976 [NASA ADS] [CrossRef] [Google Scholar]
- Keto, E., Zhang, Q., & Kurtz, S. 2008, ApJ, 672, 423 [NASA ADS] [CrossRef] [Google Scholar]
- Nissen, H. D., Cunningham, N. J., Gustafsson, M., et al. 2012, A&A, 540, A119 [NASA ADS] [CrossRef] [EDP Sciences] [Google Scholar]
- Osterbrock, D. E. 1989, Astrophysics of gaseous nebulae and active galactic nuclei [Google Scholar]
- Peters, T., Longmore, S. N., & Dullemond, C. P. 2012, MNRAS, 425, 2352 [NASA ADS] [CrossRef] [Google Scholar]
- Plambeck, R. L., Wright, M. C. H., Mundy, L. G., & Looney, L. W. 1995, ApJ, 455, L189 [NASA ADS] [CrossRef] [Google Scholar]
- Reid, M. J., Menten, K. M., Greenhill, L. J., & Chandler, C. J. 2007, ApJ, 664, 950 [NASA ADS] [CrossRef] [Google Scholar]
- Rodríguez, L. F., Poveda, A., Lizano, S., & Allen, C. 2005, ApJ, 627, L65 [NASA ADS] [CrossRef] [Google Scholar]
- Rodríguez, L. F., Zapata, L. A., & Ho, P. T. P. 2009, ApJ, 692, 162 [NASA ADS] [CrossRef] [Google Scholar]
- Scoville, N., Kleinmann, S. G., Hall, D. N. B., & Ridgway, S. T. 1983, ApJ, 275, 201 [NASA ADS] [CrossRef] [Google Scholar]
- Shuping, R. Y., Morris, M., & Bally, J. 2004, AJ, 128, 363 [NASA ADS] [CrossRef] [Google Scholar]
- Smirnov, G. T., Sorochenko, R. L., & Pankonin, V. 1984, A&A, 135, 116 [NASA ADS] [Google Scholar]
- Walmsley, C. M. 1990, A&AS, 82, 201 [NASA ADS] [Google Scholar]
- Wilson, T. L., Rohlfs, K., & Hüttemeister, S. 2009, Tools of Radio Astronomy (Springer-Verlag) [Google Scholar]
- Zapata, L. A., Rodríguez, L. F., Kurtz, S. E., & O’Dell, C. R. 2004, AJ, 127, 2252 [NASA ADS] [CrossRef] [Google Scholar]
- Zapata, L. A., Schmid-Burgk, J., Ho, P. T. P., Rodríguez, L. F., & Menten, K. M. 2009, ApJ, 704, L45 [NASA ADS] [CrossRef] [Google Scholar]
All Tables
All Figures
|
Fig. 1 Continuum ALMA image centered at 230.17 GHz (1.3 mm) of the Orion BN/KL region. The centimeter sources I, BN, and n are marked with circles. The emission is dominated by the bright, extended emission from the Orion “Hot Core”, with a peak intensity of 834 mJy beam-1. The rms noise is σ ~ 10 to 15 mJy. The half-power beam width (HPBW) is |
| In the text | |
|
Fig. 2 Continuum ALMA image centered at 231.17 GHz (1.3-mm) of the compact emission of the BN object. Only baselines with length B > 100 kλ were used to filter out the extended emission in the field. The BN object is detected as an unresolved source with flux density of 62 mJy. The rms noise around BN in this map is σ ~ 3 mJy. |
| In the text | |
|
Fig. 3 Hydrogen recombination line spectra (gray) and Gaussian fits (red) toward BN. The top panel shows the H30α line observed with ALMA. The flux is corrected by primary beam attenuation. The bottom panel shows the H53α line observed with the VLA. The channel widths are 2.0 km s-1 and 10.9 km s-1, respectively. |
| In the text | |
|
Fig. 4 Maps of the velocity-integrated (moment 0) emission of the recombination lines. The color scale shows the H30α line observed with ALMA ( |
| In the text | |
Current usage metrics show cumulative count of Article Views (full-text article views including HTML views, PDF and ePub downloads, according to the available data) and Abstracts Views on Vision4Press platform.
Data correspond to usage on the plateform after 2015. The current usage metrics is available 48-96 hours after online publication and is updated daily on week days.
Initial download of the metrics may take a while.