| Issue |
A&A
Volume 535, November 2011
|
|
|---|---|---|
| Article Number | L8 | |
| Number of page(s) | 5 | |
| Section | Letters | |
| DOI | https://doi.org/10.1051/0004-6361/201117854 | |
| Published online | 22 November 2011 | |
Letter to the Editor
Infall and outflow within 400 AU from a high-mass protostar
3D velocity fields from methanol and water masers in AFLG 5142
1
European Southern Observatory, Karl-Schwarzschild-Strasse 2, 85748 Garching bei München, Germany
2
INAF, Osservatorio Astrofisico di Arcetri, Largo E. Fermi 5, 50125 Firenze, Italy
e-mail: cgoddi@eso.org
3
Max-Planck-Institut für Radioastronomie, Auf dem Hügel 69, 53121 Bonn, Germany
Received: 8 August 2011
Accepted: 7 October 2011
Observational signatures of infalling envelopes and outflowing material in early stages of protostellar evolution and at small radii from the protostar are essential to progress in the understanding of the mass-accretion process in star formation. In this Letter, we report a detailed study on the accretion and outflow structure around a protostar in the well-known high-mass star-forming region AFGL 5142. We focus on the mm source MM–1, which exhibits hot-core chemistry, radio continuum emission, and strong water (H2O) and methanol (CH3OH) masers. Remarkably, our Very Long Baseline Interferometry (VLBI) observations of molecular masers over six years provided us with the 3D velocity field of circumstellar molecular gas with a resolution of 0.001–0.005′′ and at radii < 0.′′23 (or 400 AU) from the protostar. In particular, our measurements of CH3OH maser emission for the first time provided a direct measurement of the infall of a molecular envelope (radius of 300 AU and velocity of 5 km s-1) onto an intermediate- to high-mass protostar. We estimate an infall rate of 6 × 10⁻⁴ n8 M⊙ yr-1, where n8 is the ambient volume density in units of 108 cm-3 (required for maser excitation). In addition, our measurements of the H2O maser (and radio continuum) emission identify a collimated bipolar molecular outflow (and ionized jet) from MM–1. The evidence of simultaneous accretion and outflow at small spatial scales makes AFGL 5142 an extremely compelling target for high-angular resolution studies of high-mass star formation.
Key words: circumstellar matter / stars: formation / ISM: jets and outflows / masers / stars: kinematics and dynamics / ISM: individual objects: AFGL 5142
© ESO, 2011
1. Introduction
Theoretical models of star formation predict that protostars form from the gravitational collapse of molecular cloud cores and mass accretes onto the protostar either by direct accretion of low angular momentum material or from a disk (e.g., Shu et al. 1987). Hence, observational signatures of infalling envelopes in early stages are essential to progress in the understanding of the mass-accretion process and constrain theoretical models of star formation. To date, bulk infall motions have been detected mostly by observing inverse P-Cygni profiles of molecular lines along the line-of-sight (l.o.s.) to the infalling gas against a bright background (dust or H II emission) in both low-mass (e.g., Lee et al. 2009) and high-mass (e.g., Beltrán et al. 2011) protostars. Nonetheless, discerning the signature of infall in embedded protostars is inherently difficult. First, significant infall motions are confined only to the innermost regions of the core, and the small spatial scales involved make a direct measurement difficult. Second, other phenomena can mimic infall. Line asymmetries may be associated with competing processes such as rotation and outflows, or even arise from superposition of intervening clouds along the l.o.s. Confusion is more severe in the case of high-mass protostars, which are on average more distant (>1 kpc) and form embedded in rich protosclusters. Evidence of global infall has been found only in a handful of high-mass star-forming regions and at large radii (>1000 AU) from the protostar(s) forming at the center (Zhang & Ho 1997; Sollins & Ho 2005; Beltrán et al. 2006, 2011). Besides, even for the few known bona fide cases of infall, ambiguity arises from comparison of observations at different angular resolutions. On the one hand, molecular thermal transitions (e.g., CH3CN, NH3, CO), observed with present connected-element interferometers, trace infall/rotation at radii of several thousands of AU (Beltrán et al. 2006, 2011). On the other hand, molecular masers (e.g., H2O), observed with Very Long Baseline Interferometry (VLBI), clearly trace expansion at much smaller radii of hundreds of AU (Goddi et al. 2005; Moscadelli et al. 2007). Therefore, infall motions should be measured in the proximity (≪1000 AU) to the protostar to definitely establish whether the rotating and infalling material at large scales eventually accretes onto individual protostars.
We report a convincing signature of infall of a circumstellar molecular envelope with a radius of only 300 AU in the high-mass star-forming region AFGL 5142 (1.8 kpc; Snell et al. 1988). Observations with the Submillimeter Array (SMA) at 1.3 mm identified a high-mass protocluster containing five dusty mm cores and three CO outflows within a few arcseconds of each other (Zhang et al. 2007). The focus of this Letter is the mm core MM–1, which shows hot-core chemistry, exhibits radio continuum emission from ionized gas, and powers water and methanol masers (Goddi et al. 2007), hinting that it is likely the most massive object in the cluster. New multi-epoch VLBI observations of CH3OH masers enabled us to measure the 3D velocity field of molecular gas, providing the most direct and unbiased measurement (yet obtained) of infall onto an intermediate- to high-mass protostar. We also discuss the kinematics of H2O masers and the physical properties of radio continuum emission with the aim of characterizing the outflow structure, and hence providing a complete picture of star formation on scales <400 AU, which are usually not accessible through observations, yet are relevant for testing accretion models.
Summary of observations toward AFGL 5142 MM–1.
2. Observations and results
For six years, our team has launched an observational campaign of different molecular masers and radio continuum emission in AFGL 5142 using the European VLBI Network (EVN), the Very Long Baseline Array (VLBA), and the Very Large Array (VLA). Table 1 summarizes the observations. We observed with the EVN the 51 → 60A + transition of CH3OH at 6.669 GHz at three distinct epochs during 2004–2009. Data of the first epoch were reported in Goddi et al. (2007) and we refer the reader to that article for a full description of the EVN observing setup and data reduction. We discuss here for the first time the subsequent epochs and proper motion measurements of CH3OH masers. The 616 − 523 transition of H2O at 22.235 GHz was observed with the VLBA at four distinct epochs during 2003–2004; Goddi & Moscadelli (2006) discuss in detail the 3D kinematics of H2O masers. Here, we also report new images of the continuum emission from VLA archival data at 22 GHz (Goddi & Moscadelli 2006) and 8.4 GHz (Zhang et al. 2007). Published maps used natural weighting of the uv-data and had an angular resolution ~0.′′3–0.′′4. The new VLA maps at both frequencies were produced with robust weighting, which improves the angular resolution to 0.′′16 (8.4 GHz) and 0.′′24 (22 GHz).
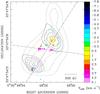 |
Fig. 1 Molecular masers and radio continuum in AFGL 5142 MM–1. Positions and l.o.s. velocities of H2O masers (observed with the VLBA) are indicated by triangles and CH3OH masers (observed with the EVN) are indicated by circles. Colors code l.o.s. velocities according to the wedge to the right (the systemic velocity, –1.1 km s-1, is in green). The contour maps show the continuum emissions (observed with the VLA) at 22 GHz (dotted contours, representing 3, 4, and 5 times the 46 μJy beam-1 rms noise level) and 8.4 GHz (dashed contours, representing 3, 4, 5, 6 and 7 times the 23 μJy beam-1 rms noise level). The two small-dashed lines show the linear fits to the positions of all water masers (PA –32°) and of the red methanol masers (PA 82°). |
Figure 1 shows positions and l.o.s. velocities of the 22 GHz water and the 6.7 GHz methanol masers (first epoch of observation) overplotted on the contour maps of the continuum emission at 8.4 GHz and 22 GHz. The 22 GHz continuum emission appears elongated northwest-southeast (NW-SE), while the 8.4 GHz emission (with higher angular resolution) is resolved into two components separated by 300 mas (or 540 AU) on the plane of sky. H2O masers are concentrated in two clusters that are associated with the two components of the 8.4 GHz continuum: the one toward the SE has blue-shifted l.o.s. velocities with respect to the systemic velocity of the region (–1.1 km s-1; Zhang et al. 2007); the other one located to the NW has red-shifted l.o.s. velocities. CH3OH masers are distributed across a similar area as the H2O masers and consist of three clusters. A cluster of only two features with blue-shifted l.o.s. velocities is associated with the SE continuum peak (not discussed here); a second cluster with red-shifted l.o.s. velocities is associated with the NW continuum peak (“yellow” features); a third cluster with the most red-shifted l.o.s. velocities has an intermediate position between the two 8.4 GHz continuum peaks (“red” features). The dashed lines in Fig. 1 provide the best-fit (least-square) line of positions of all water masers (position angle or PA of –32°) and of the red methanol masers (PA of 82°).
Figure 2 shows the proper motions of H2O masers (upper panel) and CH3OH masers (lower panel). Because measurements of absolute proper motions are affected by the combined uncertainty of the solar motion and Galactic rotation curve (up to 15 km s-1; Reid et al. 2009), we preferred to base our analysis on relative velocities for the water and methanol masers. For this we needed a suitable reference system that is ideally centered on the protostar. For water, we calculated the geometric mean of positions at single epochs for all masers that persisted over four epochs (hereafter “center of motion”) and we referred the proper motions to this point. This method is equivalent to subtracting from all masers the average proper motion of the selected features. The relative proper motions show that the two clusters are moving away from each other along a NW-SE direction, with velocities ~20 km s-1. Although they show a similar pattern, the relative proper motions identify a more collimated bipolar flow than the absolute proper motions (compare with Fig. 2 in Goddi et al. 2007). We can now use positions and 3D velocities of the water masers to define geometric parameters of the outflow from MM–1 (which we for simplicity suppose to be of conical shape): opening angle, PA of the sky-projected axis, and inclination angle of the axis with the plane of sky. The semi-opening angle of the outflow (25°) is estimated from the maximum angle between the proper motion PA and the outflow axis. The median PA of relative proper motions (–47°) is similar to the PA of the best-fit line of water maser positions (–32°) and we can assume an intermediate value (–40°) for the PA of the sky-projected outflow axis. To estimate the inclination angle, we reasoned as follows. Based on the ratio of l.o.s. velocities and proper motions, water masers appear to move mainly on the plane of sky. If they arise from the surface of a cone, the outflow inclination angle can be approximated with its semi-opening angle (i.e., 25°).
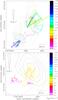 |
Fig. 2 Proper motions of H2O (upper panel) and CH3OH (lower panel) masers in AFGL 5142 MM–1 as measured relative to their centers of motion, independently calculated for water (cross) and methanol (star) masers. The rectangle in the upper panel shows the area plotted in the lower panel. The cones indicate orientation and uncertainties of the measured proper motions (the amplitude scale is given in each panel) and colors denote l.o.s. velocities. Contour maps show the VLA 22 GHz (dotted line) and 8.4 GHz (dashed line) continuum emissions. The black star in the lower panel identifies the putative location of the protostar. |
Because the amplitude of methanol proper motions is much lower than that of water (with mean values ~3 km s-1 and ~15 km s-1, respectively), the choice of a suitable reference for methanol velocities is more critical. The red masers have internal proper motions (calculated using the center of motion of red masers only; 1–2 km s-1) much smaller than the internal proper motions of the yellow masers (relative to the center of motion of only yellow features; 1–10 km s-1); the opposite is true for their l.o.s. velocities (3–6 km s-1 vs. 0–2 km s-1). Because red masers are projected closer to the putative protostellar position in the plane of sky (see below) and move mostly along the l.o.s., we assumed that their average proper motion gives an estimate of the protostar proper motion. Hence, we calculated the center of motion of methanol using a sample of only red features with a stable spatial and spectral structure. The resulting proper motions, shown in Fig. 2b, represent the sky-projected velocities as roughly measured by an observer comoving with the star1. The yellow masers have proper motions with larger amplitudes that are directed toward the centroid of the red masers, which instead move mostly along the l.o.s.; both aspects indicate infall toward the protostar. This is consistent with methanol masers having red-shifted l.o.s. velocities and being in the foreground of the 22 GHz continuum emission (optically thick at 6.7 GHz). The center of motion calculated from the red cluster of methanol masers provides our best estimate of the location of the protostar (marked with a star in Fig. 2b). Three lines of arguments support this hypothesis: 1) the red masers are distributed in a symmetric and elongated structure roughly perpendicular to the outflow axis traced by water masers; 2) the two best-fit lines of water and red methanol masers intersect approximately in correspondence of the methanol center of motion, close to the centroid of the 22 GHz continuum (Fig. 1); 3) the model employed to interpret the methanol kinematics gives a similar best-fit location of the protostar (within uncertainties ~20 mas; see Sect. 3.2).
3. Discussion
Our VLBI observations show that methanol and water masers trace different kinematics, even though they are excited at similar radii from MM–1: outflow, infall, and (perhaps) rotation, which we discuss separately in the following subsections.
3.1. Collimated outflow from MM–1
We identified a collimated bipolar outflow at radii 140 to 400 AU from the driving protostar that is traced by radio continuum emission in its ionized component and by water masers in its molecular component. Before this work, it was possible to interpret the radio continuum as either a hyper-compact (HC) H II region or an ionized jet (Goddi & Moscadelli 2006). The high angular resolution maps in Fig. 2 reveal that the two radio continuum peaks are associated with the two expanding clusters of water masers. This evidence favors the interpretation of the radio continuum as an ionized jet and suggests that water masers may originate in shocks produced by the interaction of the jet with the surrounding molecular environment. For optically thin emission, 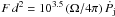 (Sanna et al. 2010), where F is the measured continuum flux in mJy,
  is the jet momentum rate in M⊙ yr-1 km s-1, Ω is the jet solid angle in sr, and d is the source distance in kpc. Using a flux density of 0.24 mJy (0.17 mJy) measured at 8.4 GHz for the NW (SE) component and a distance of 1.8 kpc, we derive
 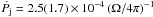 M⊙ yr-1 km s-1.
Based on our measurements of positions and 3D velocities of water masers and under reasonable assumptions for gas densities, we can estimate the mass-loss rate (Ṁ) and the momentum rate ( ) of the molecular outflow. For a conical flow with solid angle Ω, the mass transferred across a shell of thickness dr in a time interval dt at a distance R from the protostar is Ṁ = 4πR2nH2mH2V (Ω/4π) (where V = dr/dt). We then derive
  M⊙ yr-1 and
  M⊙ yr-1 km s-1, where V10 is the average maser velocity in units of 10 km s-1, R100 is the average distance of water masers in units of 100 AU, and n8 is the ambient volume density in units of 108 cm-3 (required for water maser excitation; e.g., Kaufman & Neufeld 1996). The average (sky-projected) distance of water masers from the protostar is 290 AU and their average velocity is 15 km s-1, which give Ṁ = 1.9 × 10⁻³ (Ω/4π)n8 M⊙ yr-1 and
 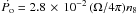 M⊙ yr-1 km s-1. If the same outflow is responsible for exciting the radio continuum and water masers, the solid angle Ω can be determined by requiring that the momentum rate in the maser outflow equals that from the continuum emission. We derive Ω = 1–1.2 sr, corresponding to an outflow semi-opening angle of 32–36°, which is intermediate between the angle determined by water masers (25°) and the angle subtended by the two radio continuum components (90°). For a semi-opening angle of 34°, we derive Ṁ = 1.6 × 10⁻⁴n8 M⊙ yr-1 and Ṗ = 2.4 × 10⁻³n8 M⊙ yr-1 km s-1, which indicates strong outflow activity from MM–1.
On larger scales, CO (2–1) line emission revealed a multiple system of outflows, that are oriented north-south, northeast-southwest, and NW-SE (Zhang et al. 2007). The poor angular resolution of the SMA (1–3′′) precluded a clear identification of the driving sources of outflows. Our higher angular resolution measurements allow us to identify MM–1 unambiguously as the driving source of the NW-SE oriented outflow, traced by H2O masers and radio continuum at radii < 400AU and by CO emission at radii > 2000 AU. Zhang et al. (2007) derived a momentum rate of 2 × 10⁻³ M⊙ yr-1 km s-1, which agrees well with the momentum rate of the H2O maser outflow. We conclude that the ionized jet observed in the radio continuum emission and the molecular outflow probed by water masers can account for the acceleration of the large-scale CO outflow driven by MM–1.
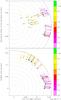 |
Fig. 3 Measured (color arrows) and best-fit model (black arrows) 3D velocity vectors of CH3OH masers. We show projections onto the equatorial plane of the envelope (upper panel) and a plane containing the l.o.s. and the outflow axis (lower panel). We assumed an outflow axis lying on the plane of sky (we obtained qualitatively the same picture by assuming an outflow inclination angle of 25°). The modeled infalling envelope has a radius of 0.′′16 (or 290 AU) and an infall velocity of 5 km s-1. The dotted lines indicate concentric circles at steps of 10% of the radius (0.′′016) around the protostar at the (0, 0) position. |
3.2. Infall of gas onto MM–1 from a molecular envelope
Infall onto MM–1 was first claimed by Goddi et al. (2007) based solely on positions and l.o.s. velocities of methanol masers. The measurement of proper motions has provided the missing kinematic observable to confirm the infall hypothesis.
We adopt a simple spherical model to derive main parameters of infall:  , where V is the velocity field, R is the position vector from the protostar, M is the total gas mass within a sphere of radius R centered on the protostar. The model has four free parameters: the sky-projected coordinates (α and δ) of the protostar (the sphere center), the sphere radius R, and M, sampled in the range [–0.′′1, 0.′′1], [–0.′′1, 0.′′1], [0.′′1, 0.′′4], and [1, 25 M⊙], respectively. The best-fit parameters are found by using fine steps (1%) of the parameter ranges and minimizing the χ2 given by the sum of the squared differences between the 3D velocity vectors of the model and the methanol data: R = 290 ± 70 AU = 0.′′16 ± 0.′′03 and M = 4 ± 1 M⊙, corresponding to Vinf = 5 ± 1 km s-1. For each fit parameter, the error corresponds to a variation from the best-fit value for which the χ2 value increases by ~ 10%. Figure 3 shows the measured and best-fit model 3D velocity vectors of methanol masers projected onto the plane that contains the protostar and perpendicular to the outflow axis (the equatorial plane; upper panel) and the plane that contains the l.o.s. and the outflow axis (lower panel). The best-fit position of the protostar (0, 0) is coincident (within uncertainties ~0.′′02) with the methanol center of motion. Most of the measured 3D velocities are well reproduced by the infall model. The two projections also show that methanol masers do not sample the whole spherical envelope but concentrate in preferred areas. The red features sample a relatively narrow solid angle about the l.o.s. to the protostar: their distance from the protostar (0
 15) is about three times their maximum offset along the equatorial plane (005). The yellow features are found closer to the pole of the sphere. This behavior may be explained by considering that molecular masers are preferably observed in regions where either strong background emission can be amplified or long, velocity-coherent, amplification paths along the l.o.s. occur. The yellow features lie on top of the NW peak of the radio continuum, which naturally provides the background radiation which is being amplified. For the red features that are projected close to the putative protostellar position, possible background sources (undetected by the VLA) are a HC H II region of 005 radius or the base of an ionized wind within 005 from the protostar. The elongation of red features may be explained with the higher densities that are expected in the equatorial plane and provide a longer amplification path for the maser radiation. The amplification of the radio continuum background is consistent with the yellow masers (located on top of the continuum peak) being much stronger than the red masers (see the total-power spectra of the 6.7 GHz emission in Fig. 4).
We can now use the best-fit parameters for the shell radius and infall velocity derived from our model to estimate a mass infall rate, Ṁinf = 4πR2nH2mH2V, and an infall momentum rate,  . For R = 290 AU and Vinf = 5 km s-1, we obtain Ṁinf = 6 × 10⁻⁴ n8 M⊙ yr-1 and Ṗinf = 3 × 10⁻³ n8 M⊙ km s-1 yr-1, where n8 is the gas volume density in units of 108 cm-3 (required for methanol maser excitation; Cragg et al. 2005). On the one hand, the high value estimated for the infall rate might indicate that the protostar is in an active accretion stage. On the other hand, a ratio of 0.27 for the mass-loss rate to the infall rate indicates that the outflow can efficiently remove mass (and angular momentum), as expected from magneto-centrifugal ejection. We caution that the mass rates estimated above are accurate only to within 1–2 orders of magnitude, owing to the uncertainty in the density required for maser excitation. Nevertheless, our measurements show that the two maser species used to derive the mass-loss rate (H2O) and the mass infall rate (CH3OH) are distributed across a similar area, which makes the hypothesis plausible that they are excited in molecular gas with similar densities. Hence, the dependence of the outflow/infall rate ratio on gas density should be less critical.
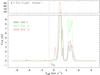 |
Fig. 4 Total-power spectra of CH3OH emission toward MM–1. The upper panel shows a zoom of the methanol maser peak. The vertical dotted line represents the systemic velocity. |
We estimated 4 M⊙ for the total gas mass enclosed in the infalling envelope, which is consistent with the value estimated from dust continuum emission (3 M⊙; Zhang et al. 2007)2. Several lines of evidence suggest the presence of a protostar with mass ≫ 4 M⊙ at the center of the envelope, however: the high luminosity of the region (>104 L⊙), the large mass of the CO outflow (3 M⊙), the presence of methanol masers (detected only in high-mass protostars), and the powerful outflow activity shown by strong water maser and radio continuum emission. Indeed, the simple approach adopted here considers only gravity, but likely non-gravitational forces can influence gas dynamics. Girart et al. (2009) recently found that the gravitational collapse of a massive molecular core in G31.41+0.31 is controlled by magnetic fields, which appear to be effective in removing angular momentum and slowing down gas infall, as expected from magnetic braking (Galli et al. 2006). Recently, Matthews et al. (2010) measured SiO maser proper motions in the disk-wind system associated with Orion Source I and estimated a dynamical mass of ~7 M⊙ for the central protostar, much lower than the estimate from the dynamics of interacting protostars in the region (~20 M⊙; Goddi et al. 2011). Matthews et al. (2010) suggested that magnetic fields may be important in driving the gas dynamics around Source I, and Goddi et al. (2011) argued that, assuming magnetic support in the disk, a significant fraction of the mass of the central object can be “hidden” in the Keplerian profile of maser velocities, which would lead to an underestimate of the mass. Similar mechanisms could be at work in AFGL 5142 MM–1. Besides magnetic fields, any realistic calculation of the infall of a circumstellar envelope should also include the effects of rotation. As the collapse proceeds, assuming the angular momentum is conserved, rotation should lead eventually to the formation of a centrifugally supported disk around the accreting protostar (see next section), which would contribute to underestimate the actual mass of the central protostar additionally.
3.3. Is there a rotating disk perpendicular to the outflow?
Our methanol maser measurements provide hints of the presence of a rotating disk. The red masers are elongated across 300 AU in the plane of sky roughly perpendicular to the jet axis. Some yellow features closer to the jet axis also show a high residual between modeled and measured velocities (Fig. 3), which could be interpreted in terms of anticlockwise rotation about the jet. However, the good fit of the 3D velocities of methanol masers obtained with a spherical infall model implies that infall dominates the velocity field at 300 AU from the protostar. Hence, we expect the disk to be compact (radius <300 AU). The disk hypothesis is also supported by recent interferometric imaging of complex molecules, which reveals a structure of size ~600 AU, elongated east-west and centered on the protostellar position derived here within astrometric uncertainties (Palau et al. 2011).
The simultaneous presence of a collimated outflow, an infalling envelope, and (possibly) a rotating disk makes AFGL 5142 an extremely compelling target for high angular resolution studies of accretion in high-mass star formation.
Note that Goddi et al. (2007) assumed a wrong systemic velocity of –4.4 km s-1 (derived from low angular resolution data), which resulted in a 2 × infall velocity and a 4 × central mass (using only l.o.s velocities).
Acknowledgments
A.S. acknowledges financial support by the ERC Advanced Investigator Grant GLOSTAR (247078).
References
- Beltrán, M. T., Cesaroni, R., Codella, C., et al. 2006, Nature, 443, 427 [NASA ADS] [CrossRef] [PubMed] [Google Scholar]
- Beltrán, M. T., Cesaroni, R., Neri, R., & Codella, C. 2011, A&A, 525, A151 [NASA ADS] [CrossRef] [EDP Sciences] [Google Scholar]
- Cragg, D. M., Sobolev, A. M., & Godfrey, P. D. 2005, MNRAS, 360, 533 [NASA ADS] [CrossRef] [Google Scholar]
- Galli, D., Lizano, S., Shu, F. H., & Allen, A. 2006, ApJ, 647, 374 [NASA ADS] [CrossRef] [Google Scholar]
- Girart, J. M., Beltrán, M. T., Zhang, Q., et al. 2009, Science, 324, 1408 [NASA ADS] [CrossRef] [PubMed] [Google Scholar]
- Goddi, C., & Moscadelli, L. 2006, A&A, 447, 577 [NASA ADS] [CrossRef] [EDP Sciences] [Google Scholar]
- Goddi, C., Moscadelli, L., Alef, W., et al. 2005, A&A, 432, 161 [NASA ADS] [CrossRef] [EDP Sciences] [Google Scholar]
- Goddi, C., Moscadelli, L., Sanna, A., et al. 2007, A&A, 461, 1027 [NASA ADS] [CrossRef] [EDP Sciences] [Google Scholar]
- Goddi, C., Humphreys, E. M. L., Greenhill, L. J., et al. 2011, ApJ, 728, 15 [NASA ADS] [CrossRef] [Google Scholar]
- Kaufman, M. J., & Neufeld, D. A. 1996, ApJ, 456, 250 [NASA ADS] [CrossRef] [Google Scholar]
- Lee, C.-F., Mao, Y.-Y., & Reipurth, B. 2009, ApJ, 694, 1395 [NASA ADS] [CrossRef] [Google Scholar]
- Matthews, L. D., Greenhill, L. J., Goddi, C., et al. 2010, ApJ, 708, 80 [NASA ADS] [CrossRef] [Google Scholar]
- Moscadelli, L., Goddi, C., Cesaroni, R., et al. 2007, A&A, 472, 867 [NASA ADS] [CrossRef] [EDP Sciences] [Google Scholar]
- Palau, A., Fuente, A., Girart, J. M., et al. 2011, ApJ, in press [arXiv:1109.5500] [Google Scholar]
- Reid, M. J., Menten, K. M., Zheng, X. W., et al. 2009, ApJ, 700, 137 [NASA ADS] [CrossRef] [Google Scholar]
- Sanna, A., Moscadelli, L., Cesaroni, R., et al. 2010, A&A, 517, A71 [NASA ADS] [CrossRef] [EDP Sciences] [Google Scholar]
- Shu, F. H., Adams, F. C., & Lizano, S. 1987, ARA&A, 25, 23 [Google Scholar]
- Snell, R., Huang, Y., Dickman, R., & Claussen, M. 1988, ApJ, 325, 853 [NASA ADS] [CrossRef] [Google Scholar]
- Sollins, P. K., & Ho, P. T. P. 2005, ApJ, 630, 987 [NASA ADS] [CrossRef] [Google Scholar]
- Zhang, Q., & Ho, P. T. P. 1997, ApJ, 488, 241 [NASA ADS] [CrossRef] [Google Scholar]
- Zhang, Q., Hunter, T. R., Beuther, H., et al. 2007, ApJ, 658, 1152 [NASA ADS] [CrossRef] [Google Scholar]
All Tables
All Figures
|
Fig. 1 Molecular masers and radio continuum in AFGL 5142 MM–1. Positions and l.o.s. velocities of H2O masers (observed with the VLBA) are indicated by triangles and CH3OH masers (observed with the EVN) are indicated by circles. Colors code l.o.s. velocities according to the wedge to the right (the systemic velocity, –1.1 km s-1, is in green). The contour maps show the continuum emissions (observed with the VLA) at 22 GHz (dotted contours, representing 3, 4, and 5 times the 46 μJy beam-1 rms noise level) and 8.4 GHz (dashed contours, representing 3, 4, 5, 6 and 7 times the 23 μJy beam-1 rms noise level). The two small-dashed lines show the linear fits to the positions of all water masers (PA –32°) and of the red methanol masers (PA 82°). |
| In the text | |
|
Fig. 2 Proper motions of H2O (upper panel) and CH3OH (lower panel) masers in AFGL 5142 MM–1 as measured relative to their centers of motion, independently calculated for water (cross) and methanol (star) masers. The rectangle in the upper panel shows the area plotted in the lower panel. The cones indicate orientation and uncertainties of the measured proper motions (the amplitude scale is given in each panel) and colors denote l.o.s. velocities. Contour maps show the VLA 22 GHz (dotted line) and 8.4 GHz (dashed line) continuum emissions. The black star in the lower panel identifies the putative location of the protostar. |
| In the text | |
|
Fig. 3 Measured (color arrows) and best-fit model (black arrows) 3D velocity vectors of CH3OH masers. We show projections onto the equatorial plane of the envelope (upper panel) and a plane containing the l.o.s. and the outflow axis (lower panel). We assumed an outflow axis lying on the plane of sky (we obtained qualitatively the same picture by assuming an outflow inclination angle of 25°). The modeled infalling envelope has a radius of 0.′′16 (or 290 AU) and an infall velocity of 5 km s-1. The dotted lines indicate concentric circles at steps of 10% of the radius (0.′′016) around the protostar at the (0, 0) position. |
| In the text | |
|
Fig. 4 Total-power spectra of CH3OH emission toward MM–1. The upper panel shows a zoom of the methanol maser peak. The vertical dotted line represents the systemic velocity. |
| In the text | |
Current usage metrics show cumulative count of Article Views (full-text article views including HTML views, PDF and ePub downloads, according to the available data) and Abstracts Views on Vision4Press platform.
Data correspond to usage on the plateform after 2015. The current usage metrics is available 48-96 hours after online publication and is updated daily on week days.
Initial download of the metrics may take a while.