| Issue |
A&A
Volume 534, October 2011
|
|
|---|---|---|
| Article Number | A124 | |
| Number of page(s) | 8 | |
| Section | Extragalactic astronomy | |
| DOI | https://doi.org/10.1051/0004-6361/201117338 | |
| Published online | 19 October 2011 | |
Far-infrared constraints on the contamination by dust-obscured galaxies of high-z dropout searches
1
Université de Toulouse, UPS-OMP, IRAP, Toulouse, France
e-mail: This email address is being protected from spambots. You need JavaScript enabled to view it.
2
CNRS, IRAP, 9 Av. colonel Roche, BP 44346, 31028 Toulouse Cedex 4, France
3
Geneva Observatory, Université de Genève, 51 chemin des Maillettes, 1290 Versoix, Switzerland
4
Max-Planck-Institut für extraterrestrische Physik, Postfach 1312, 85741 Garching, Germany
5
Max-Planck-Institut für Radioastronomie, Auf dem Hügel 69, 53121 Bonn, Germany
6
Steward Observatory, University of Arizona, 933 North Cherry Avenue, Tucson, AZ 85721, USA
7
Institute for Computational Cosmology, Durham University, South Road, Durham DH1 3LE, UK
8
UK Astronomy Technology Centre, Science and Technology Facilities Council, Royal Observatory, Blackford Hill, Edinburgh EH9 3HJ, UK
9
Institute for Astronomy, University of Edinburgh, Blackford Hill, Edinburgh EH9 3HJ, UK
10
Institut d’Astrophysique Spatiale, Bât. 121, Université Paris Sud 11 & CNRS (UMR8617), 91405 Orsay Cedex, France
11
LERMA, Observatoire de Paris, 61 avenue de l’Observatoire, 75014 Paris, France
12
California Institute of Technology, 1200 East California Boulevard, Pasadena, California 91125, USA
13
Centre de Recherche Astrophysique de Lyon, Université Lyon 1, 9 avenue Charles André, 69561 Saint Genis Laval, France
14
Laboratoire d’Astrophysique de Marseille, CNRS- Université Aix-Marseille, 38 rue F. Joliot-Curie, 13388 Marseille Cedex 13, France
15
Herschel Science Centre, European Space Astronomy Centre, ESA, Villanueva de la Caada, 28691 Madrid, Spain
16
Leiden Observatory, Leiden University, PO Box 9513, 2300 RA Leiden, The Netherlands
17
Departamento de Astrofísica, Facultad de CC. Físicas, Universidad Complutense de Madrid, 28040 Madrid, Spain
Received: 25 May 2011
Accepted: 11 August 2011
Abstract
The spectral energy distributions (SED) of dusty galaxies at intermediate redshift may look similar to very high-redshift galaxies in the optical/near infrared (NIR) domain. This can lead to the contamination of high-redshift galaxy searches based on broad-band optical/NIR photometry by lower redshift dusty galaxies because both kind of galaxies cannot be distinguished. The contamination rate could be as high as 50%. This work shows how the far-infrared (FIR) domain can help to recognize likely low-z interlopers in an optical/NIR search for high-z galaxies. We analyze the FIR SEDs of two galaxies that are proposed to be very high-redshift (z > 7) dropout candidates based on deep Hawk-I/VLT observations. The FIR SEDs are sampled with PACS/Herschel at 100 and 160 μm, with SPIRE/Herschel at 250, 350 and 500 μm and with LABOCA/APEX at 870 μm. We find that redshifts > 7 would imply extreme FIR SEDs (with dust temperatures >100 K and FIR luminosities >1013 L⊙). At z ~ 2, instead, the SEDs of both sources would be compatible with those of typical ultra luminous infrared galaxies or submillimeter galaxies. Considering all available data for these sources from visible to FIR we re-estimate the redshifts and find z ~ 1.6–2.5. Owing to the strong spectral breaks observed in these galaxies, standard templates from the literature fail to reproduce the visible-to-near-IR part of the SEDs even when additional extinction is included. These sources strongly resemble dust-obscured galaxies selected in Spitzer observations with extreme visible-to-FIR colors, and the galaxy GN10 at z = 4. Galaxies with similar SEDs could contaminate other high-redshift surveys.
Key words: galaxies: distances and redshifts / dust, extinction / gravitational lensing: weak / galaxies: high-redshift
© ESO, 2011
1. Introduction
Observing galaxies up to very high-redshifts allows us to study directly the formation and evolution of structures in the expanding Universe. Finding galaxies at ever higher redshifts has therefore become one of the main areas of extragalactic astronomy. The most common technique is to use known broad features in the spectral energy distributions (SEDs) of galaxies to identify high-redshift sources in deep optical and near-infrared (NIR) multi-band observations. In particular the Lyman break is widely used to select sources by redshift, noting their disappearance in bands below a given wavelength, the so-called dropout technique (Steidel et al. 1996). With this technique and state-of-the-art telescopes and instruments it is now possible to select sources that are good candidates for being at the end or within the epoch of reionization (Richard et al. 2006; Zheng et al. 2009; McLure et al. 2010; Wilkins et al. 2010; Oesch et al. 2010; Bouwens et al. 2010b,a).
Low-redshift galaxies, however, can have very steep SEDs that resemble a break in the UV/optical/NIR. This can lead to contamination of the dropout selection of very high-z galaxies, and consequently to erroneous estimates of the star-formation rate density, stellar masses, and others, although these effects are currently difficult to quantify. Objects such as these have been found and discussed by several authors (see e.g. Dickinson et al. 2000; Mobasher et al. 2005; Schaerer et al. 2007; Dunlop et al. 2007; Chary et al. 2007; Capak et al. 2011). Confirming the photometric redshifts of high-z galaxies by identifying spectral lines is challenging because the sources are generally too faint for spectroscopic follow-up observations or because they may intrinsically lack Lyα emission (but see Vanzella et al. 2011).
The recent developments of space far-infrared (FIR) instrumentation offer new perspectives in this domain. In particular, with the advent of the Herschel Space Observatory it is now possible to sample the FIR part of the SEDs, where the thermal dust emission dominates. The shape of the FIR SED universally looks like a broad bump and can be used to further constrain the optical/NIR photometric redshifts. Although the wavelength of the FIR SED peak also depends on the dust temperature, the limited range of average temperatures observed so far in galaxies(between 20 and 60 K averaged over the entire galaxies, see, e.g., Kovács et al. 2006; Magnelli et al. 2010; Magdis et al. 2010; Wardlow et al. 2011) can be used as a prior and makes it possible to distinguish between intermediate (z < 3) and very high-redshifts (z > 6).
Far-infrared observations of high-z candidates are also essential to characterize their star forming and dust properties and thus interpret correctly their contribution to the cosmic history of star-formation and reionization.
Recently Laporte et al. (2011) identified ten z > 7 candidates in the field of the cluster Abell 2667 using photometric dropout criteria based on deep observations with HAWK-I on the ESO Very Large Telescope (VLT). Comparing their results to other studies and in particular to the WIRCAM Ultra Deep Field Survey (WUDS; Pello et al. in prep.), which is based on deeper optical observations blueward of the I-band, they estimated that 50–75% of these candidates could in fact be lower redshift interlopers. Here, we study two galaxies of this sample that are clearly detected by Herschel, namely the sources named “z1” and “Y5”. Our goal is to determine whether they could be interlopers and to understand their nature. The redshift probability distributions of these two sources derived by Laporte et al. (2011) from SED fitting to deep optical/NIR photometry show a prominent peak at z = 7.6 and 8.6 respectively. However, a secondary peak at lower redshift around z ~ 2 indicates that they could be interlopers as well. Laporte et al. (2011) also noted that the 24 μm detection of z1 with MIPS/Spitzer (Y5 is outside the Spitzer map) seems difficult to reconcile with the high-z solution. We use new Herschel and LABOCA observations of Abell 2667 to reconstruct the FIR part of their SEDs. We can thus further constrain their redshifts and study their physical properties.
The layout of the article is as follows: Sect. 2 gives a presentation of the observations and data analysis. In Sect. 3 the FIR part of the SEDs is analyzed. In Sect. 4 the complete SEDs are used to estimate the redshifts and discuss the physical properties of the two galaxies. In Sect. 5 we compare the two galaxies to other similar galaxies found in the literature. Section 6 gives the conclusions. We assume a Λ-cosmology with H0 = 70 km s-1 Mpc-1, ΩM = 0.3 and ΩΛ = 0.7.
2. Observations and data analysis
2.1. Observations and reduction
Herschel observations were obtained in the framework of the Herschel Lensing Survery (HLS) described by Egami et al. (2010). They include PACS data at 100 and 160 μm, and SPIRE observations at 250, 350, and 500 μm. The data reduction was made with the HIPE software as described by Rex et al. (2010) and Rawle et al. (2010).
The large APEX Bolometer Camera (LABOCA Siringo et al. 2009) is a bolometer array operating at 870 μm that is mounted on the APEX telescope in the desert of Atacama, Chile (Güsten et al. 2006). The LABOCA observations were conducted during the summer 2010. The cluster was mapped in spiral mode during 30 h, covering a circular field of ~6′ in radius. The data were reduced with the BoA1 software. The noise is not uniform over the map and the RMS is in the range 1.1–3.0 mJy, the highest values are reached at the edges of the map.
We also obtained a VLA 1.4 GHz continuum map of Abell 2667 (PI: Ivison) with an RMS of 46 μJy.
2.2. Analysis
The astrometry of all maps was corrected to align them with the VLT Ks image. All optical dropout sources of Laporte et al. (2011) were inspected in the Herschel and LABOCA images. Two of them, z1 and Y5, are detected in several FIR bands. Because IRAC/Spitzer and MIPS/Spitzer data are available for z1, the source can be followed from one band to the next one by increasing wavelength despite the decreasing resolution. Its identification is therefore robust.
For Y5 there is a larger gap in the SED owing to the lack of data between 8 μm and 100 μm, and due to the fact that it lies at the noisy edges of the 100 and 160 μm maps, where it is not detected. However, Y5 is the only source detected at 4.5 μm within a radius of 3″ (i.e., ~1/3rd of the 250 μm beam radius) around the 250 μm peak, its identification with the SPIRE detection is therefore very likely.
The fluxes are measured at the positions of the two galaxies by PSF fitting in apertures with a radius equal to FWHM/3, where FWHM is the PSF full width at half maximum, i.e., 5.6″, 11.3″, 18.1″, 24.9″, 36.6″ and 22.5″ from 100 to 870 μm. The last (LABOCA) FWHM corresponds to the APEX beam convolved by a Gaussian of 12″. The sources were deblended from the neighboring sources by subtracting PSFs at the positions of the neighbors derived from the 250 μm map. Observations at these wavelengths with these resolutions are affected by source confusion. As a consequence a measured flux cannot be directly interpreted as the true flux of a single underlying source. A correct treatment of the effect of source confusion on flux measurements (a.k.a. flux “deboosting”) requires a prior knowledge of the source counts toward low fluxes at the given wavelength. We followed the method presented by Crawford et al. (2010) based on a Bayesian analysis. For the prior source counts we extrapolated toward low fluxes the results of Berta et al. (2010) for PACS bands, Oliver et al. (2010) for SPIRE bands and Coppin et al. (2006) for the LABOCA band.
Blending affects z1 photometry at λ ≥ 250 μm and Y5 photometry at λ ≥ 500 μm. And the effect of deboosting is small (<20%), except for the 870 μm measurement of Y5, which corresponds to a 2.6σ signal and which we chose to consider as a tentative detection. The deboosted flux of Y5 at 870 μm is 1.8 ± 1 mJy for a measured flux of 2.5 ± 0.95 mJy.
None of the two sources are detected in the VLA map. The measured FIR fluxes of the sources as well as their optical-to-near-IR photometry from Laporte et al. (2011) are listed in Table 1. Thumbnails of the Herschel and LABOCA bands centered at the source positions as well as FIR SED fits are shown in the Fig. 1. Y5 is close to the border of the PACS maps where the noise is higher, hence the high upper limits.
Multi-wavelength SED of z1 (Col. 3) and Y5 (Col. 4).
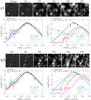 |
Fig. 1 Top figures show the thumbnails in the five Herschel bands (100, 160, 250, 350, 500 μm from left to right) and the LABOCA band (870 μm, the right-most stamp) centered on z1 and the best-fit SEDs for the low-redshift (left) and high-redshift (right) solutions. The bottom figures show the same for the source Y5. The red circle in the thumbnails is meant to guide the eye, it has a radius of 27″ and is centered on the source position. The blue curves correspond to the best-fit modified black-body SEDs with the parameters written in blue, the magenta curves correspond to the SMM J2135-0102 model (Swinbank et al. 2010; Ivison et al. 2010), the other curves correspond to the best-fit templates of the Chary & Elbaz (2001) library (red), the Vega et al. (2008) library (green), the Michałowski et al. (2010a,b) library (cyan) and the Polletta et al. (2007) library (orange). The names of the best-fit templates as well as LFIR are written in the figure with the same color codes. |
3. Analysis of the FIR SEDs
The following models or templates were fitted to the FIR measurements (cf. Fig. 1):
-
a modified black-body SED parameterized as described by Blainet al. (2003), with emissivity fixedto β = 1.5 and the Wien correction parameter α = 2.9.These values are adapted to submillimeter galaxies (SMGs; Chapman et al. 2005) and local ultraluminous infrared galaxies (ULIRGs; Dunne et al. 2000; Blain et al. 2003). The free parameters are the total FIR luminosity, LFIR, defined as the luminosity emitted in the range 8–1000 μm, and the dust temperature, Td;
-
the 105 galaxy templates built by Chary & Elbaz (2001). The templates are fitted without rescaling2;
-
ULIRG templates built by Vega et al. (2008), with a scaling parameter, LFIR;
-
the starburst, Seyfert, and active galactic nuclei (AGN) templates of Polletta et al. (2007), with a scaling parameter, LFIR;
-
templates built by Michałowski et al. (2010a,b) to fit high-redshift galaxies with detected but poorly sampled submm emission, with a scaling parameter, LFIR;
-
the SED fit to the observations of SMM J2135-0102 (Swinbank et al. 2010; Ivison et al. 2010) with a scaling parameter, LFIR.
The fit was performed by finding the maximum likelihood assuming Gaussian probability distributions for the measurements. When there is no detection, the 3-σ value is used as a hard upper limit, i.e., the probability is assumed to be uniform in the [0, 3σ] interval and zero outside. The redshifts are fixed to the solutions derived by Laporte et al. (2011) from the optical/NIR photometry, i.e., z = 1.8 and 7.6 for z1 and z = 1.7 and 8.6 for Y5. The corresponding magnification factors are μ = 1.12 and 1.17 for z1 and μ = 1.04 and 1.15 for Y5. The MIPS/Spitzer 24 μm flux of z1 (Y5 has no 24 μm data available) was taken into account to fit various galaxy templates, but ignored to fit the modified black-body because it is most likely dominated by polycyclic aromatic hydrocarbons (PAHs).
For both sources we find reasonable fits at low-redshift for the modified black-body and the various galaxy templates. A ULIRG template from the Vega et al. (2008) library, a submillimeter-detected galaxy template from the Michałowski et al. (2010a,b) library and a Seyfert template from the (Polletta et al. 2007) library are able to reproduce the 24 μm emission of z1. The modified black-body model gives dust temperatures of 34 and 36 K, for z1 and Y5 respectively, which are typical values for integrated dust temperatures in LIRGs. The infrared luminosities, LFIR, are in the range (1.2 − 1.7) × 1012 L⊙ and (3.1 − 4.7) × 1012 L⊙ for z1 and Y5 respectively. There is a noticeable agreement in LFIR between the modified black-body model and the various templates. These galaxies would therefore be typical ULIRGs/SMGs at z ~ 2. This is consistent with the general picture of galaxy evolution now widely observed, i.e., that the contribution of ULIRGs to the cosmic SFR is expected to peak at z ~ 2 where it should be comparable to that of the more “normal” galaxies (see e.g. Murphy et al. 2011).
For the high-redshift solutions (z > 7.5), instead, the modified black-body requires for both sources very high dust temperatures, i.e., 105 and 129 K for z1 and Y5, respectively. Such high temperatures averaged over an entire galaxy are extreme3. This can be seen from the impossibility to find any good fit in the different template libraries, which were built from observed galaxies. However, the dust properties of galaxies at such high-redshifts are unknown and dust temperatures above 100 K cannot be ruled out. This would imply that the FIR luminosities are on the order of 0.5 and 1.5 × 10¹⁴ L⊙ for z1 and Y5, respectively, i.e., both sources would be classified as hyper luminous infrared galaxies (HyLIRG). While the nature of HyLIRGs is still a matter of debate (e.g. Ruiz et al. 2010) and their density at very high-redshift is not well known, they are extreme sources with a lower number density than ULIRGs.
The radio continuum upper limits are too high to constrain the SED fitting. We find that for Y5 only at the low-redshift solution (z ~ 2) the Chary & Elbaz template is close to the 3σ upper limit.
Thus, in summary, by comparing the FIR photometry to known galaxy SEDs and by taking into account the expected temperature and luminosity range of high-redshift galaxies, the very high-redshift solutions derived from the optical/NIR photometry seem to be less likely than the low-redshift solution. The two sources are most likely typical ULIRGs at z ~ 2. This result puts strong constraints on the optical/NIR analysis, which gave a much higher probability to the very high-redshift solution when no prior luminosity function was taken into account. The FIR data alone, however, cannot be used to derive any accurate photometric redshift because of the redshift-temperature degeneracy.
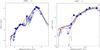 |
Fig. 2 Fits to the observed SED of source z1 (photometry shown by blue symbols, including 3σ upper limits) using different spectral templates: Chary & Elbaz (2001) (black = best-fit template, and magenta = template with maximum IR luminosity), Polletta et al. (2007) (red = global best-fit template, and green = best-fit to visible-near-IR SED excluding the thermal IR), and Michałowski et al. (2010a) (blue). The best-fit SED with the templates of Vega et al. (2008), very similar to the one using Polletta’s templates, is not shown here for simplicity. Left: global visible to sub-mm SED. Right: zoom on visible to near-IR part of the SED including for comparison also the best-fit SED at high-redshift (z = 7.5) from Laporte et al. (2011, dashed line), which is most likely excluded because of our Herschel detections. |
4. Analysis of the complete SED from visible to FIR
We will now examine all data from the visible to the FIR ranges to improve the redshift estimate of our galaxies and to examine the nature and physical properties of these sources.
4.1. Method
To model the SED of the two sources we used a modified version of the Hyperz photometric redshift code of Bolzonella et al. (2000) described in Schaerer & de Barros (2009). Non-detections are treated as the usual case 1 of Hyperz, i.e., the flux in these filters is set to zero, with an error bar corresponding to the flux at 1σ level. The basic spectral templates are taken from the Bruzual & Charlot models (Bruzual & Charlot 2003), computed for a variety of star-formation histories and metallicities.Although applicable only to a limited part of the spectrum, we use these templates here to constrain redshift, extinction, and stellar mass in particular. For the Bruzual & Charlot templates we consider variable extinction with AV up to 8 mag for the Calzetti et al. (2000) attenuation law. We also explored other extinction laws.
The code, initially designed to fit rest-frame UV to near-IR (stellar) emission, can also easily be used to include the thermal mid-IR and beyond. To cover the entire spectral range from the visible to the millimeter domain, and to compare our sources with SEDs of very different galaxy types, we compiled a great variety of spectral templates from the GRASIL models of Silva et al. (1998), the library of Chary & Elbaz (2001), Rieke et al. (2009), the starburst, Seyfert, and AGN templates of Polletta et al. (2007), the ULIRG templates of Vega et al. (2008), the sub-mm galaxy templates of Michałowski et al. (2010a), and the model fit to SMM J2135-0102 (Swinbank et al. 2010; Ivison et al. 2010). Extinction can also be added to these spectral templates; SED fits with and without additional extinction will be discussed below.
We carried out both fits of the entire SED (optical, near-IR, and IR) and fits up to 8 μm only (for the Bruzual & Charlot templates). For each template set the free parameters are redshift and (additional) AV. Physical parameters such as the infrared luminosity, LIR, defined as the luminosity emitted in the range 2–1000 μm; the IR star-formation rate, SFR; and the stellar mass, are subsequently derived from the best-fit templates. In contrast to the IR fits discussed in Sect. 3 we have no handle on the dust temperature, because this is not a parameter describing the SEDs used here. We also checked that the two independent fitting methods used here and in Sect. 3 give consistent results.
4.2. Photometric redshifts
As discussed in depth by Laporte et al. (2011), the best-fit photometric redshifts of our sources derived from the optical-to-near-IR photometry (up to 8 μm) and using standard spectral templates is consistently found at z > 7 with a lower probability at low z. This result remains unchanged with the exploration of a wider range of extinction, different attenuation/extinction laws, and template sets used here compared to Laporte et al. (2011) On the other hand, analysis of the IR SED and other arguments clearly favor low redshifts (z ~ 1.5–2.5), as discussed above. Below we therefore limit ourselves to z < 4 and attempt to refine the photometric redshift of the two sources.
4.3. Results for z1
Overall the global SED fits for this source are fairly satisfactory, as shown in Fig. 2, albeit with significant discrepancies in the optical domain (cf. below). Several templates (from Polletta et al. 2007; Vega et al. 2008; Michałowski et al. 2010a) also reproduce the 24 μm flux, and the observed 100 and 870 μm fluxes are within 2–3σ of the model. Interestingly, the best-fits for both, the Polletta and Michalowski libraries are found with templates for active galaxies.
The best-fit redshift found with these templates is between z ≈ 2.24 and 2.57. The resulting IR luminosity is LIR ~ (2.6 − 3.2) × 1012 L⊙, the corresponding SFR ≈ 450–550 M⊙ yr-1 using the standard Kennicutt (1998) calibration. Fits to the IR part with the SMM J2135-0102 template yield zphot ≈ 2.0. A somewhat lower redshift of z ≈ 1.7 is found with the Bruzual & Charlot (2003) templates using the SED up to the IRAC bands. The estimated extinction is AV ~ 2.6, the stellar mass M⋆ ~ 6 × 10¹⁰ M⊙ for the same Salpeter IMF as adopted by Kennicutt (1998). However, these values should be taken with caution because the fits are poor. For comparison, one obtains M⋆ ~ 3 × 10¹⁰ M⊙ from the absolute H-band magnitude (MB ≈ − 23.0) using the mass-to-light ratio adopted by Wardlow et al. (2011) for SMGs.
At a more detailed level (see right panel), all spectral templates have some difficulty to reproduce the steep, observed SED between the visible (I, z bands) and the near-IR (Y and J here), and they predict a flux excess in the optical domain. Below we will show that this also holds when variable extinction is added to the empirical templates. The same is also true for all other templates we examined, including the theoretical galaxy templates of Bruzual & Charlot (2003). This sharp drop is of course the reason why this source was selected as an optical dropout (Y-drop).
4.4. Results for Y5
For this source the global fits are less good than for z1. This is because Y5 shows a higher flux ratio between the thermal-IR and the near-IR than z1, whose SED already required templates with extreme IR/near-IR fluxes. For example, the Arp 220 template from Polletta et al. (2007), shown in red, underpredicts the IR flux by a factor ≳ 5. The only template coming close to the observed IR emission is from the SMG library of Michałowski et al. (2010a) (SMMJ221725.97+001238). With a best-fit redshift of zphot ≈ 2.15 this translates to LIR = 2.2 × 10¹² L⊙, corresponding to SFR ≈ 380 M⊙ yr-1. Fits to the IR part with the SMM J2135-0102 template yield zphot ≈ 1.8. A best-fit redshift of z ≈ 1.95 is found with Bruzual & Charlot (2003) templates using the SED up to the IRAC bands. The estimated extinction is AV ~ 1.6, the stellar mass M ⋆ ~ 3 × 10¹⁰ M⊙. However, these values should be taken with caution because the fits in the domain close to the optical are poor. Again, using the absolute H-band magnitude (MB ≈ −22.3), one obtains M ⋆ ~ 2 × 10¹⁰ M⊙ with the assumptions already mentioned above.
Similarly to z1, the visible-near-IR drop of the SED (see right panel) is poorly fitted by the spectral templates, predicting that the source should be detectable in the visible (I, z, Y bands in particular), in contrast to our observations. The template that fits this part of the spectrum best is an S0 template from Polletta et al. (2007), shown in green. However, this template underpredicts the IR emission by several orders of magnitudes.
4.5. Possible explanations for the strong SED break/very red spectrum
As already seen, the common, observed spectral templates fail to reproduce the steep, observed SED between the visible (I, z bands) and the near-IR (Y and J here), and they predict a flux excess in the optical domain. What causes the sharp observed decrease of the flux between the near-IR and the optical for these sources? The main difficulty arises because the largest spectral break known in galaxy spectra is the Lyman break, whereas the typically observed Balmer (or “4000 Å”) break is smaller than that of our two galaxies. We have examined various possibilities, but with no convincing answer.
For example, as shown in Fig. 4 for z1, adding variable extinction to the empirical templates allows one to diminish their optical flux excess somewhat. For the Chary & Elbaz templates, the best-fit (to the domain shown here) is then with an additional extinction ΔAV = 1.4 for the Calzetti law. However, the templates are too smooth to reproduce the apparent break. The flux at optical wavelengths can be reduced even more by assuming a steeper attenuation law than the Calzetti law adopted by default. With the SMC extinction law by Prevot et al. (1984) the best-fit is then for ΔAV = 1.2. Overall, the same difficulty remains, however. Figure 4 also shows the best-fit SED for the Bruzual & Charlot (2003) templates with the SMC law. Although it is the steepest SED between the optical and the H-band, it falls short in flux in the J-band. For completeness we also examined templates from the synthesis models of Maraston et al. (2006). As expected, these models do not yield significantly different fits in the blue part of the rest-frame optical spectrum.
As already mentioned by Laporte et al. (2011), we also attempted to fit the SEDs with our models including nebular lines (see Schaerer & de Barros 2009). Indeed, in this case the best-fit is found at z ~ 1.5 such that the [Oiii] λλ 4959, 5007 lines, and Hβ boost somewhat the J-band flux, and Hα the H-band to a lesser extent, contributing thus to the flux decrement between J and Y. However, this solution also requires a very high attenuation (AV ~ 4.0 for the SMC law) to reproduce the steeply rising SED toward longer wavelengths4. Although to the best of our knowledge objects with these red SEDs and strong emission lines are not known, this extreme explanation should be easy to test with spectroscopic observations.
Finally, could composite populations not taken into account by our models help to explain the observed SED? Certainly the theoretical SED models may suffer from this simplification. However, we do not see how this could help to resolve the problem with the large observed spectral break, because a superposition of individual simple stellar populations (not capable of reproducing this observation) can only average out spectral features. We conclude that we have no convincing explanation for the observed sharp drop of the SED of our two sources.
5. Discussion
5.1. Comparison with other objects in the literature
How do our sources compare with other known galaxies and what is their nature?
By design our sources are near-IR-selected, optical dropout sources, i.e., sources with a very red color between the J- and z-band and/or between Y and J. Our sources can therefore be compared to those selected by Capak et al. (2011) from the COSMOS survey. From their Fig. 13 we note that with (I − J) > 5.4 and 4.4 and (z − J) > 3.9 and 3.1 for z1 and Y5, both sources show extreme (very red) optical-to-near-IR colors, when compared to other low-redshift galaxies with red (J − z) colors. z1 and Y5 are also similar to the z-dropout galaxy HUDF-J2 identified by Mobasher et al. (2005) as a z ≈ 6.5 post-starburst galaxy candidate, but later shown to be most likely at z ~ 1.8–2.5 interloper by Schaerer et al. (2007); Dunlop et al. (2007); Chary et al. (2007). Although similar in several respects, HUDF-J2 shows a more monotonously rising SED between z, J, and H than our objects exhibiting a “sharper” break. The colors and fluxes of our sources are also very similar to those of the lensed optical dropout galaxy #2 found behind the cluster Abell 1835, identified with the z = 2.93 sub-mm galaxy SMMJ14009+0252 (see Schaerer et al. 2007; Weiß et al. 2009,and references therein).
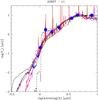 |
Fig. 4 Observed visible to near-IR part of the SED of z1 (blue circles) and best-fit models to this spectral range: using the Polletta et al. (2007) templates and no additional extinction (green line), black lines: using the Chary & Elbaz (2001) and Bruzual & Charlot (2003) templates with variable attenuation described by the Calzetti law, magenta: same as black lines, but adoption the SMC extinction law, red line (continuum) and red crosses (synthetic flux in filters): Bruzual & Charlot (2003) templates with nebular emission and SMC law, black dashed: high-redshift (z = 7.5) template from Laporte et al. (2011, dashed line). In all cases the best-fit redshift is z ≈ 1.5–1.7, except for Polletta’s templates. |
Our sources are obviously also characterized by a high IR-to-optical flux ratio, a criterion, which has been used by various authors. For example, Rodighiero et al. (2007) have studied IRAC 3.6 μm -selected sources undetected in deep optical HST images. The (K-3.6) and (z-3.6) colors of z1 and Y5 are comparable to their sources; the main difference seems to be in (H − K), where our sources are bluer than those of Rodighiero et al. (2007). z1 and Y5 appear to be related to the very dusty z ~ 2–3 sources from this study. Fiore et al. (2008) and Dey et al. (2008) have examined 24 μm selected sources with very red colors between 24 μm and the R band (S(24)/S(R) ≳ 1000). They concluded that the bulk of these sources are very luminous strongly dust-obscured galaxies (referred to as DOGs) at z ~ 2, powered by AGN and/or by starbursts. Using the I-band as a proxy for R, we obtain a flux ratio S(24)/S(R) ≳ 20 000 for z1, an extremely high flux ratio compared to the other samples. From the SED of Y5 (cf. Fig. 3), we also expect this galaxy to show a high 24 μm to optical ratio. According to the source density from Dey et al. (2008), we would have expected ~ four strongly dust-obscured galaxies down to ~0.3 mJy at 24 μm in our 45 arcmin2 field. Because the depth of our MIPS observations is similar, this value is comparable to our source density, although our selection is different. Pope et al. (2008) have also compared DOGs and sub-mm galaxies (SMGs) in the same R − K-24 μm colors, showing that ~30% of SMGs satisfy the DOG criteria, the remainder showing less extreme (i.e. bluer) colors. This confirms that the SEDs of our sources are comparable to a subset of SMGs with the most extreme optical to IR/sub-mm colors, as already seen above (Sect. 4). Our optical data are not deep enough to ascertain whether z1 and Y5 fulfill the usual criteria for extremely red objects (EROs), (R − K) ≳ 5.6 in Vega magnitudes, at least as estimated from (I − Ks).
Among known sub-mm galaxies, one source, GN10 or GOODS 850-5, stands out as having particularly extreme IR/sub-mm to visible/near-IR properties, similar to our two galaxies. Indeed, this source is undetected down to ~0.01 μJy (1σ) in the visible, shows fluxes of ~1−5 μJy in the IRAC bands (3.6–8 μm), and peaks at ~10−20 mJy around 1 mm (Wang et al. 2004, 2009; Daddi et al. 2009), quite comparable to z1 and Y5. However, GN10 remains undetected even at JHK (Wang et al. 2009), which can be explained by its higher redshift (z ~ 4), recently confirmed from CO spectroscopy (Daddi et al. 2009). The observed spectral break of GN10 found between 3.6 and 2.2 μm and other considerations (Wang et al. 2009; Daddi et al. 2009) suggests a very high attenuation of AV ≳ 4.5–5 for this source, or at least for the star-forming part of it, if hosting multiple components. If we assume constant star-formation as Daddi et al. (2009) for their SED modeling, we would infer AV ~ 3 (7.8) mag for z1 (Y5). Comparing the infrared-derived SFR with the upper limits in the rest-frame UV domain, we can also estimate the attenuation of our sources. Adopting the I-band flux as a constraint for the UV flux at ~2300–2500 Å and using the Kennicutt (1998) calibration, we obtain AV ≳ 4 mag for both sources.
Sub-mm galaxies are also known to exhibit very strong attenuation. For example, sources with Balmer decrement measurements indicate AV ~ 1–3 (Swinbank et al. 2004; Takata et al. 2006), and from SED fits (Swinbank et al. 2004) estimate AV = 3.0 ± 1.0 for their sample. Wardlow et al. (2011) find AV = 2.6 ± 0.2 from the median SED of sub-mm galaxies, but more extreme attenuations are found within the sub-mm galaxy samples (see e.g. Smail et al. 2004). Also, the extremely red object, sub-mm detected galaxy HR10 studied by Dey et al. (1999) shows AV ~ 4.5, as inferred from comparison of the IR and Hα star-formation rate. In short, although higher than the typical/median value of sub-mm galaxies, the attenuation of the sources z1 and Y5 is similar to that of some sub-mm galaxies, such as GN10 at z = 4.04 and others at lower z. Our sources are also somewhat fainter, both in the rest-frame near-IR and in the IR, than the typical sub-mm galaxies (cf. Wardlow et al. 2011). Finally, our sources stand out by their large spectral break, which – to the best of our knowledge – is unusual among intermediate-redshift sources.
5.2. The other high-z candidates of the survey
Based on our FIR detections we have identified two potential interlopers among the ten high-z candidates discovered by Laporte et al. (2011). Most of the other candidates are in crowded regions where several sources emit in the FIR and are blended with each other, making any FIR measurement impossible. Two other candidates only seem to be clean from any contamination in the MIPS, PACS and SPIRE maps, namely Y3 and Y4. They remain undetected in all bands. However, the FIR upper limits obtained do not allow us to distinguish between low and high-redshift. On the other hand we can rule out that these sources are as extreme as z1 and Y5 in their IR/sub-mm to near-IR flux ratio, because they should otherwise clearly be detected in our Herschel images.
6. Conclusions
Analyzing the FIR SED of two high-redshift dropout candidates we find that both galaxies are likely at z ~ 2 rather than z > 7. From the FIR point of view alone, both galaxies could be similar to ULIRGs or SMGs, which are common at z ~ 2. At z > 7 the SEDs would imply extreme dust temperatures and luminosities. Fitting the global SEDs considering all available data from visible to submm we estimate z ~ 1.6–2.5.
However, the optical/NIR part of both objects remains difficult to understand if at z ~ 2. They show a very strong and well-defined spectral break (presumably the Balmer break), unusual among intermediate redshift sources. The source z1 is extreme for both IR/visible and near-IR/optical colors. The source Y5 has a somewhat smaller drop between the near-IR/optical domain.
We have examined several possible explanations for the extreme colors of these galaxies, but none of them is entirely satisfactory. More observations are required to understand their nature. Once a spectroscopic confirmation of their redshift is obtained we will be able to create new SED templates.
Other extreme sources (e.g. GN10 Wang et al. 2004; Lutz et al. 2005; Wang et al. 2009; Daddi et al. 2009) were found from MIPS observations and submm searches. There could therefore be two complementary paths leading to similar, extreme sources.
Although spectroscopic confirmation is still required and not all possible interlopers may be detected in the FIR, this work shows that FIR observations can be very helpful to constrain the contamination of high-z dropout searches by lower redshift galaxies.
We found that this additional scaling parameter was not required to obtain good fits.
To our knowledge there was only one such extreme case reported so far: the host of the lensed quasar APM08279 at z = 3.9 (Weiß et al. 2007; Riechers et al. 2009). It requires two dust components at 75 and 220 K and the highest temperatures most likely result from heating by the powerful quasar.
Our model assumes identical attenuation for the continuum and nebular lines, as in Schaerer & de Barros (2009).
Acknowledgments
We are grateful to the referee for constructive comments and suggestions that helped to improve the paper. We thank the APEX staff for their aid in carrying out the observations. APEX is operated by the Max-Planck-Institut für Radioastronomie, the European Southern Observatory, and the Onsala Space Observatory This work received support from the french
Agence Nationale de la Recherche under the reference ANR-09-BLAN-0234. The work of D.S. and M.Z. is supported by the Swiss National Science Foundation. Support from ISSI (International Space Science Institute) in Bern for an International Team is gratefully acknowledged. I.R.S., R.J.I., and A.W.B. acknowledge support from STFC.
References
- Berta, S., Magnelli, B., Lutz, D., et al. 2010, A&A, 518, L30 [NASA ADS] [CrossRef] [EDP Sciences] [Google Scholar]
- Blain, A. W., Barnard, V. E., & Chapman, S. C. 2003, MNRAS, 338, 733 [NASA ADS] [CrossRef] [Google Scholar]
- Bolzonella, M., Miralles, J.-M., & Pelló, R. 2000, A&A, 363, 476 [NASA ADS] [Google Scholar]
- Bouwens, R. J., Illingworth, G. D., González, V., et al. 2010a, ApJ, 725, 1587 [NASA ADS] [CrossRef] [Google Scholar]
- Bouwens, R. J., Illingworth, G. D., Oesch, P. A., et al. 2010b, ApJ, 709, L133 [NASA ADS] [CrossRef] [Google Scholar]
- Bruzual, G., & Charlot, S. 2003, MNRAS, 344, 1000 [NASA ADS] [CrossRef] [Google Scholar]
- Calzetti, D., Armus, L., Bohlin, R. C., et al. 2000, ApJ, 533, 682 [NASA ADS] [CrossRef] [Google Scholar]
- Capak, P., Mobasher, B., Scoville, N. Z., et al. 2011, ApJ, 730, 68 [NASA ADS] [CrossRef] [Google Scholar]
- Chapman, S. C., Blain, A. W., Smail, I., & Ivison, R. J. 2005, ApJ, 622, 772 [NASA ADS] [CrossRef] [Google Scholar]
- Chary, R., & Elbaz, D. 2001, ApJ, 556, 562 [NASA ADS] [CrossRef] [Google Scholar]
- Chary, R.-R., Teplitz, H. I., Dickinson, M. E., et al. 2007, ApJ, 665, 257 [NASA ADS] [CrossRef] [Google Scholar]
- Coppin, K., Chapin, E. L., Mortier, A. M. J., et al. 2006, MNRAS, 372, 1621 [NASA ADS] [CrossRef] [Google Scholar]
- Crawford, T. M., Switzer, E. R., Holzapfel, W. L., et al. 2010, ApJ, 718, 513 [NASA ADS] [CrossRef] [Google Scholar]
- Daddi, E., Dannerbauer, H., Krips, M., et al. 2009, ApJ, 695, L176 [NASA ADS] [CrossRef] [Google Scholar]
- Dey, A., Graham, J. R., Ivison, R. J., et al. 1999, ApJ, 519, 610 [NASA ADS] [CrossRef] [Google Scholar]
- Dey, A., Soifer, B. T., Desai, V., et al. 2008, ApJ, 677, 943 [NASA ADS] [CrossRef] [Google Scholar]
- Dickinson, M., Hanley, C., Elston, R., et al. 2000, ApJ, 531, 624 [NASA ADS] [CrossRef] [Google Scholar]
- Dunlop, J. S., Cirasuolo, M., & McLure, R. J. 2007, MNRAS, 376, 1054 [NASA ADS] [CrossRef] [Google Scholar]
- Dunne, L., Eales, S., Edmunds, M., et al. 2000, MNRAS, 315, 115 [NASA ADS] [CrossRef] [Google Scholar]
- Egami, E., Rex, M., Rawle, T. D., et al. 2010, A&A, 518, L12 [CrossRef] [EDP Sciences] [Google Scholar]
- Fiore, F., Grazian, A., Santini, P., et al. 2008, ApJ, 672, 94 [NASA ADS] [CrossRef] [Google Scholar]
- Güsten, R., Nyman, L. Å., Schilke, P., et al. 2006, A&A, 454, L13 [NASA ADS] [CrossRef] [EDP Sciences] [Google Scholar]
- Ivison, R. J., Swinbank, A. M., Swinyard, B., et al. 2010, A&A, 518, L35 [NASA ADS] [CrossRef] [EDP Sciences] [Google Scholar]
- Kennicutt, Jr., R. C. 1998, ARA&A, 36, 189 [Google Scholar]
- Kovács, A., Chapman, S. C., Dowell, C. D., et al. 2006, ApJ, 650, 592 [NASA ADS] [CrossRef] [Google Scholar]
- Laporte, N., Pelló, R., Schaerer, D., et al. 2011, A&A, 531, A74 [NASA ADS] [CrossRef] [EDP Sciences] [Google Scholar]
- Lutz, D., Yan, L., Armus, L., et al. 2005, ApJ, 632, L13 [NASA ADS] [CrossRef] [Google Scholar]
- Magdis, G. E., Elbaz, D., Hwang, H. S., et al. 2010, MNRAS, 409, 22 [NASA ADS] [CrossRef] [Google Scholar]
- Magnelli, B., Lutz, D., Berta, S., et al. 2010, A&A, 518, L28 [NASA ADS] [CrossRef] [EDP Sciences] [Google Scholar]
- Maraston, C., Daddi, E., Renzini, A., et al. 2006, ApJ, 652, 85 [NASA ADS] [CrossRef] [Google Scholar]
- McLure, R. J., Dunlop, J. S., Cirasuolo, M., et al. 2010, MNRAS, 403, 960 [NASA ADS] [CrossRef] [Google Scholar]
- Michałowski, M., Hjorth, J., & Watson, D. 2010a, A&A, 514, A67 [NASA ADS] [CrossRef] [EDP Sciences] [Google Scholar]
- Michałowski, M. J., Watson, D., & Hjorth, J. 2010b, ApJ, 712, 942 [NASA ADS] [CrossRef] [Google Scholar]
- Mobasher, B., Dickinson, M., Ferguson, H. C., et al. 2005, ApJ, 635, 832 [NASA ADS] [CrossRef] [Google Scholar]
- Murphy, E. J., Chary, R., Dickinson, M., et al. 2011, ApJ, 732, 126 [NASA ADS] [CrossRef] [Google Scholar]
- Oesch, P. A., Bouwens, R. J., Illingworth, G. D., et al. 2010, ApJ, 709, L16 [NASA ADS] [CrossRef] [Google Scholar]
- Oliver, S. J., Wang, L., Smith, A. J., et al. 2010, A&A, 518, L21 [NASA ADS] [CrossRef] [EDP Sciences] [Google Scholar]
- Polletta, M., Tajer, M., Maraschi, L., et al. 2007, ApJ, 81 [Google Scholar]
- Pope, A., Bussmann, R. S., Dey, A., et al. 2008, ApJ, 689, 127 [Google Scholar]
- Prevot, M. L., Lequeux, J., Prevot, L., Maurice, E., & Rocca-Volmerange, B. 1984, A&A, 132, 389 [NASA ADS] [Google Scholar]
- Rawle, T. D., Chung, S. M., Fadda, D., et al. 2010, A&A, 518, L14 [NASA ADS] [CrossRef] [EDP Sciences] [Google Scholar]
- Rex, M., Rawle, T. D., Egami, E., et al. 2010, A&A, 518, L13 [NASA ADS] [CrossRef] [EDP Sciences] [Google Scholar]
- Richard, J., Pelló, R., Schaerer, D., Le Borgne, J., & Kneib, J. 2006, A&A, 456, 861 [NASA ADS] [CrossRef] [EDP Sciences] [Google Scholar]
- Riechers, D. A., Walter, F., Carilli, C. L., & Lewis, G. F. 2009, ApJ, 690, 463 [NASA ADS] [CrossRef] [Google Scholar]
- Rieke, G. H., Alonso-Herrero, A., Weiner, B. J., et al. 2009, ApJ, 692, 556 [NASA ADS] [CrossRef] [Google Scholar]
- Rodighiero, G., Cimatti, A., Franceschini, A., et al. 2007, A&A, 470, 21 [NASA ADS] [CrossRef] [EDP Sciences] [Google Scholar]
- Ruiz, A., Miniutti, G., Panessa, F., & Carrera, F. J. 2010, A&A, 515, A99 [NASA ADS] [CrossRef] [EDP Sciences] [Google Scholar]
- Schaerer, D., & de Barros, S. 2009, A&A, 502, 423 [NASA ADS] [CrossRef] [EDP Sciences] [Google Scholar]
- Schaerer, D., Hempel, A., Egami, E., et al. 2007, A&A, 476, 97 [NASA ADS] [CrossRef] [EDP Sciences] [Google Scholar]
- Silva, L., Granato, G. L., Bressan, A., & Danese, L. 1998, ApJ, 509, 103 [NASA ADS] [CrossRef] [Google Scholar]
- Siringo, G., Kreysa, E., Kovács, A., et al. 2009, A&A, 497, 945 [NASA ADS] [CrossRef] [EDP Sciences] [Google Scholar]
- Smail, I., Chapman, S. C., Blain, A. W., & Ivison, R. J. 2004, ApJ, 616, 71 [NASA ADS] [CrossRef] [Google Scholar]
- Steidel, C. C., Giavalisco, M., Pettini, M., Dickinson, M., & Adelberger, K. L. 1996, ApJ, 462, L17 [NASA ADS] [CrossRef] [Google Scholar]
- Swinbank, A. M., Smail, I., Chapman, S. C., et al. 2004, ApJ, 617, 64 [NASA ADS] [CrossRef] [Google Scholar]
- Swinbank, A. M., Smail, I., Longmore, S., et al. 2010, Nature, 464, 733 [Google Scholar]
- Takata, T., Sekiguchi, K., Smail, I., et al. 2006, ApJ, 651, 713 [NASA ADS] [CrossRef] [Google Scholar]
- Vanzella, E., Pentericci, L., Fontana, A., et al. 2011, ApJ, 730, L35 [NASA ADS] [CrossRef] [Google Scholar]
- Vega, O., Clemens, M. S., Bressan, A., et al. 2008, A&A, 484, 631 [NASA ADS] [CrossRef] [EDP Sciences] [Google Scholar]
- Wang, W., Cowie, L. L., & Barger, A. J. 2004, ApJ, 613, 655 [NASA ADS] [CrossRef] [Google Scholar]
- Wang, W., Barger, A. J., & Cowie, L. L. 2009, ApJ, 690, 319 [NASA ADS] [CrossRef] [Google Scholar]
- Wardlow, J. L., Smail, I., Coppin, K. E. K., et al. 2011, MNRAS, 917 [Google Scholar]
- Weiß, A., Downes, D., Neri, R., et al. 2007, A&A, 467, 955 [NASA ADS] [CrossRef] [EDP Sciences] [Google Scholar]
- Weiß, A., Ivison, R. J., Downes, D., et al. 2009, ApJ, 705, L45 [Google Scholar]
- Wilkins, S. M., Bunker, A. J., Ellis, R. S., et al. 2010, MNRAS, 403, 938 [NASA ADS] [CrossRef] [Google Scholar]
- Zheng, W., Bradley, L. D., Bouwens, R. J., et al. 2009, ApJ, 697, 1907 [NASA ADS] [CrossRef] [Google Scholar]
All Tables
All Figures
|
Fig. 1 Top figures show the thumbnails in the five Herschel bands (100, 160, 250, 350, 500 μm from left to right) and the LABOCA band (870 μm, the right-most stamp) centered on z1 and the best-fit SEDs for the low-redshift (left) and high-redshift (right) solutions. The bottom figures show the same for the source Y5. The red circle in the thumbnails is meant to guide the eye, it has a radius of 27″ and is centered on the source position. The blue curves correspond to the best-fit modified black-body SEDs with the parameters written in blue, the magenta curves correspond to the SMM J2135-0102 model (Swinbank et al. 2010; Ivison et al. 2010), the other curves correspond to the best-fit templates of the Chary & Elbaz (2001) library (red), the Vega et al. (2008) library (green), the Michałowski et al. (2010a,b) library (cyan) and the Polletta et al. (2007) library (orange). The names of the best-fit templates as well as LFIR are written in the figure with the same color codes. |
| In the text | |
|
Fig. 2 Fits to the observed SED of source z1 (photometry shown by blue symbols, including 3σ upper limits) using different spectral templates: Chary & Elbaz (2001) (black = best-fit template, and magenta = template with maximum IR luminosity), Polletta et al. (2007) (red = global best-fit template, and green = best-fit to visible-near-IR SED excluding the thermal IR), and Michałowski et al. (2010a) (blue). The best-fit SED with the templates of Vega et al. (2008), very similar to the one using Polletta’s templates, is not shown here for simplicity. Left: global visible to sub-mm SED. Right: zoom on visible to near-IR part of the SED including for comparison also the best-fit SED at high-redshift (z = 7.5) from Laporte et al. (2011, dashed line), which is most likely excluded because of our Herschel detections. |
| In the text | |
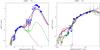 |
Fig. 3 Same as Fig. 2 for Y5. The best-fit SED at high-redshift (black dashed line) is for z = 8.28. |
| In the text | |
|
Fig. 4 Observed visible to near-IR part of the SED of z1 (blue circles) and best-fit models to this spectral range: using the Polletta et al. (2007) templates and no additional extinction (green line), black lines: using the Chary & Elbaz (2001) and Bruzual & Charlot (2003) templates with variable attenuation described by the Calzetti law, magenta: same as black lines, but adoption the SMC extinction law, red line (continuum) and red crosses (synthetic flux in filters): Bruzual & Charlot (2003) templates with nebular emission and SMC law, black dashed: high-redshift (z = 7.5) template from Laporte et al. (2011, dashed line). In all cases the best-fit redshift is z ≈ 1.5–1.7, except for Polletta’s templates. |
| In the text | |
Current usage metrics show cumulative count of Article Views (full-text article views including HTML views, PDF and ePub downloads, according to the available data) and Abstracts Views on Vision4Press platform.
Data correspond to usage on the plateform after 2015. The current usage metrics is available 48-96 hours after online publication and is updated daily on week days.
Initial download of the metrics may take a while.