| Issue |
A&A
Volume 525, January 2011
|
|
|---|---|---|
| Article Number | A86 | |
| Number of page(s) | 15 | |
| Section | Extragalactic astronomy | |
| DOI | https://doi.org/10.1051/0004-6361/201015353 | |
| Published online | 02 December 2010 | |
Two formation channels of ultra-compact dwarf galaxies in Hickson compact groups⋆,⋆⋆
1
Núcleo de Astrofísica Teórica, Universidade Cruzeiro do Sul,
R. Galvão Bueno 868,
01506–000, São Paulo, SP
Brazil
e-mail: cdarocha.astro@gmail.com
2
European-Southern Observatory, Karl-Schwarzschild Str. 2, 85748
Garching,
Germany
3
European Southern Observatory, Alonso de Cordova 3107, Vitacura, Santiago,
Chile
4
Argelander Institut für Astronomie, Universität
Bonn, Auf dem Hügel
71, 53121
Bonn,
Germany
5
Instituto de Astronomia, Geofísica e Ciências Atmosféricas,
Universidade de São Paulo, Rua do
Matão 1226, Cidade Universitária, 05508–900, São Paulo, SP,
Brazil
Received: 7 July 2010
Accepted: 15 September 2010
Context. The formation of ultra-compact dwarf galaxies (UCDs) is believed to be driven by interaction, and UCDs are abundant in the cores of galaxy clusters, environments that mark the end-point of galaxy evolution. Nothing is known about the properties of UCDs in compact groups of galaxies, environments where most of galaxy evolution and interaction is believed to occur and where UCDs in an intermediate stage in their evolution may be expected.
Aims. The main goal of this study is to detect and characterize, for the first time, the UCD population of compact groups of galaxies. For that, two nearby groups in different evolutionary stages, HCG 22 and HCG 90, were targeted.
Methods. We selected about 40 UCD candidates from pre-existing photometry of both groups, and obtained spectra of these candidates using the VLT FORS2 instrument in MXU mode. Archival HST/ACS imaging was used to measure their structural parameters.
Results. We detect 16 and 5 objects belonging to HCG 22 and HCG 90, respectively, covering the magnitude range −10.0 > MR > −11.5 mag. Their integrated colours are consistent with old ages covering a broad range in metallicities (metallicities confirmed by the spectroscopic measurements). Photometric mass estimates put 4 objects in HCG 90 and 9 in HCG 22 in the mass range of UCDs (>2 × 10⁶ M⊙) for an assumed age of 12 Gyr. These UCDs are on average 2−3 times larger than the typical size of Galactic GCs, covering a range of 2 ≲ rh ≲ 21 pc. The UCDs in HCG 22 are more concentrated around the central galaxy than in HCG 90, at the 99% confidence level. They cover a broad range in [α/Fe] abundances from sub- to super-solar. The spectra of 3 UCDs (2 in HCG 22, 1 in HCG 90) show tentative evidence of intermediate age stellar populations. The clearest example is the largest and most massive UCD (~107 M⊙) in our sample, which is detected in HCG 22. Its properties are most consistent with a stripped dwarf galaxy nucleus. We calculate the specific frequency (SN) of UCDs for both groups, finding that HCG 22 has about three times higher SN than HCG 90.
Conclusions. The ensemble properties of the detected UCDs supports two co-existing formation channels: a star cluster origin (low-luminosity, compact sizes, old ages, super-solar α/Fe), and an origin as tidally stripped dwarf nuclei (more extended and younger stellar populations). Our results imply that the UCDs detected in both groups do not, in their majority, originate from relatively recent galaxy interactions. Most of the detected UCDs have likely been brought into the group along with their host galaxies.
Key words: galaxies: groups: individual: HCG 22 / galaxies: groups: individual: HCG 90 / galaxies: dwarf / galaxies: interactions / galaxies: star clusters: general
Appendix is only available in electronic form at http://www.aanda.org
© ESO, 2010
1. Introduction
Within the past decade, a new class of compact stellar systems, called “ultra-compact dwarf galaxies” (UCDs), has been discovered in the cores of the Fornax, Virgo, Centaurus and Hydra galaxy clusters (Hilker et al. 1999; Drinkwater et al. 2000; Mieske et al. 2004; Haşegan et al. 2005; Jones et al. 2006; Evstigneeva et al. 2007b; Hilker et al. 2007; Mieske et al. 2007, 2008; Misgeld et al. 2008). UCDs are characterized by evolved stellar populations, half-light radii of 10 ≲ rh ≲ 100 pc and masses of 2 × 10⁶ < m < 108 M⊙ (Mieske et al. 2008). They are hence of intermediate nature between globular clusters (GCs) and dwarf elliptical galaxies, covering a mass range that starts at about that of ωCen up to almost M32. The dynamical M/L ratios of UCDs are on average about twice as large as those of Galactic globular clusters at the same metallicity (e.g., Dabringhausen et al. 2008; Mieske & Kroupa 2008; Forbes et al. 2008; Kruijssen & Mieske 2009; Taylor et al. 2010). This indicates that UCDs may mark the onset of dark matter domination in small stellar systems (Gilmore et al. 2007; Goerdt et al. 2008), or probe a variation of the IMF (Dabringhausen et al. 2008; Mieske & Kroupa 2008).
Several formation channels of UCDs have been discussed in the literature, of which the first two are directly related to galaxy interactions: 1) UCDs have formed from the amalgamation of many young massive star clusters in the tidal arms of gas-rich galaxy mergers (Fellhauer & Kroupa 2002); 2) UCDs are remnant nuclei of dwarf galaxies that have lost their stellar halo due to interaction with the tidal field of the galaxy cluster (Bekki et al. 2003); 3) UCDs were formed together with the main body of their host galaxies’ globular cluster system, representing the very bright tail of the globular cluster luminosity function (Mieske et al. 2004; Gregg et al. 2009); 4) UCDs originate from primordial small-scale overdensities, and they survived the galaxy cluster formation and evolution processes until the present time (Drinkwater et al. 2004).
Up to now, UCDs have mainly been observed in the cores of evolved clusters, such as Fornax, Virgo or Centaurus. These environments – being dominated by early-type galaxies – mark the end-point of galaxy evolution with relatively large velocity dispersions and low galaxy merger rates at present. A possible very young UCD progenitor has been observed in the merger remnant NGC 7252, and UCDs have also been detected in small loose groups, such as Dorado, CenA and Sombrero (Evstigneeva et al. 2007a; Hau et al. 2009; Taylor et al. 2010).
Surprisingly, no searches for UCDs have been performed in such environments where galaxy interactions and transformation occur very often, namely in compact groups of galaxies. It is therefore the proper environment to test galaxy interaction driven UCD formation scenarios. Observations and simulations are showing that great part of the galaxy evolution and “pre-processing” happens in groups (Fujita 2004; Rudick et al. 2006). Merging and subsequent infall of such groups leads to the formation of the present-day galaxy clusters. Compact groups are an environment where the evolution of galaxies occurs under the most extreme conditions, due to their high projected densities and low velocity dispersions (Hickson et al. 1992), which implies that galaxy interactions should be frequent and efficient in driving the morphological transformation of galaxies. Signs of interaction, like morphologically distorted galaxies, are frequently found in compact groups (e.g. Mendes de Oliveira & Hickson 1994), as well as star formation regions and tidal dwarf galaxy candidates (Iglesias-Páramo & Vílchez 2001; Mendes de Oliveira et al. 2001), an intragroup diffuse light (IGL) component (Da Rocha & Mendes de Oliveira 2005; Da Rocha et al. 2008) all of which shows the effects of galaxy interactions in such environments. Since the formation of UCDs is believed to be interaction driven (see above), compact groups are an ideal place to look for UCDs and test these proposed formation scenarios. Galaxies in HCGs have globular cluster systems (GCSs) typical for the host galaxy luminosity (Da Rocha et al. 2002, 2003).
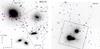 |
Fig. 1 FORS2 R-band pre-images of HCG 22 (left) and HCG 90 (right), of dimension 7 × 7′, corresponding to about 65 × 65 kpc at the distance of the groups. Blue diamonds show the spectroscopic targets and those marked with red circles are confirmed compact members of the HCGs (most in the mass range of UCDs), i.e. those with radial velocities within the group range (cf. Fig. 4). Note the difference in their spatial distribution: UCD candidates in HCG 22 are clustered around the central galaxy, while the few UCDs in HCG 90 have more dispersed distribution. Overlaid are also the HST pointings used in our analysis (WFPC2 for HCG 22 and ACS/WFC for HCG 90). Labels in HCG 22 indicate the name of the target at which the WF3 chip was centred. Physical scale and orientation are indicated in the lower left corner and are the same for both fields. A colour version of this figure, showing a high-resolution HST zoom at the dusty disk in the central 5 kpc of NGC 1199 and gas dominated spiral in HCG 90, is available as an online material. |
In this paper we present for the first time a spectroscopic search for UCDs in the two compact groups HCG 22 and HCG 90 ((m − M) = 32.6 mag for both groups, corresponding to d = 33.1 Mpc, Blakeslee et al. 2001) using the FORS2 instrument at the VLT in MXU mode, complemented with high resolution imaging from archival Hubble Space Telescope (HST) WFPC2 and ACS data.
HCG 90, as originally catalogued by Hickson (1982),
consists of four giant galaxies, the Sa NGC 7172 (HCG 90a), the E0’s NGC 7176 and 7173
(HCG 90b and c, respectively) and the irregular NGC 7174 (HCG 90d), with magnitudes in the
range MB = −20.3 and −19.8 (Hickson et al. 1989). Twelve smaller member galaxies,
fainter than Hickson’s magnitude range, were latter identified by de Carvalho et al. (1997) and Zabludoff
& Mulchaey (1998), leading to a group mean radial velocity of
2545 ± 58 km s-1 and velocity dispersion of
 (Zabludoff
& Mulchaey 1998). The group’s angular diameter is about 9′. NGC 7172 falls out
of our observed field of view. The other three galaxies show optical signs of interaction
(Mendes de Oliveira & Hickson 1994), an ionized
gas disk at NGC 7172, a common warm gas envelope at the pair NGC 7176 and 7174 (Plana et al. 1998; Castañeda & Hilker 2004) and a diffuse X-ray halo (Mulchaey & Zabludoff 1998; White
et al. 2003; Osmond & Ponman 2004). It
has also a significant component of intragroup diffuse light, constituting about 35% of its
stellar component of the observed part of the group (Da Rocha & Ziegler 2011, in prep.),
with colours consistent with old stellar population, showing that this group is in an
advanced evolutionary stage, which is in agreement with other dynamical evolution indicators
such as its crossing time (≃0.02 tHubble) and low fraction of
spiral galaxies (Hickson et al. 1992).
(Zabludoff
& Mulchaey 1998). The group’s angular diameter is about 9′. NGC 7172 falls out
of our observed field of view. The other three galaxies show optical signs of interaction
(Mendes de Oliveira & Hickson 1994), an ionized
gas disk at NGC 7172, a common warm gas envelope at the pair NGC 7176 and 7174 (Plana et al. 1998; Castañeda & Hilker 2004) and a diffuse X-ray halo (Mulchaey & Zabludoff 1998; White
et al. 2003; Osmond & Ponman 2004). It
has also a significant component of intragroup diffuse light, constituting about 35% of its
stellar component of the observed part of the group (Da Rocha & Ziegler 2011, in prep.),
with colours consistent with old stellar population, showing that this group is in an
advanced evolutionary stage, which is in agreement with other dynamical evolution indicators
such as its crossing time (≃0.02 tHubble) and low fraction of
spiral galaxies (Hickson et al. 1992).
HCG 22, as originally catalogued by Hickson (1982), consists of three giant galaxies, E2 NGC 1199 (HCG 22a) the Sa NGC 1190 (HCG 22b) and the SBcd NGC 1189 (HCG 22c), with magnitudes in the range from MB = −20.4 to −18.1 (Hickson et al. 1989). An additional smaller member galaxy was latter identified by de Carvalho et al. (1997), leading to a group mean radial velocity of 2629 ± 33 km s-1 and velocity dispersion of 40 ± 28 km s-1 (Ribeiro et al. 1998). The group’s angular diameter is about 6′. This group is in an earlier evolutionary stage, as indicated by the low number of optical signs of galaxy interaction (Mendes de Oliveira & Hickson 1994), its longer crossing time (≃0.2 tHubble), high spiral fraction (Hickson et al. 1992) and Hi content (Verdes-Montenegro et al. 2001). This group shows no signs of intragroup light, where most of the optical luminosity is concentrated on its brightest galaxy (NGC 1199). Also the X-ray emission in the group is centred on this galaxy (Ponman et al. 1996; White et al. 2000). NGC 1199, considered to be the dominant galaxy at the group centre is also the galaxy with the richest GCS among the group members.
The differences between the two groups, especially the distribution of the optical and X-ray emission (and mass, assuming light traces the mass), and the signs of recent or old interaction, are an important factor in understanding the formation mechanisms of objects like the UCDs.
2. Observations and data reduction
2.1. Observations
The spectroscopic data for this study were obtained in October/November 2008 in MXU mode
with the FOcal Reducer and Spectrograph FORS2 (Appenzeller
et al. 1998) mounted on UT1 Antu at the VLT (programme 082.A-0882, PI: Da Rocha),
using the 600B grism. FORS2 is equipped with two 2 k × 4 k MIT CCDs
(15 μm pixel size), and has a pixel scale of
 for the commonly used SR collimator position, providing a 7 × 7′ field-of-view. The 600B
grism is centred on 465 nm and provides a resolution of 0.75 Å per pixel. We adopted a
slit-width of 1′′, such that our instrumental resolution was ≃3 Å, corresponding to
R ≃ 1500 or about 200 km s-1 (in terms of
FWHM). For each mask, three exposures of 2914 s were taken, with a
total of 8742 s per mask (about 2.4 h). Figure 1
shows the 7 × 7′ FORS2 pre-images in the R-band of the two target Hickson
compact groups 22 and 90, each corresponding to a physical scale of about 65 × 65 kpc at
the adopted distance to HCG 22 and HCG 90 of 33.1 Mpc.
for the commonly used SR collimator position, providing a 7 × 7′ field-of-view. The 600B
grism is centred on 465 nm and provides a resolution of 0.75 Å per pixel. We adopted a
slit-width of 1′′, such that our instrumental resolution was ≃3 Å, corresponding to
R ≃ 1500 or about 200 km s-1 (in terms of
FWHM). For each mask, three exposures of 2914 s were taken, with a
total of 8742 s per mask (about 2.4 h). Figure 1
shows the 7 × 7′ FORS2 pre-images in the R-band of the two target Hickson
compact groups 22 and 90, each corresponding to a physical scale of about 65 × 65 kpc at
the adopted distance to HCG 22 and HCG 90 of 33.1 Mpc.
In order to measure the structural properties of our targets we have accessed HST/ACS and WFPC2 archival imaging data of the two compact groups. These images were acquired in 2006 and 2007 as part of programs GO 10554 (PI: Sharples) and GO 10787 (PI: Charlton) for HCG 90 and HCG 22, respectively. The ACS/WFC observations of HCG 90 consist of one pointing centred between the two most luminous galaxies (NGC 7173 and NGC 7176) at RA = 22h02m3s94 and Dec = −31°59′04′′34. Four dither line exposures with total integration time of 1375 and 3075 s were taken in F475W (1 × 340,3 × 345 s) and F850LP (1 × 639 774 and 2 × 831 s), respectively. The HCG 22 field was covered with four sub-pixel dithered exposures with WFPC2 totaling 1900 s (1 × 400 and 3 × 500 s) in the F450W, F606W and F814W filter set. The positions and orientation of the HST observations are overlaid on the FORS2 pre-images in Fig. 1 as well. Both, the ACS and the WFPC2 imaging programs target the star cluster populations around the galaxies of the corresponding groups. The ACS imaging exposure times were designed to reach about a magnitude beyond the GC luminosity function turnover (MV,TO ≃ −7.4 mag) while the WFPC2 observations reach about two magnitudes above (MV ≳ −9.0 mag) at signal-to-noise of 30 and 10, respectively. This makes them ideal in depth and resolution for the purposes of the current study to measure structural and photometric properties of spectroscopically confirmed UCD candidates.
2.2. Candidate selection
For both HCGs, we used deep multi-band optical photometry covering the central 7′
(65 kpc), in addition to the shallower R-band pre-imaging shown in
Fig. 1. For HCG 22, these are B
and R images taken with Keck at
≃ seeing (Da Rocha et al. 2002,see their Fig. 1). For
HCG 90, these are FORS1 archive images of one field in B,
V and R-band (programme 65.N-0547(A); Da Rocha &
Ziegler 2011, in prep.). We selected unresolved sources as UCD candidates from these deep
imaging, and re-observed the same fields in the R-band during the
pre-imaging for our MXU run to obtain accurate relative coordinates. We used the
SExtractor star-classifier to separate unresolved from resolved sources, and furthermore
performed visual inspection to cross-check the SExtractor classifications. This
restriction to unresolved sources corresponds to an upper limit of projected half-light
radius of about rh ≃ 50−60 pc at the distance of HCG 22 and
HCG 90, encompassing the size range of all but two of the known UCD population. In the
mask creation process we assigned low priorities both to objects too red to be at
redshift 0 ((B − R)0 > 2.0 mag) and very
blue objects ((B − R)0 < 0.6 mag) to
exclude foreground stars. The blue limit corresponds to a single stellar population of
1 Gyr age at metallicity [Fe/H] = −2.0 dex, or 0.5 Gyr age at metallicity
[Fe/H] = 0.0 dex, according to Worthey (1994)
and Bruzual & Charlot (2003), thus potential
UCD candidates younger than 0.5−1 Gyr were not included in our spectroscopic sample. We
further restrict to objects in the UCD magnitude regime
−14.0 < MR,0 < −10.0 mag
(19.0 < R < 23.0 mag) (Fig. 2). The faint magnitude limit overlaps with the regime of massive globular
clusters.
seeing (Da Rocha et al. 2002,see their Fig. 1). For
HCG 90, these are FORS1 archive images of one field in B,
V and R-band (programme 65.N-0547(A); Da Rocha &
Ziegler 2011, in prep.). We selected unresolved sources as UCD candidates from these deep
imaging, and re-observed the same fields in the R-band during the
pre-imaging for our MXU run to obtain accurate relative coordinates. We used the
SExtractor star-classifier to separate unresolved from resolved sources, and furthermore
performed visual inspection to cross-check the SExtractor classifications. This
restriction to unresolved sources corresponds to an upper limit of projected half-light
radius of about rh ≃ 50−60 pc at the distance of HCG 22 and
HCG 90, encompassing the size range of all but two of the known UCD population. In the
mask creation process we assigned low priorities both to objects too red to be at
redshift 0 ((B − R)0 > 2.0 mag) and very
blue objects ((B − R)0 < 0.6 mag) to
exclude foreground stars. The blue limit corresponds to a single stellar population of
1 Gyr age at metallicity [Fe/H] = −2.0 dex, or 0.5 Gyr age at metallicity
[Fe/H] = 0.0 dex, according to Worthey (1994)
and Bruzual & Charlot (2003), thus potential
UCD candidates younger than 0.5−1 Gyr were not included in our spectroscopic sample. We
further restrict to objects in the UCD magnitude regime
−14.0 < MR,0 < −10.0 mag
(19.0 < R < 23.0 mag) (Fig. 2). The faint magnitude limit overlaps with the regime of massive globular
clusters.
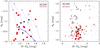 |
Fig. 2 Colour − magnitude diagrams of HCG compact members (left panel) and all preselected targets (right panel). Left panel: (B − R)0 is plotted vs. MR for spectroscopically confirmed members in the two groups. The dotted lines are model predictions for simple stellar populations from Bruzual & Charlot (2003) for a range of metallicities and ages, and a stellar mass of 2 × 10⁶ M⊙, which marks the limit between normal GCs and UCDs (e.g. Mieske et al. 2008). From left to right the lines correspond to metallicities [Z/H] = −1.6, −0.6, 0.1, and 0.4 dex. The open squares indicate ages of 2, 5, and 12 Gyr, from top to bottom. The solid (blue) line indicates the 12 Gyr isochrone for a stellar mass of 2 × 10⁶ M⊙. Right panel: analogous to the left panel, but for a wider colour − magnitude range to show the confirmed group members and the preselected targets of our survey. Filled red circles and black squares indicate the confirmed group members, the same as in the left panel. Open circles indicate all other objects that were included in the MXU masks. Sources marked by asterisks are those which were high priority candidates, according to their colour − magnitude values and morphology. Small dots indicate target sources of lower priority (colours fall outside the selection color range, or of more resolved morphology). |
For each group we designed two MXU masks containing most of the high priority candidates (Fig. 2) For each mask the planned total exposure time was 2.4 h.
For HCG 22, both of these masks were observed in service mode, yielding spectra for 54 objects, of which seven were in common between both masks for consistency check. Of the spectra for the 47 individual sources, 10 were too faint for reliable radial velocity measurement, yielding 37 successfully observed sources of which 29 were of high priority (i.e. fulfilling the colour-magnitude selection criteria as outlined above). This compared to a total number of 38 high priority sources detected on the pre-images leads to a completeness of 76% (29/38) of the high priority candidates in HCG 22 with radial velocity measurements.
Only one mask was observed for HCG 90, containing 28 objects, of which all got reliable radial velocity measurement. Twenty-three of those were high priority candidates. This compared to a total number of 47 high priority sources detected on the pre-images, makes our completeness for HCG 90 high priority candidates with measured radial velocities of 49% (23/47).
2.3. Data reduction: VLT spectroscopy
The data reduction of the MXU spectra was executed with standard IRAF routines in the TWODSPEC and ONEDSPEC packages. We performed cosmic ray rejection on each of the three raw 2D spectra for each mask, using the LACOSMIC algorithm (van Dokkum 2001). We then averaged the three single, cosmic ray-cleaned exposures without applying any further rejection algorithm. Spectrum offsets perpendicular to the dispersion direction were negligible between the three single exposures. The spectra on the combined image were extracted using the apall task in the TWODSPEC package, and wavelength calibrated using the identify and dispcor task in the ONEDSPEC package.
To measure the radial velocities of our targets, we performed Fourier cross-correlation with a template spectrum using the IRAF task fxcor in the RV package. As reference template we used a synthetic spectrum of the stellar population of a typical early-type galaxy (e.g. also Mieske et al. 2002, 2004, 2008; Misgeld et al. 2008, 2009). We double-checked the radial velocity cross-correlation measurements with an alternative old stellar population template (NGC 4636, Schuberth private communications and Schuberth et al. 2010), giving consistent results. Finally, for those sources with too low cross-correlation amplitude to derive fiducial radial velocities, the cross-correlation was repeated using a “younger” SSP template by Coelho et al. (2007) for an age of 3 Gyr and [Fe/H] = −0.5 dex. This led to the detection of one additional compact group member in HCG 22, see Sect. 3.
In Fig. 3 we show example spectra and cross-correlation results for three objects classified as group members according to their radial velocity.
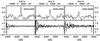 |
Fig. 3 Spectra (bottom panels) and cross-correlation results for radial velocity measurement (top panels) for three example HCG 22 compact objects covering our range of cross-correlation confidence level (from left to right), see also Table 1. |
Properties of the 16 compact stellar systems detected in HCG 22, ordered by R-band magnitude.
2.4. Data reduction: HST imaging
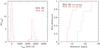 |
Fig. 4 Left panel: radial velocity histogram (corrected to heliocentric velocity) of spectroscopic targets in HCG 22 (red) and HCG 90 (black). The group members at around 2700 km s-1 are well separated from foreground stars and background galaxies with extreme velocities (not shown for clarity). Right panel: cumulative radial distance distribution of the HCG compact members relative to the central galaxies (NGC 1199 and NGC 7173 for HCG 22 and 90, respectively). The samples in this panel are restricted to the UCD mass range. The KS-test probability of both distributions having the same parent distribution is 0.9%. |
In order to perform the most accurate structural and point-spread function-fitting (PSF) photometry measurements of faint, barely resolved objects one has to properly take into account the varying pixel area across the ACS/WFC detectors. Anderson & King (2006) provide an empirically created library of fiducial PSFs which we used with the algorithms described in detail in Anderson & King (2000, 2006) and Anderson et al. (2008) to perform the PSF-fitting photometry1. PSF-fitting was performed on every single F475W and F850LP exposure using the spatially varying array of empirical PSFs, plus a “perturbation PSF” tailored to each exposure to compensate for the temporal effects of focal variations. At this stage, the catalogs contain many spurious detections (hot pixels, cosmic rays, and spurious detections along diffraction spikes). Those were eliminated by matching the coordinates of each exposure within a tolerance of 0.5 pixels. The final photometry list contains four measurements for each source per filter. The final instrumental magnitude is the goodness of fit (“qfit”) weighted average of the four measurements.
To correct for the charge transfer efficiency (CTE), which is a function of the date of
observation, object brightness, background and position, we used the latest correction
equation provided by Chiaberge et al. (2009). The
photometry was put into the ACS/WFC Vega-mag system following Bedin et al. (2005), i.e. by comparing the CTE corrected instrumental
magnitudes with the magnitudes of the same stars measured within
 aperture radius and correction from
to “infinity” using the values from Table 1 in Bedin et al.
(2005). We adopted the zero points from the latest and improved photometric
calibration of the ACS listed on the STScI website2,
which supersede the previous by Sirianni et al.
(2005). We used the ACS/WFC zero points at −77 °C since the ACS observations
were acquired in May 2006, i.e. before July 2006 when the temperature of the WFC detector
was lowered to −88 °C following the recovery of the ACS.
aperture radius and correction from
to “infinity” using the values from Table 1 in Bedin et al.
(2005). We adopted the zero points from the latest and improved photometric
calibration of the ACS listed on the STScI website2,
which supersede the previous by Sirianni et al.
(2005). We used the ACS/WFC zero points at −77 °C since the ACS observations
were acquired in May 2006, i.e. before July 2006 when the temperature of the WFC detector
was lowered to −88 °C following the recovery of the ACS.
The pipeline reduced F450W, F606W and F814W WFPC2 images retrieved from the HST archive
are bias, flat-field and bad pixel corrected images for each WFPC2 chip. The sub-pixel
dithered imaging allowed us to eliminate cosmic-rays, hot pixels and improve the spatial
resolution. For image registration we used the IRAF task wregister, with flux
conserving drizzle resampling factor of 0.8, to register the individual exposures for each
CCD chip and filter combination using the solutions recorded in the image headers. This
proved to give an extremely satisfactory final stack image, median combined from the four
exposures with the IRAF task imcombine. We cross checked the profiles of the few
stars between the original exposures and the final median combined image for each filter
and the difference in FWHM was up to ±0.02 pixels. To perform a PSF
photometry on the WFPC2 images, we created a grid of 100 × 100 PSFs with the TinyTim3 software package (Krist
1995) for each CCD chip and filter. This library was used to create a spatially
variable PSF model and perform PSF-fitting photometry with the allstar task in
IRAF. Isolated stars were used to derive aperture correction to
 aperture diameter which is the aperture used by Dolphin
(2009) to derive the most up to date CTE corrections and photometric zero points
for each of the WFPC2 chips.
aperture diameter which is the aperture used by Dolphin
(2009) to derive the most up to date CTE corrections and photometric zero points
for each of the WFPC2 chips.
Finally, the ACS and WFPC2 photometry, calibrated to the Vega-magnitude, was corrected for foreground extinction estimated from the Schlegel et al. (1998) dust maps toward the direction of both groups. The estimated Galactic extinction is E(B − V) = 0.026 and 0.055 mag for HCG 90 and 22, respectively. We used the Cardelli et al. (1989) relations and RV = 3.1 to calculate the absorption at the effective wavelengths for the ACS/WFC and WFPC2 filters. Thus the following dereddening values were applied for the HCG 90 ACS images: AF475W = 0.104, AF850LP = 0.039 mag and for the HCG 22 WFPC2 images: AF450W = 0.237, AF606W = 0.170 and AF814W = 0.112 mag. The result is shown in the colour − magnitude and colour − colour diagrams (Figs. 5 and 6) and discussed in Sect. 3.1.
Properties of the 5 compact stellar systems detected in HCG 90, ordered by R-band magnitude.
Photometric and structural properties of HCG 22 UCD candidates from the HST imaging.
2.4.1. Measuring structural parameters of UCD candidates
Measuring structural parameters of UCD candidates in HCG 22 and HCG 90 is feasible
thanks to the supreme resolution of the ACS and WFPC2 cameras of
 and
and  pixel-1,
corresponding to ~8 and 16 parsecs at a distance of 33.1 Mpc, respectively.
Therefore, and due to the very well characterized PSF over the ACS/WFPC2’s
field-of-view, extended objects with half-light radius of only a few parsec will be
measurable, allowing to resolve objects down to typical GC sizes. To derive the
rh of the UCD candidates in our sample from the ACS
images, we generated a ten times subsampled PSF from the Anderson & King (2006) ACS/WFC ePSF library. Each PSF is tailored to the
position on the chip for every object measured. This PSF was used with ishape
of the baolab software package4
(Larsen 1999) which models the object profile
with an analytical function convolved with a (model) PSF. We modeled all objects with
King profiles with concentrations of tidal-to-core radius of
rt/rc = 5,15,30 and 100 and
adopted the structural parameter measurements from the best
χ2 fit model. The output is the FWHM
along the object semi-major axis. It is converted to
Reff using the coefficients relating those two values, as
prescribed in the baolab manual. This Reff needs to
be corrected for object ellipticity and brought to the geometrically mean value
(“effective” rh) by multiplying by the square root of the
major/minor axis ratio (details see Eq. (1) in Georgiev
et al. 2008).
pixel-1,
corresponding to ~8 and 16 parsecs at a distance of 33.1 Mpc, respectively.
Therefore, and due to the very well characterized PSF over the ACS/WFPC2’s
field-of-view, extended objects with half-light radius of only a few parsec will be
measurable, allowing to resolve objects down to typical GC sizes. To derive the
rh of the UCD candidates in our sample from the ACS
images, we generated a ten times subsampled PSF from the Anderson & King (2006) ACS/WFC ePSF library. Each PSF is tailored to the
position on the chip for every object measured. This PSF was used with ishape
of the baolab software package4
(Larsen 1999) which models the object profile
with an analytical function convolved with a (model) PSF. We modeled all objects with
King profiles with concentrations of tidal-to-core radius of
rt/rc = 5,15,30 and 100 and
adopted the structural parameter measurements from the best
χ2 fit model. The output is the FWHM
along the object semi-major axis. It is converted to
Reff using the coefficients relating those two values, as
prescribed in the baolab manual. This Reff needs to
be corrected for object ellipticity and brought to the geometrically mean value
(“effective” rh) by multiplying by the square root of the
major/minor axis ratio (details see Eq. (1) in Georgiev
et al. 2008).
Measurements of the structural parameters of UCD candidates on the WFPC2 images were performed in an analogous way as for the ACS, but PSFs at the objects’ position were generated with the TinyTim for the F606W filter. Generating ten times subsampled PSFs with TinyTim does not include a convolution with charge diffusion kernel (CDK), which additionally smears the stellar PSF. The CDK available within TinyTim is applicable in the 500−600 nm range (F555W filter), therefore, we restricted our measurements only to the F606W filter and did not perform measurements for the rest of the filters.
We finally note that reliable rh measurements with ishape are performed for objects with S/N > 20 (Larsen 1999). The UCD candidates in the HCG 22 have signal-to-noise in the range 20 < S/N < 80 and the UCD candidate in HCG 90 has S/N = 86.
3. Results
Photometric and structural properties of HCG 90 UCD candidates from the HST imaging.
In Fig. 4 we show a histogram of the measured radial velocities (corrected to heliocentric velocity). We detect five members of HCG 90 and 16 members of HCG 22. Four other sources were found to be background galaxies at significantly higher redshift than the HCGs. All other targets turned out to be foreground stars. We note that one of the 16 members in HCG 22 (HCG22_UCD011) was detected only via cross-correlation with the intermediate age (3 Gyr) SSP template (Coelho et al. 2007), instead of the reference old stellar population template. Besides for excluding very young objects, our selection criteria were satisfactorily efficient, in the UCD richer group (HCG 22), more than 50% of the high priority targets we indeed objects belonging to the group.
The properties of all compact objects are summarized in Tables 1 to 4. They span absolute magnitude ranges of −10.4 > MR > −11.1 mag for HCG 90 and −10.0 > MR > −11.5 mag for HCG 22. Their positions within the groups are shown with large open (red) squares on the pre-images in Fig. 1. The HCG 22 UCD candidates are clearly clustered around the group dominant galaxy NGC 1199, while the distribution in HCG 90 is more uniform over the group area.
Their R vs. (B − R)0 colour − magnitude distribution are shown in Fig. 2. In the left panel of Fig. 2 are shown model predictions from Bruzual & Charlot (2003) in the colour-magnitude range of objects at the approximate mass limit of 2 × 10⁶ M⊙ between normal GCs and UCDs, for a range of metallicities and ages. Assuming a 12 Gyr stellar population, 9 of the 16 objects in HCG 22 are in the UCD mass range range, with MR ≲ −10.4 mag. For HCG 90, four of the five objects are in the UCD mass range range. The colour range 1.1 < (B − R)0 < 1.65 mag of the HCG compact members is consistent with them being old and covering a range of metallicities −1.7 ≲ [Fe/H] ≲ 0.2 dex. We note, however, that moderately metal-rich and young objects of a few Gyr would also still fall in the observed colour window.
In the colour − magnitude diagrams (CMDs) in Fig. 2 we also indicate the data of all candidate compact objects, and all objects that were observed with the MXU masks. The group member detections, indicated as filled circles, concentrate towards the faint end of our survey. We have not found very massive UCD candidates with MR ≃ −14.0 (≃108 M⊙) as seen in the Fornax and Virgo galaxy clusters, nor presumably young UCDs among the blue candidates in the covered colour range.
In Sect. 3.1, we present the sizes and colours derived for a sub-sample of UCD candidates from HST imaging. In Sect. 3.2 we analyze the kinematics and spatial distribution of the UCD candidates, and in Sect. 3.3 we discuss their stellar populations.
3.1. Sizes and colours from the HST imaging data
Important constraints on the nature of the detected UCD candidates can be obtained from the high resolution HST imaging. In Figs. 5 and 6 we show the colour and magnitude distributions of all measured objects in the ACS/WFC and WFPC2 fields of view. In Fig. 7 are shown the half-light radius measurement as a function of object luminosity and colour for all objects with spectroscopy in our sample. Here we focus our discussion on the properties of the UCD candidates preselected from the spectroscopic sample.
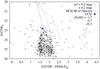 |
Fig. 5 Colour − magnitude diagram of all sources in the HCG 90 WFC/ACS field of view. The UCD candidate is indicated with a solid pentagon while large open circles indicate all sources for which spectroscopy is available. For comparison, GALEV SSP model isometallicity tracks are shown with lines for three fiducial metallicities (Anders & Fritze-v. Alvensleben 2003; Kotulla et al. 2009), as indicated in the figure’s legend. The models luminosities are for a cluster of 5 × 10⁶ M⊙. |
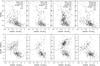 |
Fig. 6 Top row: colour − magnitude diagrams for all objects (dots) in HCG 22 for each of the four WFPC2 pointings. The legend for each CMD indicates the galaxy/region at which the WF3 chip was centred. Bottom row: colour − colour diagrams of all sources (dots) with photometry for the same fields. In all panels the open circles indicate the objects with spectroscopy while the open squares are the UCD candidates. The description of the SSP isometallicity tracks is the same as in Fig. 5. |
All UCD candidates are consistent with the expectations from simple stellar population (SSP) evolutionary models (GALEV5 by Anders & Fritze-v. Alvensleben 2003; Kotulla et al. 2009) for old ages and the entire range in metallicities. The comparison in Fig. 5 between the only UCD candidate (HCG90_UCD005) within the ACS field of HCG 90 and the SSP model with a mass of 5 × 10⁶ M⊙, shows that the UCD candidate can be as massive as ~107 M⊙. This is consistent with the estimate obtained from the ground-based photometry in Fig. 2, indicating that HCG90_UCD005 falls in the transition mass regime between UCDs and GCs. Its light profile is best fit by a King model with concentration c = rt/rc = 100 and a half-light radius of rh = 3.13 pc. The rh is typical for GCs, and thus HCG90_UCD005 morphologically classifies rather as a star cluster than as a UCD. Unfortunately, it has too low S/N spectrum for quantitative abundance analysis. This object is indicated by a solid pentagon in Fig. 7. The other brighter sources with spectra (circles in Fig. 5) are foreground stars which is further confirmed by their rh ≃ 0 pc, i.e. their PSF is indistinguishable from a stellar PSF (cf. Fig. 7).
Figure 6 shows the colour − magnitude and colour − colour diagrams of sources in the four HST/WFPC2 pointings covering most of HCG 22. We have labeled these fields with the name of the target at which the WF3 chip was centred. These are the galaxies in this group (the brightest NGC 1199, NGC 1189 and NGC 1190) and one pointing in between them. Ten of the 16 HCG 22 UCD candidates are within the WFPC2 fields. Nine of those are within the NGC 1199 pointing, the other in the mid-group pointing. All of them are brighter than the 5 × 10⁶ M⊙ SSP models (see also Fig. 2), thus falling into the mass range of UCDs. The most luminous UCD candidate has an inferred mass of ≃107 M⊙. We note that the dynamical M/L ratios of UCDs in other environments have been found to be 50−100% above predictions from SSP models (e.g., Mieske et al. 2008; Dabringhausen et al. 2008), and are on average around M/L = 4−5. Adopting this average M/L ratio instead of M/L ~ 3 characteristic for the SSP models in Fig. 5 and also typical for the most metal-rich Galactic GCs, the implied mass range of our UCD candidates would extend to about 50% larger values up to ~2 × 10⁷ M⊙.
The candidates have a broad range of half-light radii 2 < rh < 21 pc with a mean of rh = 7.4 ± 1.5 pc. That is, they are on average 2−3 times larger than typical GCs and up to four times more massive than ωCen, hence they can be classified as UCDs. It is interesting to note the apparent concentration of blue objects on the NGC 1189 and “Mid Group” colour − colour diagrams (bottom row the left and right most panels). NGC 1189, covered by the “Mid Group” WFPC2 field, is a face-on, active star-forming SBcd which is the group brightest galaxy in UV wavelengths (Tzanavaris et al. 2010). Therefore, young objects, like unresolved star-forming regions, young star clusters are expected to be present in our color-magnitude diagrams. NGC 1190 and 1199 are considered as passive galaxies and the absence of blue (young) sources is expected.
The photometric and structural properties of the observed UCD candidates are summarized in Tables 3 and 4.
3.2. Kinematics and spatial distribution
For HCG 22, the mean velocity and dispersion of the 16 HCG compact members are
vmean,HCG 22 = 2664 ± 47 km s-1 and
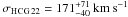 , where σ was corrected
for internal errors using Danese et al. (1980) and
the stated errors correspond to a 90% confidence interval. For HCG 90, the values
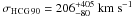
are vmean,HCG 90 = 2608 ± 109 km s-1 and
, where σ was corrected
for internal errors using Danese et al. (1980) and
the stated errors correspond to a 90% confidence interval. For HCG 90, the values
are vmean,HCG 90 = 2608 ± 109 km s-1 and
 . The mean radial velocities are in good
agreement with the group values,
vmean,HCG 22 = 2629 ± 33 km s-1 and
vmean,HCG 90 = 2545 ± 58 km s-1 (Ribeiro et al. 1998; Zabludoff & Mulchaey 1998). The velocity dispersions for the UCD candidates
in HCG 90 agrees well with the group value (Zabludoff
& Mulchaey 1998) showing no kinematical decoupling from the overall galaxy
population, while the dispersions for candidates in HCG 22 is considerably higher than the
group value (40 ± 28 km s-1Ribeiro et al.
1998), being more consistent with the internal velocity dispersion of NGC 1199
(207 ± 21 km s-1Prugniel & Simien
1996).
. The mean radial velocities are in good
agreement with the group values,
vmean,HCG 22 = 2629 ± 33 km s-1 and
vmean,HCG 90 = 2545 ± 58 km s-1 (Ribeiro et al. 1998; Zabludoff & Mulchaey 1998). The velocity dispersions for the UCD candidates
in HCG 90 agrees well with the group value (Zabludoff
& Mulchaey 1998) showing no kinematical decoupling from the overall galaxy
population, while the dispersions for candidates in HCG 22 is considerably higher than the
group value (40 ± 28 km s-1Ribeiro et al.
1998), being more consistent with the internal velocity dispersion of NGC 1199
(207 ± 21 km s-1Prugniel & Simien
1996).
In HCG 22, we detect about twice as many UCD candidates as in HCG 90 (9 vs. 4), but taking into account the lower completeness for HCG 90 (76% for HCG 22 and 49& for HCG 90), this difference is not significant. Figure 1 shows that the compact objects in HCG 22 appear to be more strongly clustered around the group’s central galaxy than is the case for HCG 90, a possible evidence of their origin being associated to processes related to its central galaxy (NGC 1199). In Fig. 4 right panel, we compare the cumulative radial distance distribution of UCD candidates in HCG 22 and HCG 90 with respect to the central galaxy (NGC 1199 and NGC 7173 for HCG 22 and 90, respectively). Applying a Kolmogorov-Smirnov-test (KS test), the probability that the HCG 22 and HCG 90 radial distance distributions are drawn from the same parent population is only 0.9%. This result confirms the visual impression of a stronger clustering in HCG 22. We note that our magnitude cut for excluding objects in the GC magnitude range excludes the HCG 90 source with closest projected distance to the central galaxy. Including this object into the KS test still yields a probability of only 4%.
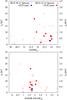 |
Fig. 7 Distribution of the half-light radius in parsecs (left axis) and
pixels of |


3.3. Stellar populations
We have measured Lick line indices for all the compact group members detected, using the passband definitions from Trager et al. (1998), having smoothed the spectra to match the 9 Å Lick system resolution. From measurements of six Lick standard stars taken in the same setting and smoothed in the same way, we could not detect any significant deviation between tabulated Lick line index values and our measurements down to a level of ~0.1 Å. Given the much larger measurement errors of our science targets (see below) we therefore do not apply any correction.
A commonly used metallicity sensitive index is ⟨ Fe ⟩ = 0.5 × (Fe5270 + Fe5335). In the following, we only show and discuss measurements for which the statistical uncertainty of the ⟨ Fe ⟩ index is less than 0.5 dex, as determined from the photon counts in the object and sky spectra. Tables 1 and 2 show the line index estimates for the five sources in HCG 22 and three sources in HCG 90 with errors below 0.5 dex.
We also indicate an estimate of the corresponding [Fe/H] . For this we use for [Fe/H] < −0.4 dex the empirical calibration between [Fe/H] and [MgFe] derived by Puzia et al. (2002) from galactic GCs. For [Fe/H] > −0.4 dex we adopt an extrapolation of the form [Fe/H] ∗ = a + b × log (MgFe) that matches the calibration for [Fe/H] < −0.4 dex (see also Mieske et al. 2007).
In Fig. 8 we show diagnostic plots for age and alpha abundances, using model predictions from Thomas et al. (2003). From the left panel it can be seen that the two most metal-rich UCD candidates in either groups, appear most consistent with super-solar alpha abundances of 0.3 to 0.5 dex. Furthermore, in the age diagnostic plot in the right panel, it is clear that all three UCD candidates in HCG 90 are most consistent with old ages of around a Hubble time. For HCG 22, object HCG22_UCD002 is inconsistent with an old age of 12 Gyr, indicating the presence of an intermediate age stellar population. The other sources have too large error bars to make strong statements.
To further investigate the possibility of intermediate age UCDs, we show in Fig. 9 the ratio of the cross-correlation amplitude of our reference old stellar template (see also Mieske et al. 2002, 2004, 2008; Misgeld et al. 2008, 2009), and the intermediate age stellar template of 3 Gyrs and [Fe/H] = −0.5 dex dex from Coelho et al. (2007). We define this ratio as ψ12/3 = log (XcorAmp(12Gyr)/XcorAmp(3Gyr)). Sources which are better fit by the old stellar template lie above the (dashed) identity line, while sources fit better by the intermediate age template lie below the line. There are two UCD candidates, HCG22_UCD011 and HCG90_UCD004, which are distinctively better fit by the intermediate age stellar template. Those two sources are good candidates for intermediate age UCDs. Unfortunately, the spectra were not of sufficiently high S/N to investigate this possibility via line index measurements. It is noteworthy that HCG22_UCD002 is, after HCG22_UCD011, the source with the second best intermediate age fit in HCG 22. This supports the indications from line index measurements that this object also contains intermediate age stellar populations. On average, UCDs in HCG 90 are fit slightly better by the intermediate age stellar template than UCDs in HCG22 (cf. Fig. 9).
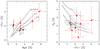 |
Fig. 8 Lick line index diagnostic plots for a sub-sample of the compact group members with high enough S/N (error in ⟨ Fe ⟩ index below 0.5 dex). Left panel: diagnostic plot for alpha abundances, plotting ⟨ Fe ⟩ vs. Mgb index. We show lines of identical alpha abundances for both age of 12 Gyr (solid line) and 4 Gyr (dashed line), using the model predictions of Thomas et al. (2003). The two most metal-rich members of either group appear to have super-solar alpha abundances. Right panel: diagnostic plot for age estimation, plotting Hβ vs. ⟨ Fe ⟩ index for four different ages 12, 7, 3, and 1 Gyr from bottom to top (solar α-abundance). The three UCDs in HCG 90 appear consistent with very old ages, as do the two HCG 22 UCDs HCG22_UCD001 and HCG22_UCD005 (see Tables 1 and 2). Numbers on the symbols are the ID of each object, where the prefixes were omitted for clarity. |
4. Discussion and conclusion
4.1. Summary of the results
Before proceeding with the discussion, in the following we present a summary of the main results.
-
1.
We detected 16 and 5 objects belonging toHCG 22 and HCG 90,respectively. They cover the magnitude range −10.0 > MR > −11.5 mag for HCG 22 and −10.4 > MR > −11.1 mag for HCG 90. Their coloursare consistent with old stellar populations covering a broad rangeof metallicities. Metallicity estimates from line indexmeasurements for a sub-sample of objects with sufficiently high S/Ncover a range of −1.0 ≲ [Fe/H] ≲ 0.3 dex.
-
2.
Photometric mass estimates using Bruzual & Charlot (2003) put four objects in HCG 90 and nine objects in HCG 22 in the mass range of UCDs (>2 × 10⁶ M⊙) for an assumed age of 12 Gyr.
-
3.
The detected objects are on average 2−3 times larger than the average size of Galactic GCs, covering a range of 2 ≲ rh ≲ 21 pc.
-
4.
The mean velocities of the UCDs agree with the galaxy group values. The velocity dispersion of HCG 90 UCDs is similar to that of the galaxies in the group, while the velocity dispersion of HCG 22 UCDs is more consistent with the internal dispersion of NGC 1199.
-
5.
The UCDs in HCG 22 are more concentrated around the central galaxy than in HCG 90, at the 99% confidence level.
-
6.
We find two UCDs in HCG 22 and one in HCG 90 with evidence for an intermediate age stellar population (3−5 Gyr), based on spectral cross-correlation with old and intermediate age templates and Lick line index measurements. The clearest example for this is the largest and most massive UCD (~107 M⊙) in our sample, detected in HCG 22.
4.2. The newly detected UCDs in the group context
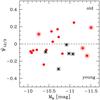 |
Fig. 9 Absolute magnitude of confirmed cluster members (HCG 22 are filled red circles, HCG 90 are black squares) vs. the ratio between the cross-correlation amplitude using our reference old stellar template and an intermediate age template (3 Gyrs, [Fe/H] = −0.5 dex; Coelho et al. 2007). Negative to positive values indicate spectra better fit by young to old ages, respectively. Objects marked are the ones with cross-correlation confidence level higher than 5. |
The spatial distribution of UCDs in each group is not discrepant with the respective distribution of the overall light (and stellar mass) in each group. HCG 22 is a very concentrated structure with three galaxies and NGC 1199 represents about 75% of the group’s luminosity. Hence the concentration of UCDs around NGC 1199 is not too surprising, since even a component associated to the group’s potential would mainly be distributed around this galaxy, as is its GCS (Da Rocha et al. 2002). In contrast, HCG 90 has a much more uniform luminosity distribution, where the difference between the brightest and the faintest galaxy is less than 10% of the total group luminosity and the brightest component is the IGL, in which the three studied galaxies and the UCDs are embedded. The more uniform mass/light distribution is reflected by the spatial distribution of the UCDs found in this group.
How does the specific frequency of UCDs (number of UCDs normalized by the total light of the group in the B-band) in either group compare? This quantity can be useful to compare the richness and/or formation efficiency of UCDs in different galaxy groups and clusters. We define the UCD specific frequency normalized to MB = −20 mag, hence SN,UCD = NUCD × 100.4 × (MB + 20). This normalization results in UCD specific frequencies of comparable numerical values to GC specific frequencies, yielding for example SN,UCD ≃ 1 for the case of a single UCD in an L∗ galaxy. For our purposes we need to restrict the group luminosity estimate in HCG 90 to the 3 of the 4 group galaxies covered by our survey, but include the diffuse intragroup light fraction of ~35% which was not taken into account by Hickson et al. (1989). Assuming the same distance modulus (m − M) = 32.6 mag for both groups, we find a total B-band luminosity of MB = −21.5 mag for HCG 90 within our survey area, and MB = −20.7 mag for HCG 22 (Hickson et al. 1989). Taking into account the number of 4 and 9 UCDs found in either group and the corresponding survey incompleteness, we get SN,UCD,HCG 90 = 2.0 ± 1.0 and SN,UCD,HCG 22 = 6.3 ± 2.1. This difference of about a factor of three indicates that the formation process of UCDs has been more efficient in HCG 22 than in HCG 90.
We can extrapolate the GC luminosity function (GCLF) estimated for NGC 1199 in HCG 22 (Da Rocha et al. 2002) to the magnitude range investigated by us to get an idea how many GCs we should expect to detect. The GCLF of NGC 1199 can be described by a Gaussian with a turnover magnitude of MV = −7.33 and a dispersion of σ = 1.40 (Harris 2001), and the whole GCS has an estimated total number of objects of 314 ± 105. With our survey we probe about 6.7% of the GCLF and that corresponds to 16 ± 4 objects in the observed area. This matches the number of 16 compact stellar systems we have detected (21 if corrected for incompleteness) in HCG 22. Hence, we do not detect an overabundance of bright compact objects with respect to an extrapolated GCLF. The magnitude of the brightest UCD detected in either group (MV ≃ −11 mag) is typical for the luminosity of the brightest compact object found in galaxies that fall in the same luminosity range −21 ≲ MV ≲ −20 mag as the ones investigated here (Hilker et al. 2008). In the Local Group, GCs/UCDs brighter than MV = −9.5 (approximately the faint limit for our sample) are of comparable abundance to that found in the two HCGs: there are two objects in the Galaxy (Harris 1996) and between five and ten objects in M 31 (Barmby et al. 2000) depending on the distance modulus adopted. Even though the studied groups are about twice as large as the Local Group, given the uncertainties, the number of bright GCs/UCDs is of the same order.
The abundance of “alpha elements” ([α/Fe]) is an indicator of the star formation time scales and can help to distinguish between different formation channels of UCDs. Globular clusters, on average, have super-solar [α/Fe], being “alpha enhanced” (Puzia et al. 2006; Colucci et al. 2009; Woodley et al. 2010; Taylor et al. 2010), reflecting their short formation time-scales. UCDs present a broader range of [α/Fe] abundances which varies as a function of environment (Mieske et al. 2007; Hau et al. 2009). In Fig. 8 it is shown that from our eight UCDs with Lick index measurements, one in each HCG presents slightly sub-solar [α/Fe] abundances. Five further objects (three in HCG 22 and two in HCG 90) show super-solar abundance, and one object HCG22_UCD001 has solar abundance. Interestingly, the one UCD in HCG 22 with sub-solar abundance is HCG22_UCD002 is the largest UCD (rh ≃ 21 pc) and the only one with a spectroscopic age estimate clearly below 12 Gyr. This is consistent with a scenario where this object has been able to form stars over a prolonged period of time until only a few Gyrs ago. Among all compact objects detected, the properties of HCG22_UCD002 differ most from those of normal GCs.
4.3. UCD formation
The formation channels discussed for UCDs can be broken down in two distinct concepts:
-
UCDs are the tidally stripped remnants of extended dwarf galaxies, hence of galactic origin and tracing the tidal disruption of low-mass cosmological substructures.
-
UCDs were formed together with the main body of their host galaxies’ star cluster system, representing the very bright tail of the globular cluster luminosity function (Mieske et al. 2004; Gregg et al. 2009). This encompasses both the formation of metal-rich UCDs in galaxy mergers (Ashman & Zepf 1992) – possibly as clusters of star clusters (Fellhauer & Kroupa 2002) – and the ’primordial’ channel (Drinkwater et al. 2004) for the formation of metal-poor compact objects.
To better distinguish between the star cluster and galactic origin of UCDs, stellar populations are the key. (Merged) star clusters should likely have simple and single stellar populations, corresponding to the individual clusters out of which they merged, which likely all formed in the same giant molecular cloud. Moreover, they should have short star formation time-scales and therefore be enhanced in α elements. In contrast, compact objects that formed within a deeper dwarf galaxy potential are more prone to prolonged and multiple star formation episodes, e.g. due to gas-infall. Our results indicate a broad range of [α/Fe] abundances for the UCDs detected covering sub-solar to well super-solar values. One UCD candidate in each group appears to have sub-solar alpha abundances, such that these two are the most promising stripped dwarf galaxy candidates. This especially holds for the HCG 22 UCD, which in addition to the alpha decrement has evidence for intermediate age stellar populations and is comparably large rh ~ 21 pc. Supporting this scenario, the faint end of the luminosity function of galaxies in compact groups is known to be underpopulated (Hunsberger et al. 1998; Mendes de Oliveira & Bolte 1999).
Focusing specifically on the creation of UCDs in galaxy mergers, HCG 90 has an interaction process happening between the three galaxies in our targeted region, HCG 90b, c and d, with evidences of exchange of gas and gas disks with overlapping rotation curves (Plana et al. 1998; Castañeda & Hilker 2004). This likely has originated the IGL component, could have formed young star clusters, and also distributed pre-existing objects into the IGM. Our results imply that there is a relatively low number of UCDs in HCG 90 in the age range of 0.5 Gyr and older, and that they are most consistent with ages of around a Hubble time. We can thus conclude that before the very last 1−2 galaxy passages, no significant population of UCDs was formed in HCG 90. We are not sensitive to very young objects created after this. Hence, for HCG 90 our results are not sufficiently conclusive to support or disfavour the merger scenario. HCG 22 does not present clear signs of ongoing interaction. However, NGC 1199 presents a central dust lane in its centre similar to the more local case of NGC 5128 (CenA) of approximately 3 kpc and about 107 M⊙ (Nieto 1983; Sparks et al. 1985; Veron-Cetty & Veron 1988; Finkelman et al. 2010). This is a quite strong indication of a gas-rich merger, old enough to have settled in a single remanent, that likely has triggered the formation of star clusters. The specific frequency of UCDs in HCG 22 appears to be a few times higher than in HCG 90, which is hence consistent with a scenario where the UCD population in HCG 22 was enhanced by this merger episode.
We conclude that the UCD population detected in each group does in their majority not originate from relatively recent galaxy interactions, but that rather most of the detected UCDs have been brought into the group together with their host galaxies. While the analysis of the objects in HCG 90 seem to favor a formation model where the main process happens on the group potential, the results for HCG 22 seem to favor models where the UCDs are formed in processes happening in the galaxy potential, either primordial or merger induced.
This and the existence of at least 1−2 massive and large UCDs with intermediate ages points to the origin of UCDs being associated to different formation processes and not a universal one.
Future investigations in this context should focus on the search for very young UCD progenitors (few 100 Myr) by targeting HCGs with small crossing time scales and extending the search to bluer colours.
Online material
Appendix A: High resolution colour view of our observed fields
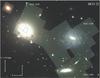 |
Fig. A.1 Colour composite image of HCG 22 with Keck B and R-band (Da Rocha et al. 2002) and HST/WFPC2 F450W, F606W and F814W filters. A zoom in (20 × 20′′) showing the dust lane in NGC 1199 can be seen in the upper left corner. As in Fig. 1, blue diamonds indicate the targeted objects in our masks and red circles indicate the HCG compact members. Field of view is 7 × 5′. |
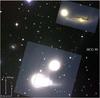 |
Fig. A.2 Colour composite image of HCG 90 with FORS B, V
and R-band and HST/ACS F475W and F850LP
filters. A zoom in ( |

Zero points and details on the new calibrations can be found on http://www.stsci.edu/hst/acs/analysis/zeropoints.
TinyTim properly takes into account the significant variation of the PSF as a function of wavelength (filter) caused by the expanding of diffraction structures with increasing wavelength, position-dependent changes of the shape of the PSF, aberrations, focus offsets between cameras (WFs and PC1 for WFPC2) and wavelength dependent charge diffusion. See also http://www.stsci.edu/software/tinytim/.
We used the most recent release of baolab found on http://www.astro.uu.nl/~larsen/baolab/.
Acknowledgments
We thank the referee Prof. Michael Drinkwater for his comments. C.D.R. would like to thank the Núcleo de Astrofísica Teórica at the Universidade Cruzeiro do Sul for their hospitality, and the support from the Deutsches Zentrum für Luft- und Raumfahrt, DLR (project number 50 OR 0602) and from the Deutsche Forschungsgemeinschaft, DFG (project number ZI 663/8–1) within the Priority Program 1177 (SPP/DFG). I.G. is thankful for the financial support through DFG-Projekt BO-779/32-1.
References
- Anders, P., & Fritze-v.Alvensleben, U. 2003, A&A, 401, 1063 [NASA ADS] [CrossRef] [EDP Sciences] [Google Scholar]
- Anderson, J., & King, I. R. 2000, PASP, 112, 1360 [NASA ADS] [CrossRef] [Google Scholar]
- Anderson, J., & King, I. R. 2006, PSFs, Photometry, and Astronomy for the ACS/WFC, Tech. rep. [Google Scholar]
- Anderson, J., King, I. R., Richer, H. B., et al. 2008, AJ, 135, 2114 [NASA ADS] [CrossRef] [Google Scholar]
- Appenzeller, I., Fricke, K., Fürtig, W., et al. 1998, The Messenger, 94, 1 [NASA ADS] [Google Scholar]
- Ashman, K. M., & Zepf, S. E. 1992, ApJ, 384, 50 [NASA ADS] [CrossRef] [Google Scholar]
- Barmby, P., Huchra, J. P., Brodie, J. P., et al. 2000, AJ, 119, 727 [NASA ADS] [CrossRef] [Google Scholar]
- Bedin, L. R., Cassisi, S., Castelli, F., et al. 2005, MNRAS, 357, 1038 [NASA ADS] [CrossRef] [Google Scholar]
- Bekki, K., Couch, W. J., Drinkwater, M. J., & Shioya, Y. 2003, MNRAS, 344, 399 [NASA ADS] [CrossRef] [Google Scholar]
- Blakeslee, J. P., Lucey, J. R., Barris, B. J., Hudson, M. J., & Tonry, J. L. 2001, MNRAS, 327, 1004 [NASA ADS] [CrossRef] [Google Scholar]
- Bruzual, G., & Charlot, S. 2003, MNRAS, 344, 1000 [NASA ADS] [CrossRef] [Google Scholar]
- Cardelli, J. A., Clayton, G. C., & Mathis, J. S. 1989, ApJ, 345, 245 [NASA ADS] [CrossRef] [Google Scholar]
- Castañeda, L., & Hilker, M. 2004, Astron. Nachr. Suppl., 325, 129 [NASA ADS] [Google Scholar]
- Chiaberge, M., Lim, P. L., Kozhurina-Platais, V., Sirianni, M., & Mack, J. 2009, Updated CTE photometric correction for WFC and HRC, Tech. rep. [Google Scholar]
- Coelho, P., Bruzual, G., Charlot, S., et al. 2007, MNRAS, 382, 498 [NASA ADS] [CrossRef] [Google Scholar]
- Colucci, J. E., Bernstein, R. A., Cameron, S., McWilliam, A., & Cohen, J. G. 2009, ApJ, 704, 385 [NASA ADS] [CrossRef] [Google Scholar]
- Da Rocha, C., & Mendes de Oliveira, C. 2005, MNRAS, 364, 1069 [NASA ADS] [CrossRef] [Google Scholar]
- Da Rocha, C., Mendes de Oliveira, C., Bolte, M., Ziegler, B. L., & Puzia, T. H. 2002, AJ, 123, 690 [NASA ADS] [CrossRef] [Google Scholar]
- Da Rocha, C., Mendes de Oliveira, C., Bolte, M., Ziegler, B. L., & Puzia, T. H. 2003, in Extragalactic Globular Cluster Systems, ed. M. Kissler-Patig, 179 [Google Scholar]
- Da Rocha, C., Ziegler, B. L., & Mendes de Oliveira, C. 2008, MNRAS, 388, 1433 [Google Scholar]
- Dabringhausen, J., Hilker, M., & Kroupa, P. 2008, MNRAS, 386, 864 [NASA ADS] [CrossRef] [Google Scholar]
- Danese, L., de Zotti, G., & di Tullio, G. 1980, A&A, 82, 322 [NASA ADS] [Google Scholar]
- de Carvalho, R. R., Ribeiro, A. L. B., Capelato, H. V., & Zepf, S. E. 1997, ApJS, 110, 1 [NASA ADS] [CrossRef] [Google Scholar]
- Dolphin, A. E. 2009, PASP, 121, 655 [NASA ADS] [CrossRef] [Google Scholar]
- Drinkwater, M. J., Jones, J. B., Gregg, M. D., & Phillipps, S. 2000, PASA, 17, 227 [NASA ADS] [CrossRef] [Google Scholar]
- Drinkwater, M. J., Gregg, M. D., Couch, W. J., et al. 2004, PASA, 21, 375 [NASA ADS] [Google Scholar]
- Evstigneeva, E. A., Drinkwater, M. J., Jurek, R., et al. 2007a, MNRAS, 378, 1036 [NASA ADS] [CrossRef] [Google Scholar]
- Evstigneeva, E. A., Gregg, M. D., Drinkwater, M. J., & Hilker, M. 2007b, AJ, 133, 1722 [NASA ADS] [CrossRef] [Google Scholar]
- Fellhauer, M., & Kroupa, P. 2002, MNRAS, 330, 642 [NASA ADS] [CrossRef] [Google Scholar]
- Finkelman, I., Brosch, N., Funes, J. G., Kniazev, A. Y., & Väisänen, P. 2010, MNRAS, 407, 2475 [NASA ADS] [CrossRef] [Google Scholar]
- Forbes, D. A., Lasky, P., Graham, A. W., & Spitler, L. 2008, MNRAS, 389, 1924 [NASA ADS] [CrossRef] [Google Scholar]
- Fruchter, A. S., & Hook, R. N. 2002, PASP, 114, 144 [NASA ADS] [CrossRef] [Google Scholar]
- Fujita, Y. 2004, PASJ, 56, 29 [NASA ADS] [Google Scholar]
- Georgiev, I. Y., Goudfrooij, P., Puzia, T. H., & Hilker, M. 2008, AJ, 135, 1858 [NASA ADS] [CrossRef] [Google Scholar]
- Gilmore, G., Wilkinson, M. I., Wyse, R. F. G., et al. 2007, ApJ, 663, 948 [NASA ADS] [CrossRef] [Google Scholar]
- Goerdt, T., Moore, B., Kazantzidis, S., et al. 2008, MNRAS, 385, 2136 [NASA ADS] [CrossRef] [Google Scholar]
- Gregg, M. D., Drinkwater, M. J., Evstigneeva, E., et al. 2009, AJ, 137, 498 [NASA ADS] [CrossRef] [Google Scholar]
- Haşegan, M., Jordán, A., Côté, P., et al. 2005, ApJ, 627, 203 [NASA ADS] [CrossRef] [Google Scholar]
- Harris, W. E. 1996, AJ, 112, 1487 [NASA ADS] [CrossRef] [Google Scholar]
- Harris, W. E. 2001, Globular cluster systems, ed. L. Labhardt, & B. Binggeli, 223 [Google Scholar]
- Hau, G. K. T., Spitler, L. R., Forbes, D. A., et al. 2009, MNRAS, 394, L97 [NASA ADS] [Google Scholar]
- Hickson, P. 1982, ApJ, 255, 382 [NASA ADS] [CrossRef] [Google Scholar]
- Hickson, P., Kindl, E., & Auman, J. R. 1989, ApJS, 70, 687 [NASA ADS] [CrossRef] [Google Scholar]
- Hickson, P., Mendes de Oliveira, C., Huchra, J. P., & Palumbo, G. G. 1992, ApJ, 399, 353 [NASA ADS] [CrossRef] [EDP Sciences] [MathSciNet] [PubMed] [Google Scholar]
- Hilker, M., Baumgardt, H., Infante, L., et al. 2007, A&A, 463, 119 [NASA ADS] [CrossRef] [EDP Sciences] [MathSciNet] [Google Scholar]
- Hilker, M., Infante, L., & Richtler, T. 1999, A&AS, 138, 55 [NASA ADS] [CrossRef] [EDP Sciences] [Google Scholar]
- Hilker, M., Mieske, S., Baumgardt, H., & Dabringhausen, J. 2008, in IAU Symp. 246, ed. E. Vesperini, M. Giersz, & A. Sills, 427 [Google Scholar]
- Hunsberger, S. D., Charlton, J. C., & Zaritsky, D. 1998, ApJ, 505, 536 [NASA ADS] [CrossRef] [Google Scholar]
- Iglesias-Páramo, J., & Vílchez, J. M. 2001, ApJ, 550, 204 [NASA ADS] [CrossRef] [Google Scholar]
- Jones, J. B., Drinkwater, M. J., Jurek, R., et al. 2006, AJ, 131, 312 [NASA ADS] [CrossRef] [Google Scholar]
- Kotulla, R., Fritze, U., Weilbacher, P., & Anders, P. 2009, MNRAS, 396, 462 [NASA ADS] [CrossRef] [Google Scholar]
- Krist, J. 1995, in Astronomical Data Analysis Software and Systems IV, ed. R. A. Shaw, H. E. Payne, & J. J. E. Hayes, ASP Conf. Ser., Vol. 77, 349 [Google Scholar]
- Kruijssen, J. M. D., & Mieske, S. 2009, A&A, 500, 785 [NASA ADS] [CrossRef] [EDP Sciences] [Google Scholar]
- Larsen, S. S. 1999, A&AS, 139, 393 [NASA ADS] [CrossRef] [EDP Sciences] [Google Scholar]
- Mendes de Oliveira, C., & Hickson, P. 1994, ApJ, 427, 684 [NASA ADS] [CrossRef] [Google Scholar]
- Mendes de Oliveira, C., & Bolte, M. 1999, in Observational Cosmology: The Development of Galaxy Systems, ed. G. Giuricin, M. Mezzetti, & P. Salucci, ASP Conf. Ser., 176, 122 [Google Scholar]
- Mendes de Oliveira, C., Plana, H., Amram, P., Balkowski, C., & Bolte, M. 2001, AJ, 121, 2524 [NASA ADS] [CrossRef] [Google Scholar]
- Mieske, S., & Kroupa, P. 2008, ApJ, 677, 276 [NASA ADS] [CrossRef] [Google Scholar]
- Mieske, S., Hilker, M., & Infante, L. 2002, A&A, 383, 823 [NASA ADS] [CrossRef] [EDP Sciences] [Google Scholar]
- Mieske, S., Hilker, M., & Infante, L. 2004, A&A, 418, 445 [Google Scholar]
- Mieske, S., Hilker, M., Jordán, A., Infante, L., & Kissler-Patig, M. 2007, A&A, 472, 111 [NASA ADS] [CrossRef] [EDP Sciences] [Google Scholar]
- Mieske, S., Hilker, M., Jordán, A., et al. 2008, A&A, 487, 921 [NASA ADS] [CrossRef] [EDP Sciences] [Google Scholar]
- Misgeld, I., Mieske, S., & Hilker, M. 2008, A&A, 486, 697 [NASA ADS] [CrossRef] [EDP Sciences] [Google Scholar]
- Misgeld, I., Hilker, M., & Mieske, S. 2009, A&A, 496, 683 [NASA ADS] [CrossRef] [EDP Sciences] [Google Scholar]
- Mulchaey, J. S., & Zabludoff, A. I. 1998, ApJ, 496, 73 [NASA ADS] [CrossRef] [Google Scholar]
- Nieto, J. L. 1983, in Astrophysical Jets, ed. A. Ferrari, & A. G. Pacholczyk, Ap&SS Library, 103, 113 [Google Scholar]
- Osmond, J. P. F., & Ponman, T. J. 2004, MNRAS, 350, 1511 [NASA ADS] [CrossRef] [Google Scholar]
- Plana, H., Mendes de Oliveira, C., Amram, P., & Boulesteix, J. 1998, AJ, 116, 2123 [NASA ADS] [CrossRef] [Google Scholar]
- Ponman, T. J., Bourner, P. D. J., Ebeling, H., & Bohringer, H. 1996, MNRAS, 283, 690 [NASA ADS] [CrossRef] [Google Scholar]
- Prugniel, P., & Simien, F. 1996, A&A, 309, 749 [NASA ADS] [Google Scholar]
- Puzia, T. H., Saglia, R. P., Kissler-Patig, M., et al. 2002, A&A, 395, 45 [NASA ADS] [CrossRef] [EDP Sciences] [Google Scholar]
- Puzia, T. H., Kissler-Patig, M., & Goudfrooij, P. 2006, ApJ, 648, 383 [NASA ADS] [CrossRef] [Google Scholar]
- Ribeiro, A. L. B., de Carvalho, R. R., Capelato, H. V., & Zepf, S. E. 1998, ApJ, 497, 72 [NASA ADS] [CrossRef] [Google Scholar]
- Rudick, C. S., Mihos, J. C., & McBride, C. 2006, ApJ, 648, 936 [NASA ADS] [CrossRef] [Google Scholar]
- Schlegel, D. J., Finkbeiner, D. P., & Davis, M. 1998, ApJ, 500, 525 [NASA ADS] [CrossRef] [Google Scholar]
- Schuberth, Y., Richtler, T., Hilker, M., et al. 2010, A&A, 513, A52 [NASA ADS] [CrossRef] [EDP Sciences] [Google Scholar]
- Sirianni, M., Jee, M. J., Benítez, N., et al. 2005, PASP, 117, 1049 [NASA ADS] [CrossRef] [Google Scholar]
- Sparks, W. B., Wall, J. V., Thorne, D. J., et al. 1985, MNRAS, 217, 87 [NASA ADS] [Google Scholar]
- Taylor, M. A., Puzia, T. H., Harris, G. L., et al. 2010, ApJ, 712, 1191 [NASA ADS] [CrossRef] [Google Scholar]
- Thomas, D., Maraston, C., & Bender, R. 2003, MNRAS, 339, 897 [NASA ADS] [CrossRef] [Google Scholar]
- Trager, S. C., Worthey, G., Faber, S. M., Burstein, D., & Gonzalez, J. J. 1998, ApJS, 116, 1 [NASA ADS] [CrossRef] [MathSciNet] [Google Scholar]
- Treister, E., Castander, F. J., Maccarone, T. J., et al. 2005, ApJ, 621, 104 [NASA ADS] [CrossRef] [Google Scholar]
- Tzanavaris, P., Hornschemeier, A. E., Gallagher, S. C., et al. 2010, ApJ, 716, 556 [NASA ADS] [CrossRef] [Google Scholar]
- van Dokkum, P. G. 2001, PASP, 113, 1420 [NASA ADS] [CrossRef] [Google Scholar]
- Verdes-Montenegro, L., Yun, M. S., Williams, B. A., et al. 2001, A&A, 377, 812 [NASA ADS] [CrossRef] [EDP Sciences] [Google Scholar]
- Veron-Cetty, M.-P., & Veron, P. 1988, A&A, 204, 28 [NASA ADS] [Google Scholar]
- White, N. E., Giommi, P., & Angelini, L. 2000, VizieR Online Data Catalog, 9031, [Google Scholar]
- White, P. M., Bothun, G., Guerrero, M. A., West, M. J., & Barkhouse, W. A. 2003, ApJ, 585, 739 [NASA ADS] [CrossRef] [Google Scholar]
- Woodley, K. A., Harris, W. E., Puzia, T. H., et al. 2010, ApJ, 708, 1335 [NASA ADS] [CrossRef] [Google Scholar]
- Worthey, G. 1994, ApJS, 95, 107 [NASA ADS] [CrossRef] [Google Scholar]
- Zabludoff, A. I., & Mulchaey, J. S. 1998, ApJ, 496, 39 [NASA ADS] [CrossRef] [Google Scholar]
All Tables
Properties of the 16 compact stellar systems detected in HCG 22, ordered by R-band magnitude.
Properties of the 5 compact stellar systems detected in HCG 90, ordered by R-band magnitude.
Photometric and structural properties of HCG 22 UCD candidates from the HST imaging.
Photometric and structural properties of HCG 90 UCD candidates from the HST imaging.
All Figures
|
Fig. 1 FORS2 R-band pre-images of HCG 22 (left) and HCG 90 (right), of dimension 7 × 7′, corresponding to about 65 × 65 kpc at the distance of the groups. Blue diamonds show the spectroscopic targets and those marked with red circles are confirmed compact members of the HCGs (most in the mass range of UCDs), i.e. those with radial velocities within the group range (cf. Fig. 4). Note the difference in their spatial distribution: UCD candidates in HCG 22 are clustered around the central galaxy, while the few UCDs in HCG 90 have more dispersed distribution. Overlaid are also the HST pointings used in our analysis (WFPC2 for HCG 22 and ACS/WFC for HCG 90). Labels in HCG 22 indicate the name of the target at which the WF3 chip was centred. Physical scale and orientation are indicated in the lower left corner and are the same for both fields. A colour version of this figure, showing a high-resolution HST zoom at the dusty disk in the central 5 kpc of NGC 1199 and gas dominated spiral in HCG 90, is available as an online material. |
| In the text | |
|
Fig. 2 Colour − magnitude diagrams of HCG compact members (left panel) and all preselected targets (right panel). Left panel: (B − R)0 is plotted vs. MR for spectroscopically confirmed members in the two groups. The dotted lines are model predictions for simple stellar populations from Bruzual & Charlot (2003) for a range of metallicities and ages, and a stellar mass of 2 × 10⁶ M⊙, which marks the limit between normal GCs and UCDs (e.g. Mieske et al. 2008). From left to right the lines correspond to metallicities [Z/H] = −1.6, −0.6, 0.1, and 0.4 dex. The open squares indicate ages of 2, 5, and 12 Gyr, from top to bottom. The solid (blue) line indicates the 12 Gyr isochrone for a stellar mass of 2 × 10⁶ M⊙. Right panel: analogous to the left panel, but for a wider colour − magnitude range to show the confirmed group members and the preselected targets of our survey. Filled red circles and black squares indicate the confirmed group members, the same as in the left panel. Open circles indicate all other objects that were included in the MXU masks. Sources marked by asterisks are those which were high priority candidates, according to their colour − magnitude values and morphology. Small dots indicate target sources of lower priority (colours fall outside the selection color range, or of more resolved morphology). |
| In the text | |
|
Fig. 3 Spectra (bottom panels) and cross-correlation results for radial velocity measurement (top panels) for three example HCG 22 compact objects covering our range of cross-correlation confidence level (from left to right), see also Table 1. |
| In the text | |
|
Fig. 4 Left panel: radial velocity histogram (corrected to heliocentric velocity) of spectroscopic targets in HCG 22 (red) and HCG 90 (black). The group members at around 2700 km s-1 are well separated from foreground stars and background galaxies with extreme velocities (not shown for clarity). Right panel: cumulative radial distance distribution of the HCG compact members relative to the central galaxies (NGC 1199 and NGC 7173 for HCG 22 and 90, respectively). The samples in this panel are restricted to the UCD mass range. The KS-test probability of both distributions having the same parent distribution is 0.9%. |
| In the text | |
|
Fig. 5 Colour − magnitude diagram of all sources in the HCG 90 WFC/ACS field of view. The UCD candidate is indicated with a solid pentagon while large open circles indicate all sources for which spectroscopy is available. For comparison, GALEV SSP model isometallicity tracks are shown with lines for three fiducial metallicities (Anders & Fritze-v. Alvensleben 2003; Kotulla et al. 2009), as indicated in the figure’s legend. The models luminosities are for a cluster of 5 × 10⁶ M⊙. |
| In the text | |
|
Fig. 6 Top row: colour − magnitude diagrams for all objects (dots) in HCG 22 for each of the four WFPC2 pointings. The legend for each CMD indicates the galaxy/region at which the WF3 chip was centred. Bottom row: colour − colour diagrams of all sources (dots) with photometry for the same fields. In all panels the open circles indicate the objects with spectroscopy while the open squares are the UCD candidates. The description of the SSP isometallicity tracks is the same as in Fig. 5. |
| In the text | |
|
Fig. 7 Distribution of the half-light radius in parsecs (left axis) and
pixels of |
| In the text | |
|
Fig. 8 Lick line index diagnostic plots for a sub-sample of the compact group members with high enough S/N (error in ⟨ Fe ⟩ index below 0.5 dex). Left panel: diagnostic plot for alpha abundances, plotting ⟨ Fe ⟩ vs. Mgb index. We show lines of identical alpha abundances for both age of 12 Gyr (solid line) and 4 Gyr (dashed line), using the model predictions of Thomas et al. (2003). The two most metal-rich members of either group appear to have super-solar alpha abundances. Right panel: diagnostic plot for age estimation, plotting Hβ vs. ⟨ Fe ⟩ index for four different ages 12, 7, 3, and 1 Gyr from bottom to top (solar α-abundance). The three UCDs in HCG 90 appear consistent with very old ages, as do the two HCG 22 UCDs HCG22_UCD001 and HCG22_UCD005 (see Tables 1 and 2). Numbers on the symbols are the ID of each object, where the prefixes were omitted for clarity. |
| In the text | |
|
Fig. 9 Absolute magnitude of confirmed cluster members (HCG 22 are filled red circles, HCG 90 are black squares) vs. the ratio between the cross-correlation amplitude using our reference old stellar template and an intermediate age template (3 Gyrs, [Fe/H] = −0.5 dex; Coelho et al. 2007). Negative to positive values indicate spectra better fit by young to old ages, respectively. Objects marked are the ones with cross-correlation confidence level higher than 5. |
| In the text | |
|
Fig. A.1 Colour composite image of HCG 22 with Keck B and R-band (Da Rocha et al. 2002) and HST/WFPC2 F450W, F606W and F814W filters. A zoom in (20 × 20′′) showing the dust lane in NGC 1199 can be seen in the upper left corner. As in Fig. 1, blue diamonds indicate the targeted objects in our masks and red circles indicate the HCG compact members. Field of view is 7 × 5′. |
| In the text | |
|
Fig. A.2 Colour composite image of HCG 90 with FORS B, V
and R-band and HST/ACS F475W and F850LP
filters. A zoom in ( |
| In the text | |
Current usage metrics show cumulative count of Article Views (full-text article views including HTML views, PDF and ePub downloads, according to the available data) and Abstracts Views on Vision4Press platform.
Data correspond to usage on the plateform after 2015. The current usage metrics is available 48-96 hours after online publication and is updated daily on week days.
Initial download of the metrics may take a while.