Fig. 2
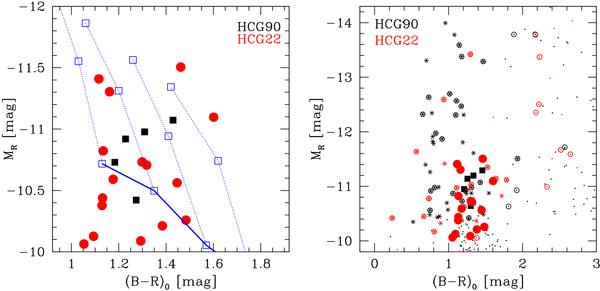
Colour − magnitude diagrams of HCG compact members (left panel) and all preselected targets (right panel). Left panel: (B − R)0 is plotted vs. MR for spectroscopically confirmed members in the two groups. The dotted lines are model predictions for simple stellar populations from Bruzual & Charlot (2003) for a range of metallicities and ages, and a stellar mass of 2 × 10⁶ M⊙, which marks the limit between normal GCs and UCDs (e.g. Mieske et al. 2008). From left to right the lines correspond to metallicities [Z/H] = −1.6, −0.6, 0.1, and 0.4 dex. The open squares indicate ages of 2, 5, and 12 Gyr, from top to bottom. The solid (blue) line indicates the 12 Gyr isochrone for a stellar mass of 2 × 10⁶ M⊙. Right panel: analogous to the left panel, but for a wider colour − magnitude range to show the confirmed group members and the preselected targets of our survey. Filled red circles and black squares indicate the confirmed group members, the same as in the left panel. Open circles indicate all other objects that were included in the MXU masks. Sources marked by asterisks are those which were high priority candidates, according to their colour − magnitude values and morphology. Small dots indicate target sources of lower priority (colours fall outside the selection color range, or of more resolved morphology).
Current usage metrics show cumulative count of Article Views (full-text article views including HTML views, PDF and ePub downloads, according to the available data) and Abstracts Views on Vision4Press platform.
Data correspond to usage on the plateform after 2015. The current usage metrics is available 48-96 hours after online publication and is updated daily on week days.
Initial download of the metrics may take a while.