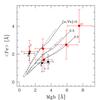
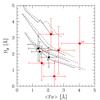
Fig. 8
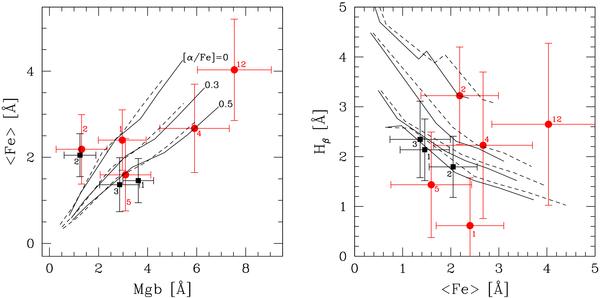
Lick line index diagnostic plots for a sub-sample of the compact group members with high enough S/N (error in ⟨ Fe ⟩ index below 0.5 dex). Left panel: diagnostic plot for alpha abundances, plotting ⟨ Fe ⟩ vs. Mgb index. We show lines of identical alpha abundances for both age of 12 Gyr (solid line) and 4 Gyr (dashed line), using the model predictions of Thomas et al. (2003). The two most metal-rich members of either group appear to have super-solar alpha abundances. Right panel: diagnostic plot for age estimation, plotting Hβ vs. ⟨ Fe ⟩ index for four different ages 12, 7, 3, and 1 Gyr from bottom to top (solar α-abundance). The three UCDs in HCG 90 appear consistent with very old ages, as do the two HCG 22 UCDs HCG22_UCD001 and HCG22_UCD005 (see Tables 1 and 2). Numbers on the symbols are the ID of each object, where the prefixes were omitted for clarity.
Current usage metrics show cumulative count of Article Views (full-text article views including HTML views, PDF and ePub downloads, according to the available data) and Abstracts Views on Vision4Press platform.
Data correspond to usage on the plateform after 2015. The current usage metrics is available 48-96 hours after online publication and is updated daily on week days.
Initial download of the metrics may take a while.