| Issue |
A&A
Volume 521, October 2010
|
|
|---|---|---|
| Article Number | A66 | |
| Number of page(s) | 10 | |
| Section | Interstellar and circumstellar matter | |
| DOI | https://doi.org/10.1051/0004-6361/201015039 | |
| Published online | 21 October 2010 | |
Dust grain growth in  -Ophiuchi protoplanetary disks
L. Ricci1 - L. Testi1 - A. Natta2 - K. J. Brooks3
1 - European Southern Observatory,
Karl-Schwarzschild-Strasse 2, 85748 Garching, Germany
2 -
INAF-Osservatorio Astrofisico di Arcetri, Largo Fermi 5, 50125 Firenze, Italy
3 - Australia Telescope National Facility, PO Box 76, Epping, NSW 1710, Australia
Received 25 May 2010 / Accepted 5 August 2010
Abstract
We present new ATCA observations at 3.3 mm of 27 young stellar objects in the ![]() -Oph
young cluster. 25 of these sources have been detected. We analyze the
sub-millimeter and millimeter SED for a subsample of 17 isolated
class II protoplanetary disks and derive constraints on the grain
growth and total dust mass in the disk outer regions. All the disks in
our sample show a mm slope of the SED which is significantly shallower
than the one observed for the ISM at these long wavelengths. This
indicates that 1) class II disks in Ophiuchus host grains
grown to mm/cm-sizes in their outer regions; 2) formation of
mm/cm-sized pebbles is a fast process and 3) a mechanism
halting or slowing down the inward radial drift of solid particles is
required to explain the data. These findings are consistent with
previous results in other star forming regions. We compare the dust
properties of this sample with those of a uniformly selected sample in
Taurus-Auriga and find no statistical evidence of any difference in
terms of grain growth between the two regions. Finally, in our sample
the mm slope of the SED is not found to correlate with indicators of
grain growth to micron sizes in the surface layers of the inner disk.
-Oph
young cluster. 25 of these sources have been detected. We analyze the
sub-millimeter and millimeter SED for a subsample of 17 isolated
class II protoplanetary disks and derive constraints on the grain
growth and total dust mass in the disk outer regions. All the disks in
our sample show a mm slope of the SED which is significantly shallower
than the one observed for the ISM at these long wavelengths. This
indicates that 1) class II disks in Ophiuchus host grains
grown to mm/cm-sizes in their outer regions; 2) formation of
mm/cm-sized pebbles is a fast process and 3) a mechanism
halting or slowing down the inward radial drift of solid particles is
required to explain the data. These findings are consistent with
previous results in other star forming regions. We compare the dust
properties of this sample with those of a uniformly selected sample in
Taurus-Auriga and find no statistical evidence of any difference in
terms of grain growth between the two regions. Finally, in our sample
the mm slope of the SED is not found to correlate with indicators of
grain growth to micron sizes in the surface layers of the inner disk.
Key words: protoplanetary disks - planets and satellites: formation - stars: pre-main sequence
1 Introduction
Circumstellar disks around pre-main sequence (PMS) stars are the common birth places of planetary systems. In order to build up large bodies such as giant planets a huge growth of solid particles by more than 12 orders of magnitude in size has to occur starting from submicron-sized microscopic dust grains as those typically found in the interstellar medium (ISM; Mathis et al. 1977). The first stages of this process of grain growth are characterized by the dynamical interaction between gas and dust, leading to collisions between the solid particles and finally coagulation (see Beckwith et al. 2000; Dominik et al. 2007; Natta et al. 2007).
Evidence for the presence of micron-sized dust grains in protoplanetary disks has been provided by the inspection of ISO and Spitzer spectra for the silicate feature at about 10 ![]() m (e.g. Bouwman et al. 2001; Van Boeckel et al. 2003; Kessler-Silacci et al. 2006).
However infrared observations can only probe the uppermost surface
layers of the disk, while to investigate the properties of dust in the
disk midplane, where planet formation is expected to take place,
observations at longer wavelengths are needed. If the long-wave
emission is optically thin the spectral index of the SED at these
wavelengths can be related to the spectral index of the dust opacity
m (e.g. Bouwman et al. 2001; Van Boeckel et al. 2003; Kessler-Silacci et al. 2006).
However infrared observations can only probe the uppermost surface
layers of the disk, while to investigate the properties of dust in the
disk midplane, where planet formation is expected to take place,
observations at longer wavelengths are needed. If the long-wave
emission is optically thin the spectral index of the SED at these
wavelengths can be related to the spectral index of the dust opacity ![]() (
(
![]() ), and
), and ![]() -values lower than
-values lower than ![]() 1 are naturally interpreted in terms of grain growth (Draine 2006). Beckwith & Sargent (1991)
were the first to show that T Tauri stars (TTS) have SEDs at
submillimeter wavelengths which are typically shallower than what found
for the ISM, suggesting that dust grains as large as at least 1 mm
are present in the disk midplane. However these single-dish
observations did not have a good enough angular resolution to spatially
resolve the disks, and the same data could in principle be explained
also by optically thick emission from compact disks with unprocessed,
ISM-like grains.
1 are naturally interpreted in terms of grain growth (Draine 2006). Beckwith & Sargent (1991)
were the first to show that T Tauri stars (TTS) have SEDs at
submillimeter wavelengths which are typically shallower than what found
for the ISM, suggesting that dust grains as large as at least 1 mm
are present in the disk midplane. However these single-dish
observations did not have a good enough angular resolution to spatially
resolve the disks, and the same data could in principle be explained
also by optically thick emission from compact disks with unprocessed,
ISM-like grains.
Wilner et al. (2000) and Testi et al. (2003)
resolved the disks around TW Hya and CQ Tau PMS stars at 7 mm with
the Very Large Array (VLA), confirming that the long-wave emission from
these disks reveals the presence of cm-sized pebbles in the disk
midplane. More recently Rodmann et al. (2006) and Lommen et al. (2007) found evidence of grain growth to ![]() mm/cm-sized
pebbles for about ten T Tauri stars in the Taurus-Auriga,
Chamaeleon and Lupus star forming regions (SFRs). Lommen
et al. (2010) have
combined new and literature data for disks from five different SFRs
(Taurus-Auriga, Lupus, Chamaeleon, Corona Australis and Serpens) and
reported a tentative correlation between the mm slope of the SED and
the strength of the 10-
mm/cm-sized
pebbles for about ten T Tauri stars in the Taurus-Auriga,
Chamaeleon and Lupus star forming regions (SFRs). Lommen
et al. (2010) have
combined new and literature data for disks from five different SFRs
(Taurus-Auriga, Lupus, Chamaeleon, Corona Australis and Serpens) and
reported a tentative correlation between the mm slope of the SED and
the strength of the 10-![]() m silicate feature, possibly suggesting that inner and outer disk evolve simultaneously in terms of dust grain growth.
m silicate feature, possibly suggesting that inner and outer disk evolve simultaneously in terms of dust grain growth.
So far, most of the observations carried out at long wavelengths have targeted the brightest sources. Ricci et al. (2010, hereafter R10) have started to probe fainter disks with new sensitive data at 3 mm obtained with the Plateau de Bure Interferometer in Taurus and analyzed a sample of 21 isolated class II young stellar objects (YSOs) in this SFR. For all the disks in this sample they found neither evidence for time evolution of dust grain growth nor significant relations between dust properties and stellar ones were found.
In this paper we perform the same analysis presented in R10, but on a sample of disks in another SFR, i.e. ![]() -Ophiuchi. In Sect. 2 we present new 3 mm data for 27
-Ophiuchi. In Sect. 2 we present new 3 mm data for 27 ![]() -Oph YSOs obtained with the Australia Telescope Compact Array (ATCA
-Oph YSOs obtained with the Australia Telescope Compact Array (ATCA![]() )
and its new Compact Array Broadband Backend (CABB). In Sect. 3 we
describe the properties of the sub-sample used for the analysis. The
method adopted for deriving the dust properties, namely grain growth
and dust mass, is the same used in R10 and it is described in
Sect. 4. The results of the analysis are described in
Sect. 5, whereas Sect. 6 summarizes the main findings of our
work.
)
and its new Compact Array Broadband Backend (CABB). In Sect. 3 we
describe the properties of the sub-sample used for the analysis. The
method adopted for deriving the dust properties, namely grain growth
and dust mass, is the same used in R10 and it is described in
Sect. 4. The results of the analysis are described in
Sect. 5, whereas Sect. 6 summarizes the main findings of our
work.
Table 1: Summary of the 3.3 mm ATCA observations.
2 New ATCA observations
We observed 27 YSOs in the ![]() -Oph
star forming region at 3.2944 mm with ATCA and the new CABB
digital filter bank. Targets were chosen by being class II (most
of them) or ``flat spectrum'' YSOs, with a detected flux at 1.3 mm
higher than 20 mJy in order to have good chances for
detection at
-Oph
star forming region at 3.2944 mm with ATCA and the new CABB
digital filter bank. Targets were chosen by being class II (most
of them) or ``flat spectrum'' YSOs, with a detected flux at 1.3 mm
higher than 20 mJy in order to have good chances for
detection at ![]() 3.3 mm with a few hours at most of integration time on-source.
3.3 mm with a few hours at most of integration time on-source.
The observations were carried out between the end of April and the
beginning of July 2009, with the ATCA array in the H168 and H75
configurations respectively. The obtained FWHM of the synthesized beam of ![]() 3-7''
did not allow us to spatially resolve any of our sources, and so a
2D-Gaussian model was used to estimate the flux density in the
continuum at 3.3 mm. To obtain the best sensitivity in the
continuum we set the correlator to cover the full 2-GHz CABB effective
bandwidth on all the five antennas available at
3-7''
did not allow us to spatially resolve any of our sources, and so a
2D-Gaussian model was used to estimate the flux density in the
continuum at 3.3 mm. To obtain the best sensitivity in the
continuum we set the correlator to cover the full 2-GHz CABB effective
bandwidth on all the five antennas available at ![]() 3 mm.
Each source has been observed one or more times, with a total
integration time on-source ranging between about 40 min and
3 h.
3 mm.
Each source has been observed one or more times, with a total
integration time on-source ranging between about 40 min and
3 h.
The complex gain calibration was done on the calibrators 1622-297 and
1730-130, and science targets were typically observed for 10 min
and then spaced out with 2 min on the gain calibrator.
The absolute calibration was done with Uranus except for a few times in
which 1921-293 was used and then its flux was always cross-calibrated
with Uranus the day after. In general, the baselines that resolved out
Uranus were not used for flux calibration![]() . In this work, we assume a 1
. In this work, we assume a 1![]() -uncertainty on the calibrated flux of about 25
-uncertainty on the calibrated flux of about 25![]() .
.
The results of the observations are reported in Table 1.
In particular we have detected 25 out of 27 targeted YSOs. The
detected sources have fluxes ranging from about 1.5 and
48.8 mJy at 3.3 mm.
For the two undetected sources, IRS 33 and GY 284, we obtained an upper
limit for the flux at 3.3 mm of 1.2 mJy. These sources have
been previously detected by Motte et al. (1998) using the IRAM 30 m single-dish telescope at 1.3 mm. Although their reported fluxes are relatively large (
![]() mJy and
mJy and
![]() mJy
for IRS 33 and GY 284 respectively) the emission for both the
sources appears to be spatially resolved by a beam with a FWHM
of about 11 arcsec. This indicates that a significant fraction of
the collected flux at 1.3 mm comes from an extended envelope
surrounding the circumstellar disk. In order to get a reliable estimate
for the flux at
mJy
for IRS 33 and GY 284 respectively) the emission for both the
sources appears to be spatially resolved by a beam with a FWHM
of about 11 arcsec. This indicates that a significant fraction of
the collected flux at 1.3 mm comes from an extended envelope
surrounding the circumstellar disk. In order to get a reliable estimate
for the flux at ![]() 1 mm from the circumstellar disk only, interferometric observations at
1 mm from the circumstellar disk only, interferometric observations at ![]() 1 mm
are needed to filter out the contaminating emission from the envelope.
Since these are not available in the literature we do not include
IRS 33 and GY 284 in our sample discussed in the next
section.
1 mm
are needed to filter out the contaminating emission from the envelope.
Since these are not available in the literature we do not include
IRS 33 and GY 284 in our sample discussed in the next
section.
3 Sample
In this section we describe some properties of the sample considered for our analysis![]() . In Sect. 3.1 we outline the selection criteria adopted to select our sample, Sect. 3.2 describes the sample completeness level, and finally in Sect. 3.3 we derive the stellar parameters.
. In Sect. 3.1 we outline the selection criteria adopted to select our sample, Sect. 3.2 describes the sample completeness level, and finally in Sect. 3.3 we derive the stellar parameters.
3.1 Selection criteria
We used the same selection criteria adopted in R10:
- 1.
- class II YSOs as catalogued in Andrews & Williams (2007a) from the infrared SED to avoid contamination of (sub-)mm fluxes by a residual envelope;
- 2.
- central stars need to be well characterized through optical-NIR spectroscopic/photometric data to obtain self-consistent disk SED models;
- 3.
- YSOs with at least one detection in the
 mm spectral range
![[*]](/icons/foot_motif.png) other than being observed through the new ATCA observations described
in Sect. 2, to have a good sampling of the (sub-)mm SED;
other than being observed through the new ATCA observations described
in Sect. 2, to have a good sampling of the (sub-)mm SED; - 4.
- no evidence of stellar companions with projected physical
separation between 5 and 500 AU to avoid tidal interactions that
may alter the outer disk structure; adopting for all the YSOs in our
sample the current estimate of
 130 pc for the distance to the -Oph star forming region (Wilking et al. 2008; Lombardi et al. 2008), the range in projected phyical separation translates into a range in angular separation of
0.05-4''.
130 pc for the distance to the -Oph star forming region (Wilking et al. 2008; Lombardi et al. 2008), the range in projected phyical separation translates into a range in angular separation of
0.05-4''.
3.2 Completeness
The two histograms in Fig. 1 show the distribution of the ``isolated'', i.e. satisfying the selection criterion (4) in Sect. 3.1, class II YSOs from the Andrews & Williams (2007a) catalogue. The histogram on the left side shows that our sample comprises all the isolated class II YSOs with
![]() mJy, while for the fainter objects the completeness level reduces to 22% (8/36).
mJy, while for the fainter objects the completeness level reduces to 22% (8/36).
Table 2: Stellar properties of the considered sample.
In terms of the stellar properties, our sample includes 53% (16/30) of the isolated PMS stars with stellar types equal to or earlier than M1, correspondent to a stellar mass larger than3.3 Stellar properties
To constrain the stellar properties we used the same method as
described in R10. We estimated the stellar effective temperatures by
converting the adopted spectral types (from Andrews & Williams 2007a, and references therein![]() ) with the dwarf temperature scale of Schmidt-Kaler (1982) for spectral types earlier than M0 and the intermediate temperature scale of Luhman (1999) for spectral types equal to or later than M0.
) with the dwarf temperature scale of Schmidt-Kaler (1982) for spectral types earlier than M0 and the intermediate temperature scale of Luhman (1999) for spectral types equal to or later than M0.
Stellar luminosities were computed from the 2MASS J-band flux (Cutri et al. 2003) after
calculating the extinction of each object by dereddening the J-H and
![]() colors to the locus observed for Classical T Tauri stars (Meyer et al. 1997), and adopting the Cardelli et al. (1989) extinction law with
RV = 4.2, which is appropriate for
colors to the locus observed for Classical T Tauri stars (Meyer et al. 1997), and adopting the Cardelli et al. (1989) extinction law with
RV = 4.2, which is appropriate for ![]() -Oph
-Oph![]() .
.
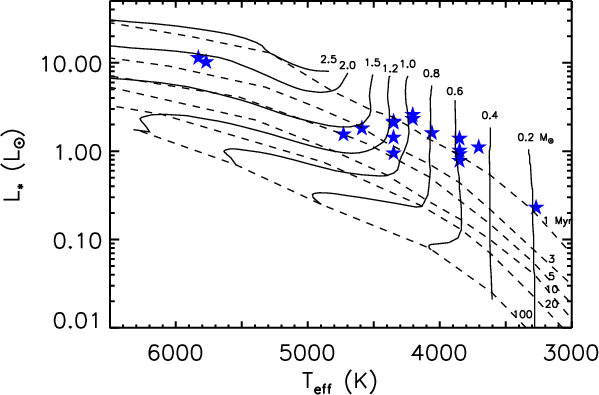
Luminosities and effective temperatures were converted into stellar masses and ages by using the Palla & Stahler (1999) models of PMS stars, as done in R10 (see Fig. 2). According to these models the ranges spanned by our sample go from about 0.2 ![]() (WSB 60) to 1.9
(WSB 60) to 1.9 ![]() (SR 21) in mass and from about 0.7 Myr (GSS 26, EL 24, YLW 16c) to 6.6 Myr (SR 21) in age.
(SR 21) in mass and from about 0.7 Myr (GSS 26, EL 24, YLW 16c) to 6.6 Myr (SR 21) in age.
The stellar parameters are reported in Table 2.
![\begin{figure}
\par\begin{tabular}{cc}
\includegraphics[scale=0.45]{00017fg1a.eps} &
\includegraphics[scale=0.45]{00017fg1b.eps}\\
\end{tabular}
\end{figure}](/articles/aa/full_html/2010/13/aa15039-10/img42.png)
|
Figure 1: Histograms higlighting some properties of our selected sample. In both the histograms our sample is represented by black columns, while the total columns (black+white) include all the class II YSOs from the Andrews & Williams (2007a) catalogue with no evidence of stellar companions in the 0.05-4.0'' interval in angular separation, from which our sample has been selected (see Sect. 3.1). Left) distribution of the fluxes at 1.3 mm, including upper limits; Right) distribution of stellar spectral type (see Sect. 3.3). |
| Open with DEXTER | |
|
Figure 2:
H-R diagram for the sources of our sample. The dashed and solid lines
represent the isochrones and evolutionary tracks respectively from the
Palla & Stahler (1999)
PMS evolutionary models. In this diagram the evolutionary tracks start
from an age of 0.1 Myr. The uncertainties, not shown in the plot,
are typically |
| Open with DEXTER | |
4 Analysis
In order to constrain the dust properties in the disk outer regions we fitted the sub-mm/mm SED with two-layer (i.e. disk surface and midplane) models of flared disks heated by the radiation of the central star (Chiang & Goldreich 1997; Dullemond et al. 2001). In Sects. 4.1 and 4.2 we describe the parameters which are needed to define a two-layer disk model. In Sect. 4.3 we then discuss which are the physical quantities of these models that can be constrained by our analysis.
4.1 Disk structure
In order to characterize a model of the disk estimates for some stellar physical quantities (bolometric luminosity ![]() ,
effective temperature
,
effective temperature
![]() and mass
and mass ![]() ),
plus some information on the disk structure and on the the dust opacity
are needed. As for the stellar parameters we used the values listed in
Table 2.
Regarding the disk structure the only relevant parameters for our analysis are the disk outer radius
),
plus some information on the disk structure and on the the dust opacity
are needed. As for the stellar parameters we used the values listed in
Table 2.
Regarding the disk structure the only relevant parameters for our analysis are the disk outer radius
![]() and the parameters
and the parameters
![]() and p which define a power-law surface density for the dust component:
and p which define a power-law surface density for the dust component:
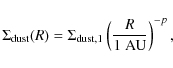
|
(1) |
radially truncated at
An important thing to keep in mind here is that with these values for
the outer radius of the disk the dust emission at the long wavelengths
considered in this paper turns out to be dominated by the optically
thin outer disk regions. This has two important consequences for our
discussion. The first one is that constraints on dust properties such
as dust grain sizes and dust mass can be derived from the continuum
emission at sub-mm/mm wavelengths. If a disk is much more compact than
the ones which have been commonly mapped so far, i.e. if
![]() AU,
then its emission would be dominated by the denser inner regions which
are optically thick even at these long wavelengths, and no information
on the dust properties could be inferred by the observed continuum. The
second consequence is that the disk inclination is not a relevant
parameter for our analysis, except only for the case of a nearly
edge-on disk that however would make the central PMS star invisible in
the optical.
AU,
then its emission would be dominated by the denser inner regions which
are optically thick even at these long wavelengths, and no information
on the dust properties could be inferred by the observed continuum. The
second consequence is that the disk inclination is not a relevant
parameter for our analysis, except only for the case of a nearly
edge-on disk that however would make the central PMS star invisible in
the optical.
Table 3: Disk properties.
4.2 Dust opacity
![\begin{figure}
\par\includegraphics[scale=0.75]{00017fg3.eps}
\end{figure}](/articles/aa/full_html/2010/13/aa15039-10/img95.png)
|
Figure 3:
Sub-mm/mm SED fits for the 17 sources in our sample with the two-layer
flared disk models (solid lines). The errorbars in the plots take into
account an uncertainty of 10% on the absolute flux scale at wavelengths
shorter than 3 mm, and of 25% at 3 mm. The fitting
values of the spectral index |
| Open with DEXTER | |
To calculate the dust opacity we adopted the same dust grain model
taken in R10, i.e. porous composite spherical grains made of
astronomical silicates (optical constants from Weingartner &
Draine 2001), carbonaceous materials (Zubko et al. 1996) and water ices (Warren 1984) with fractional abundances from a simplification of the model used in Pollack et al. (1994) and a volume fraction for vacuum of ![]()
![]() .
In the disk surface and midplane we consider a dust grain population with a grain size number density
throughout all the disk
.
In the disk surface and midplane we consider a dust grain population with a grain size number density
throughout all the disk

|
(2) |
between
4.3 Method
After having set the disk outer radius
![]() and the power-law index p
of the surface density profile, the two-layer models can be used to fit
the sub-mm/mm SED of circumstellar disks to constrain dust properties
in the disk midplane
and the power-law index p
of the surface density profile, the two-layer models can be used to fit
the sub-mm/mm SED of circumstellar disks to constrain dust properties
in the disk midplane![]() , in particular the spectral index of the dust opacity
, in particular the spectral index of the dust opacity ![]() between two mm-wavelengths (1 and 3 mm in the case of this paper) and the product
between two mm-wavelengths (1 and 3 mm in the case of this paper) and the product
![]() between the mass in dust and the dust opacity at 1 mm. Except for very low values of
between the mass in dust and the dust opacity at 1 mm. Except for very low values of ![]() ,
which cannot be explained by large values of the power-law index q of the grain size number-density (see discussion in Sect. 5.1), every
,
which cannot be explained by large values of the power-law index q of the grain size number-density (see discussion in Sect. 5.1), every ![]() -value can be reproduced by different (q,
-value can be reproduced by different (q,
![]() )
couples. Furthermore, at a fixed q, the precise value of the maximum grain size
)
couples. Furthermore, at a fixed q, the precise value of the maximum grain size
![]() correspondent to a certain derived
correspondent to a certain derived ![]() depends strongly on the model that one adopts for the dust. The only
robust conclusion which is valid for all the reasonable models of dust
analyzed so far is that
depends strongly on the model that one adopts for the dust. The only
robust conclusion which is valid for all the reasonable models of dust
analyzed so far is that ![]() -values lower than the value found for the ISM (
-values lower than the value found for the ISM (
![]() )
can be obtained only with dust populations in which grains as large as at least
)
can be obtained only with dust populations in which grains as large as at least ![]() 1 mm are present (see e.g. Natta et al. 2007). For these reasons in the rest of the paper we will rarely refer to the maximum grain size
1 mm are present (see e.g. Natta et al. 2007). For these reasons in the rest of the paper we will rarely refer to the maximum grain size
![]() ,
whereas we will more frequently use
,
whereas we will more frequently use ![]() as our proxy for grain growth.
as our proxy for grain growth.
In order to derive an estimate for
![]() and thus constrain the dust mass
and thus constrain the dust mass
![]() ,
one has to adopt a certain model for the dust grain which provide a family of functions
,
one has to adopt a certain model for the dust grain which provide a family of functions
![]() labeled with the q-parameter. The
labeled with the q-parameter. The
![]() functions considered in this paper have been obtained using the dust model presented in Sect. 4.2 and they are the same shown in Fig. 3 in R10.
functions considered in this paper have been obtained using the dust model presented in Sect. 4.2 and they are the same shown in Fig. 3 in R10.
Figure 3 reports the best fit flared disk model overplotted to the sub-mm/mm data for each disk in our sample![]() .
Since as explained in Sect. 4.1 for each disk we have adopted,
instead of a single value, an interval of possible values for
.
Since as explained in Sect. 4.1 for each disk we have adopted,
instead of a single value, an interval of possible values for
![]() and p,
the uncertainty on these parameters translates into an uncertainty on
the quantities derived by fitting the sub-mm/mm SED, i.e.
and p,
the uncertainty on these parameters translates into an uncertainty on
the quantities derived by fitting the sub-mm/mm SED, i.e. ![]() and
and
![]() .
Adding this contribution to the uncertainties in the observational
data, the total absolute uncertainties are approximately 0.4 for
.
Adding this contribution to the uncertainties in the observational
data, the total absolute uncertainties are approximately 0.4 for ![]() and a factor of
and a factor of ![]() 3-4 for
3-4 for
![]() .
.
5 Results
The results of the SED-fitting procedure are listed in Table 3. Here we discuss them in terms of dust grain growth (Sect. 5.1) and mass in dust (Sect. 5.2) for our sample of protoplanetary disks.
5.1 Grain growth
Information on the level of dust grain growth in the outer regions
of protoplanetary disks comes from the analysis of the spectral index
of the dust opacity at (sub-)millimeter wavelengths ![]() ,
which reflects the spectral index of the disk SED at these long wavelengths
,
which reflects the spectral index of the disk SED at these long wavelengths ![]() .
In particular for a completely optically thin disk in the Rayleigh-Jeans regime
.
In particular for a completely optically thin disk in the Rayleigh-Jeans regime
![]() ,
whereas if emission from the optically thick disk inner regions (i.e.
,
whereas if emission from the optically thick disk inner regions (i.e.
![]() AU)
and deviations of the emitted spectrum from the Rayleigh-Jeans regime
are taken into account, as done for our analysis,
AU)
and deviations of the emitted spectrum from the Rayleigh-Jeans regime
are taken into account, as done for our analysis,
![]() .
In the limit case of a completely optically thick disk even at these long wavelengths the SED spectral index
.
In the limit case of a completely optically thick disk even at these long wavelengths the SED spectral index ![]() becomes independent on
becomes independent on ![]() and so no information on grain growth would be obtainable. In Cols. (5) and (6) of Table 3 the constrained values of
and so no information on grain growth would be obtainable. In Cols. (5) and (6) of Table 3 the constrained values of ![]() and
and ![]() between 1 and 3 mm are reported
between 1 and 3 mm are reported![]() .
.
Figure 4 shows the SED spectral index
![]() plotted against the observed flux at 3.3 mm for all the sources in our sample. The spanned range in
plotted against the observed flux at 3.3 mm for all the sources in our sample. The spanned range in
![]() is 1.8-2.9, and there is no clear evidence of any correlation between
the two plotted quantities. The fact that all the disks in our sample
show a (sub-)mm spectral index which is shallower than the one found
for the ISM, i.e.
is 1.8-2.9, and there is no clear evidence of any correlation between
the two plotted quantities. The fact that all the disks in our sample
show a (sub-)mm spectral index which is shallower than the one found
for the ISM, i.e.
![]() ,
brings evidence of grain growth from an initial ISM-like dust population for all the disks in our sample
,
brings evidence of grain growth from an initial ISM-like dust population for all the disks in our sample![]() .
.
![\begin{figure}
\par\includegraphics[scale=0.5]{00017fg4.eps}
\end{figure}](/articles/aa/full_html/2010/13/aa15039-10/img109.png)
|
Figure 4:
Spectral index |
| Open with DEXTER | |
In Fig. 5 we report the histogram of the derived distribution of ![]() -values. All the disks show
-values. All the disks show
![]() ,
indicative of dust grain growth to at least mm-sizes. Note that for 9 out of the 17 disks
,
indicative of dust grain growth to at least mm-sizes. Note that for 9 out of the 17 disks
![]() (considering a
(considering a ![]() -uncertainty on
-uncertainty on ![]() of about 0.4) and for them the data are not consistent with the MRN-value of 3.5 for the power-law index q of the dust grain size distribution in the ISM (Mathis et al. 1977): for these disks q-values as low as 2.5-3 are needed (see discussion in R10).
of about 0.4) and for them the data are not consistent with the MRN-value of 3.5 for the power-law index q of the dust grain size distribution in the ISM (Mathis et al. 1977): for these disks q-values as low as 2.5-3 are needed (see discussion in R10).
![\begin{figure}
\par\includegraphics[scale=0.45]{00017fg5.eps}
\end{figure}](/articles/aa/full_html/2010/13/aa15039-10/img113.png)
|
Figure 5:
Distribution of the dust opacity spectral index |
| Open with DEXTER | |
The mean value is
![]() ,
which is consistent within 1
,
which is consistent within 1![]() with the one obtained for the Taurus sample discussed in R10 (
with the one obtained for the Taurus sample discussed in R10 (
![]() ).
In order to make a statistical comparison of the dust grain growth
between the Taurus sample and the one presented in this paper in the
).
In order to make a statistical comparison of the dust grain growth
between the Taurus sample and the one presented in this paper in the ![]() -Oph star forming region we performed a two-sample KS test. The probability that the two samples have
-Oph star forming region we performed a two-sample KS test. The probability that the two samples have ![]() -values drawn from the same distribution is
-values drawn from the same distribution is ![]()
![]() .
The hypothesis that the samples in Taurus and Ophiuchus have the same
.
The hypothesis that the samples in Taurus and Ophiuchus have the same ![]() -distribution cannot thus be rejected at the
-distribution cannot thus be rejected at the ![]() of confidence level.
of confidence level.
In Fig. 6 we plot the (sub-)mm spectral index of the dust opacity ![]() against the stellar age for YSOs in different evolutionary stages: the
38 class II disks in Ophiuchus and Taurus presented here and in
R10 respectively, and a sample of 15 less evolved class 0 YSOs
against the stellar age for YSOs in different evolutionary stages: the
38 class II disks in Ophiuchus and Taurus presented here and in
R10 respectively, and a sample of 15 less evolved class 0 YSOs![]() in Taurus, Perseus, and isolated from the PROSAC survey (Joergensen et al. 2007) and from Kwon et al. (2009). Contrary to the class II disks, for all the class 0 objects the values of
in Taurus, Perseus, and isolated from the PROSAC survey (Joergensen et al. 2007) and from Kwon et al. (2009). Contrary to the class II disks, for all the class 0 objects the values of ![]() have been obtained using the approximated
have been obtained using the approximated
![]() relation (see caption of Fig. 6). As described before, this relation gives only a lower-limit for
relation (see caption of Fig. 6). As described before, this relation gives only a lower-limit for ![]() ,
and this probably explains why for many of these sources the derived
,
and this probably explains why for many of these sources the derived ![]() is negative. A more sophisticated analysis is needed to get more robust estimates of
is negative. A more sophisticated analysis is needed to get more robust estimates of ![]() by taking into account self-consistently deviations from the above
relation as due to departures from the Rayleigh-Jeans regime of the
emission (expecially for these cold sources) and to marginally
optically thick emission typically associated to the compact structure
forming the disk. However, the low values of
by taking into account self-consistently deviations from the above
relation as due to departures from the Rayleigh-Jeans regime of the
emission (expecially for these cold sources) and to marginally
optically thick emission typically associated to the compact structure
forming the disk. However, the low values of ![]() obtained for nearly all these sources appear to show evidence for dust grain growth to
obtained for nearly all these sources appear to show evidence for dust grain growth to ![]() mm-sizes (see Fig. 3 in R10) already in the earliest stages of star formation. Ormel et al. (2009)
have recently investigated the effects of dust coagulation and
fragmentation onto the dust size distribution in molecular cloud cores.
They found that grain sizes close to
mm-sizes (see Fig. 3 in R10) already in the earliest stages of star formation. Ormel et al. (2009)
have recently investigated the effects of dust coagulation and
fragmentation onto the dust size distribution in molecular cloud cores.
They found that grain sizes close to ![]() 1 mm
can be formed if cloud lifetimes are not restricted to free-fall times
but rather support mechanisms like e.g. ambipolar diffusion are present
and if freeze-out of ice has commenced. According to their simulations
ice-coated grains can grow to sizes of
1 mm
can be formed if cloud lifetimes are not restricted to free-fall times
but rather support mechanisms like e.g. ambipolar diffusion are present
and if freeze-out of ice has commenced. According to their simulations
ice-coated grains can grow to sizes of ![]() 0.3-8 mm in one ambipolar diffusion timescale at densities of
n = 105-107 cm-3, which are typical of the inner regions of molecular cores. Dust grain growth to
0.3-8 mm in one ambipolar diffusion timescale at densities of
n = 105-107 cm-3, which are typical of the inner regions of molecular cores. Dust grain growth to ![]() mm-sizes can thus be a process accompanying the very first phases of star formation.
mm-sizes can thus be a process accompanying the very first phases of star formation.
![\begin{figure}
\par\includegraphics[scale=0.5]{00017fg6.eps}
\end{figure}](/articles/aa/full_html/2010/13/aa15039-10/img118.png)
|
Figure 6:
Dust opacity spectral index |
| Open with DEXTER | |
Figure 6 shows also that
there is no relation between the dust opacity spectral index and the
stellar age for the class II disks: grains as large as ![]() 1 mm
appears to be present in the outer regions of disks throughout all the
class II evolutionary stage. This is in contrast with the short
timescales of inward radial drift expected for
1 mm
appears to be present in the outer regions of disks throughout all the
class II evolutionary stage. This is in contrast with the short
timescales of inward radial drift expected for ![]() mm/cm-sized
grains in the outer disk as a consequence of the dust interaction with
the gas component. In order to explain the retention of large dust
grains in these outer regions some mechanisms which may halt the drift
of solid particles, e.g. local pressure maxima due to turbulent
vortices or spiral density waves, have been invoked. Birnstiel
et al. (2010b) have
compared the observed fluxes at millimeter wavelengths for the disks
samples described in R10 and in this paper with predictions of dust
evolution models accounting for coagulation and fragmentation. They
showed that, if radial drift of solid particles is completely
suppressed, a grain size distribution at the steady-state (due to a
balance between coagulation and fragmentation) can explain the mm-wave
emission of the brightest disks. The observed flux of the fainter disks
are instead typically overpredicted even by more than one order of
magnitude. These discrepancies may be explained by considering in the
disk models a dust reduction due to radial drift at a reduced rate
mm/cm-sized
grains in the outer disk as a consequence of the dust interaction with
the gas component. In order to explain the retention of large dust
grains in these outer regions some mechanisms which may halt the drift
of solid particles, e.g. local pressure maxima due to turbulent
vortices or spiral density waves, have been invoked. Birnstiel
et al. (2010b) have
compared the observed fluxes at millimeter wavelengths for the disks
samples described in R10 and in this paper with predictions of dust
evolution models accounting for coagulation and fragmentation. They
showed that, if radial drift of solid particles is completely
suppressed, a grain size distribution at the steady-state (due to a
balance between coagulation and fragmentation) can explain the mm-wave
emission of the brightest disks. The observed flux of the fainter disks
are instead typically overpredicted even by more than one order of
magnitude. These discrepancies may be explained by considering in the
disk models a dust reduction due to radial drift at a reduced rate![]() or during an earlier evolutionary time or due to efficient conversion
of dust into larger, unseen bodies (see Birnstiel et al. 2010b for more details). Observations of these faint disks can thus help us to determine
which mechanisms play a major role for the dynamics and evolution of large grains in the outer regions of disks.
or during an earlier evolutionary time or due to efficient conversion
of dust into larger, unseen bodies (see Birnstiel et al. 2010b for more details). Observations of these faint disks can thus help us to determine
which mechanisms play a major role for the dynamics and evolution of large grains in the outer regions of disks.
![\begin{figure}
\par\includegraphics[scale=0.45]{00017fg7.eps}
\end{figure}](/articles/aa/full_html/2010/13/aa15039-10/img119.png)
|
Figure 7:
SED spectral index between 1 and 3 mm versus indicators of grain growth from the 10- |
| Open with DEXTER | |
Figure 7 shows the spectral
index between 1 and 3 mm in Taurus (left) and Ophiuchus (right)
plotted against two indicators of dust processing from the silicate
feature observed at about 10 ![]() m (see e.g. Kessler-Silacci et al. 2006). Data for the 10
m (see e.g. Kessler-Silacci et al. 2006). Data for the 10 ![]() m
silicate feature for the two samples in Taurus and Ophiuchus come from
the literature and refer to different indicators (see caption of
Fig. 7) since we could not find the same indicator for both the regions. However Lommen et al. (2010)
showed that these two indicators correlate well and so they can be both
used to probe the growth of grains from interstellar, submicron sizes
to sizes of several microns in the disk surface layers. In particular
low values of the ratio between the 10
m
silicate feature for the two samples in Taurus and Ophiuchus come from
the literature and refer to different indicators (see caption of
Fig. 7) since we could not find the same indicator for both the regions. However Lommen et al. (2010)
showed that these two indicators correlate well and so they can be both
used to probe the growth of grains from interstellar, submicron sizes
to sizes of several microns in the disk surface layers. In particular
low values of the ratio between the 10 ![]() m line flux and the continuum,
m line flux and the continuum,
![]() ,
and large values of the ratio between the fluxes at 11.3 and 9.8
,
and large values of the ratio between the fluxes at 11.3 and 9.8 ![]() m,
F11.3/F9.8, are interpreted in terms of grain growth to micron sizes (Bouwman et al. 2001; Kessler-Silacci et al. 2006). Very recently Lommen et al. (2010)
have found a tentative correlation between these quantities for a
sample of about 30 TTS and Herbig-Ae/Be systems spread over five
different star forming regions, including Taurus-Auriga. Since the mm
slope of the SED probes grains in the disk outer regions whereas the 10-
m,
F11.3/F9.8, are interpreted in terms of grain growth to micron sizes (Bouwman et al. 2001; Kessler-Silacci et al. 2006). Very recently Lommen et al. (2010)
have found a tentative correlation between these quantities for a
sample of about 30 TTS and Herbig-Ae/Be systems spread over five
different star forming regions, including Taurus-Auriga. Since the mm
slope of the SED probes grains in the disk outer regions whereas the 10-![]() m
silicate feature is sensitive to grains in the inner regions, the
tentative correlation may indicate a parallel evolution of the inner
and outer disk in terms of dust grain growth. However, in this work we
do not find any correlation neither for the sample in Taurus nor for
the one in Ophiuchus. Note that in the case of Ophiuchus the sample
with literature data for the 10-
m
silicate feature is sensitive to grains in the inner regions, the
tentative correlation may indicate a parallel evolution of the inner
and outer disk in terms of dust grain growth. However, in this work we
do not find any correlation neither for the sample in Taurus nor for
the one in Ophiuchus. Note that in the case of Ophiuchus the sample
with literature data for the 10-![]() m
silicate feature is limited to eight disks only. In Taurus our sample
comprises nine of the eleven disks considered by Lommen et al.,
and for two of them (AA Tau and GM Aur) our derived values of
m
silicate feature is limited to eight disks only. In Taurus our sample
comprises nine of the eleven disks considered by Lommen et al.,
and for two of them (AA Tau and GM Aur) our derived values of
![]() are not consistent with and lower than the values used by Lommen et al.
are not consistent with and lower than the values used by Lommen et al.![]() .
Note also that the absence of such a correlation would not be too
surprising since the physical mechanisms which are responsible for the
observed values of the grain growth indicators are different: the
presence of mm/cm-sized pebbles in the midplane of the outer disk is
mainly due to coagulation processes and mechanisms which trap these
pebbles in the outer disk, whereas the presence of
.
Note also that the absence of such a correlation would not be too
surprising since the physical mechanisms which are responsible for the
observed values of the grain growth indicators are different: the
presence of mm/cm-sized pebbles in the midplane of the outer disk is
mainly due to coagulation processes and mechanisms which trap these
pebbles in the outer disk, whereas the presence of ![]() m-sized
grains in the surface layers of the inner disk is probably regulated by
fragmentation of larger solid particles and a balance between settling
and turbulence mixing which keeps these relatively small grains in the
uppermost layers of the disk. Further observations with more sensitive
telescopes in the future are needed to provide necessary the necessary
statistics to better investigate the possible relation between dust
grains in the outer and inner disk regions and to possibly constrain
the processes of radial mixing and vertical settling.
m-sized
grains in the surface layers of the inner disk is probably regulated by
fragmentation of larger solid particles and a balance between settling
and turbulence mixing which keeps these relatively small grains in the
uppermost layers of the disk. Further observations with more sensitive
telescopes in the future are needed to provide necessary the necessary
statistics to better investigate the possible relation between dust
grains in the outer and inner disk regions and to possibly constrain
the processes of radial mixing and vertical settling.
5.2 Disk mass
Table 3 lists the derived
dust masses for our sample of disks detected at 3 mm. As already
discussed in R10, the inferred dust mass depends, at a given chemical
composition and porosity for the dust grain, on the assumed value of
the power-law index q of the grain size distribution. This
dependence, which is due to the different millimeter dust opacities
obtained for different values of q (see R10), is particularly strong for relatively low values of ![]() .
For example, in the case of WSB 60, with
.
For example, in the case of WSB 60, with
![]() ,
,
![]() is larger than
is larger than
![]() by a factor of about 10.
by a factor of about 10.
Even if the estimate for
![]() depends on the value of q, the range spanned by our sample for q=2.5 and q=3 turns out to be very similar
depends on the value of q, the range spanned by our sample for q=2.5 and q=3 turns out to be very similar![]() ,
namely
,
namely ![]()
![]() ,
corresponding to roughly 6-1000
,
corresponding to roughly 6-1000
![]() .
By defining a planetesimal as a rocky body with a radius of 10 km
and a density similar to the one adopted for our dust grain model (i.e.
.
By defining a planetesimal as a rocky body with a radius of 10 km
and a density similar to the one adopted for our dust grain model (i.e.
![]() g/cm3),
the maximum number of planetesimals which can be potentially formed out
of this reservoir of small grains (see discussion below) is
g/cm3),
the maximum number of planetesimals which can be potentially formed out
of this reservoir of small grains (see discussion below) is ![]() 1010-1012.
1010-1012.
These numbers have to be taken with great caution mainly because of the large uncertainty for the inferred dust mass of a factor as large as 10 (see e.g. the discussion in Natta et al. 2004).
Here it is important to remember that observations at (sub-)mm
wavelengths are completely insensitive to pebbles/stones much larger
than ![]() 1-10 cm, since the dust opacity decreases as the
1-10 cm, since the dust opacity decreases as the
![]() of the dust population increases at sizes larger than the wavelengths
of the observations. For this reason the dust masses presented here
have to be interpreted as lower limits for the real total mass in
solids, since in principle large pebbles/stones or even larger rocky
bodies like planetesimals may be already present in the disk.
of the dust population increases at sizes larger than the wavelengths
of the observations. For this reason the dust masses presented here
have to be interpreted as lower limits for the real total mass in
solids, since in principle large pebbles/stones or even larger rocky
bodies like planetesimals may be already present in the disk.
Finally we have investigated relations between dust properties in disks (i.e. ![]() ,
,
![]() )
and the stellar ones (listed in Table 2)
but we did not find any significant correlation, similarly to the case
of Taurus (R10). No significant correlation was found neither between
grain growth and dust mass.
)
and the stellar ones (listed in Table 2)
but we did not find any significant correlation, similarly to the case
of Taurus (R10). No significant correlation was found neither between
grain growth and dust mass.
6 Summary
We have presented new observations at ![]() 3 mm obtained with the ATCA array and the new CABB digital filter bank for 27 protoplanetary disks in the
3 mm obtained with the ATCA array and the new CABB digital filter bank for 27 protoplanetary disks in the ![]() -Oph
star forming region. Among these we selected the 17 isolated
class II YSOs with well characterized stellar properties (see
selection criteria in Sect. 3.1). Our sample comprises all the
-Oph
star forming region. Among these we selected the 17 isolated
class II YSOs with well characterized stellar properties (see
selection criteria in Sect. 3.1). Our sample comprises all the ![]() -Oph isolated class II YSOs with an observed flux at 1.3 mm larger than
-Oph isolated class II YSOs with an observed flux at 1.3 mm larger than ![]() 75 mJy, and
75 mJy, and ![]()
![]() of the isolated PMS stars with mass larger than
of the isolated PMS stars with mass larger than ![]() 0.5
0.5 ![]() .
We have analyzed the (sub-)millimeter SED of our disk sample and here is the summary of our main findings:
.
We have analyzed the (sub-)millimeter SED of our disk sample and here is the summary of our main findings:
- 1.
- The spectral index
 of the millimeter dust opacity turns out to be lower than the typical
value found for the ISM for all the 17 disks detected at 3 mm. The
mean value is
of the millimeter dust opacity turns out to be lower than the typical
value found for the ISM for all the 17 disks detected at 3 mm. The
mean value is
 .
For the ten disks which have been observed and spatially resolved
through past high-angular resolution continuum imaging at sub-mm
wavelengths this represents evidence for the presence of dust grains as
large as at least 1 mm
in the disk outer regions. For the seven disks which have not been
mapped yet the observations could in principle be consistent also with
very compact (
.
For the ten disks which have been observed and spatially resolved
through past high-angular resolution continuum imaging at sub-mm
wavelengths this represents evidence for the presence of dust grains as
large as at least 1 mm
in the disk outer regions. For the seven disks which have not been
mapped yet the observations could in principle be consistent also with
very compact (
 AU) disks, significantly different from those mapped so far.
- 2.
- From a comparison between the results found for our sample in -Oph
and an homogeneously selected sample of 21 isolated class II disks
in Taurus-Auriga (R10), there is no statistical evidence of any
difference between the distribution of -values
found in the two star forming regions. This may suggest that
environmental effects do not play an important role in the first phases
of planet formation.
- 3.
- There is no evidence for any evolution of the dust spectral
index: dust grains appear to be present in the outer regions of
protoplanetary disks throughout all the class II evolutionary
stage of YSOs, confirming what previously found in Taurus. In order to
explain the retention of large dust grains in the outer disk some
mechanisms which may halt the inward drift of solid particles, e.g.
local pressure maxima due to turbulent vortices or spiral density
waves, have to be invoked. Since evidence for grain growth to
millimeter sizes appears to be present in some class 0 YSOs the
formation of the mm-sized
grains seen in class II disks may already occur in the densest
inner regions of molecular cloud cores (Ormel et al. 2009).
- 4.
- The mm slope of the SED does not correlate with indicators of
dust processing from the silicate feature observed at about 10
 m,
which are sensitive to grain growth to micron sizes in the surface
layers of the inner disk; further observations at (sub-)mm wavelengths
are needed to extend the investigation to a larger sample.
m,
which are sensitive to grain growth to micron sizes in the surface
layers of the inner disk; further observations at (sub-)mm wavelengths
are needed to extend the investigation to a larger sample. - 5.
- The spanned range in dust mass contained in grains with sizes
 1 cm as derived with the dust model described in Sect. 4.2 is about
 or roughly 6-1000
 .
This reservoir of small grains is capable of forming about
1010-1012 10 km-sized planetesimals with a mean density of 1 g/cm3.
.
This reservoir of small grains is capable of forming about
1010-1012 10 km-sized planetesimals with a mean density of 1 g/cm3.
We are grateful to an anonymous referee for suggestions that helped to improve the clarity of the paper. We wish to thank the support astronomers in Narrabri, in particular James Urquhart and Maxim Voronkov, for their help during the ATCA observations. L.R. aknowledges the PhD fellowship of the International Max-Planck-Research School. L.T. and A.N. were partly supported by the grant ASI-COFIS I/016/07/0.
References
- Andrews, S. M., & Williams, J. P. 2007a, ApJ, 671, 1800 [CrossRef] [Google Scholar]
- Andrews, S. M., & Williams, J. P. 2007b, ApJ, 659, 705 [NASA ADS] [CrossRef] [Google Scholar]
- Andrews, S. M., Wilner, D. J., Hughes, A. M., Qi, C., & Dullemond, C. P. 2009, ApJ, 700, 1502 [NASA ADS] [CrossRef] [Google Scholar]
- Beckwith, S. V. W., & Sargent, A. I. 1991, ApJ, 381, 250 [NASA ADS] [CrossRef] [Google Scholar]
- Beckwith, S. V. W., Henning, Th., & Nakagawa, Y. 2000, in Protostar & Planets IV, ed. V. Mannings, A. P. Boss, & S. S. Russell (Tucson: Univ. of Arizona Press), 533 [Google Scholar]
- Birnstiel, T., Dullemond, C. P., & Brauer, F. 2009, A&A, 503, 5 [Google Scholar]
- Birnstiel, T., Dullemond, C. P., & Brauer, F. 2010a, A&A, 513, 79 [Google Scholar]
- Birnstiel, T., Ricci, L., Trotta, F., et al. 2010b, A&A, 516, L14 [NASA ADS] [CrossRef] [EDP Sciences] [Google Scholar]
- Bouwman, J., Meeus, G., de Koter, A., et al. 2001, A&A, 375, 950 [NASA ADS] [CrossRef] [EDP Sciences] [Google Scholar]
- Brown, J. M., Blake, G. A., Qi, C., et al. 2009, ApJ, 704, 496 [NASA ADS] [CrossRef] [Google Scholar]
- Cardelli, J. A., Clayton, G. C., & Mathis, J. S. 1989, ApJ, 345, 245 [NASA ADS] [CrossRef] [Google Scholar]
- Chiang, E. I., & Goldreich, P. 1997, ApJ, 490, 368 [NASA ADS] [CrossRef] [Google Scholar]
- Cutri, R. M., et al. 2003, 2MASS All Sky Catalog of point sources [Google Scholar]
- Dent, W. R. F., Matthews, H. E., & Ward-Thompson, D. 1998, MNRAS, 301, 1049 [NASA ADS] [CrossRef] [Google Scholar]
- Draine, B. T. 2006, ApJ, 636, 1114 [NASA ADS] [CrossRef] [Google Scholar]
- Dominik, C., Blum, J., Cuzzi, J. N., & Wurm, G. 2007, in Protostars & Planets V, ed. B. Reipurth, D. Jewitt, & K. Keil (Tucson: University of Arizona Press), 783 [Google Scholar]
- Dullemond, C. P., Dominik, C., & Natta, A. 2001, ApJ, 560, 957 [NASA ADS] [CrossRef] [Google Scholar]
- Furlan, E., Hartmann, L., Calvet, N., et al. 2006, ApJS, 165, 568 [NASA ADS] [CrossRef] [MathSciNet] [Google Scholar]
- Gullbring, E., Hartmann, L., Briceño, C., & Calvet, N. 1998, ApJ, 492, 323 [NASA ADS] [CrossRef] [Google Scholar]
- Joergensen, J. K., Bourke, T. L., Myers, P. C., et al. 2007, ApJ, 659, 479 [NASA ADS] [CrossRef] [Google Scholar]
- Kessler-Silacci, J., Augereau, J. C., Dullemond, C. P., et al. 2006, ApJ, 639, 275 [NASA ADS] [CrossRef] [Google Scholar]
- Kwon, W., Looney, L. W., Mundy, L. G., Chiang, H.-F., & Kemball, A. J. 2009, ApJ, 696, 841 [NASA ADS] [CrossRef] [Google Scholar]
- Lombardi, M., Lada, C. J., & Alves, J. 2008, A&A, 480, 785 [NASA ADS] [CrossRef] [EDP Sciences] [Google Scholar]
- Lommen, D., Wright, C. M., Maddison, S. T., et al. 2007, A&A, 462, 211 [NASA ADS] [CrossRef] [EDP Sciences] [Google Scholar]
- Lommen, D., van Dishoeck, E. F., Wright, C. M., et al. 2010, A&A, 515, 77 [Google Scholar]
- Luhman, K. L. 1999, ApJ, 525, 466 [NASA ADS] [CrossRef] [Google Scholar]
- Lynden-Bell, D., & Pringle, J. E. 1974, MNRAS, 168, 603 [NASA ADS] [CrossRef] [Google Scholar]
- Mathis, J. S., Rumpl, W., & Nordsieck, K. H. 1977, ApJ, 217, 425 [NASA ADS] [CrossRef] [Google Scholar]
- McCabe, C., Ghez, A. M., Prato, L., et al. 2006, ApJ, 636, 932 [NASA ADS] [CrossRef] [Google Scholar]
- McClure, M. K., Furlan, E., Manoj, P., et al. 2010, ApJS, 188, 75 [NASA ADS] [CrossRef] [Google Scholar]
- Meyer, M. R., Calvet, N., & Hillenbrand, L. A. 1997, AJ, 114, 288 [NASA ADS] [CrossRef] [Google Scholar]
- Motte, F., Andre, P., & Neri, R. 1998, A&A, 336, 150 [NASA ADS] [Google Scholar]
- Natta, A., Testi, L., Neri, R., Shepherd, D. S., & Wilner, D. J. 2004, A&A, 416, 179 [NASA ADS] [CrossRef] [EDP Sciences] [Google Scholar]
- Natta, A., Testi, L., & Randich, S. 2006, A&A, 452, 245 [NASA ADS] [CrossRef] [EDP Sciences] [Google Scholar]
- Natta, A., Testi, L., Calvet, N., et al. 2007, in Protostars & Planets V, ed. B. Reipurth, D. Jewitt, & K. Keil (Tucson: University of Arizona Press), 783 [Google Scholar]
- Ormel, C. W., Paszun, D., Dominik, C., & Tielens, A. G. G. M. 2009, A&A, 502, 845 [NASA ADS] [CrossRef] [EDP Sciences] [Google Scholar]
- Palla, F., & Stahler, S. W. 1999, ApJ, 525, 772 [NASA ADS] [CrossRef] [Google Scholar]
- Pollack, J. B., Hollenbach, D., Beckwith, S., et al. 1994, ApJ, 421, 615 [NASA ADS] [CrossRef] [Google Scholar]
- Ratzka, T., Köhler, R., & Leinert, Ch. 2005, A&A, 437, 611 [NASA ADS] [CrossRef] [EDP Sciences] [Google Scholar]
- Reipurth, B., & Zinnecker, H. 1993, A&A, 278, 81 [NASA ADS] [Google Scholar]
- Ricci, L., Testi, L., Natta, A., et al. 2010, A&A, 512, 15 (R10) [Google Scholar]
- Rodmann, J., Henning, T., Chandler, C. J., Mundy, L. G., & Wilner, D. J. 2006, A&A, 446, 211 [NASA ADS] [CrossRef] [EDP Sciences] [Google Scholar]
- Schmidt-Kaler, T. 1982, in Landolt-BornsteinGroup VI, ed. K.-H. Hellwege (Berlin: Springer), 2, 454 [Google Scholar]
- Simon, M., Ghez, A. M., Leinert, Ch., et al. 1995, ApJ, 443, 625 [NASA ADS] [CrossRef] [Google Scholar]
- Testi, L., Natta, A., Shepherd, D. S., & Wilner, D. J. 2003, A&A, 403, 323 [NASA ADS] [CrossRef] [EDP Sciences] [Google Scholar]
- Van Boekel, R., Waters, L. B. F. M., Dominik, C., et al. 2003, A&A, 400, 21 [NASA ADS] [CrossRef] [EDP Sciences] [Google Scholar]
- Warren, S. G. 1984, ApOpt, 23, 1206 [Google Scholar]
- Weingartner, J. C., & Draine, B. T. 2001, ApJ, 548, 296 [NASA ADS] [CrossRef] [Google Scholar]
- Wilking, B. A., Gagné, M., & Allen, L. E. 2008, in Handbook of Star Forming Regions: Volume II, The Southern Sky, ed. Reipurth (San Francisco, CA: ASP), 351 [Google Scholar]
- Wilner, D. J., Ho, P. T. P., Kastner, J. H., & Rodríguez, L. F. 2000, ApJ, 534, L101 [NASA ADS] [CrossRef] [PubMed] [Google Scholar]
- Zubko, V. G., Mennella, V., Colangeli, L., & Bussoletti, E. 1996, MNRAS, 282, 1321 [NASA ADS] [CrossRef] [Google Scholar]
Footnotes
- ... (ATCA
- The Australia Telescope Compact Array is part of the Australia Telescope which is funded by the Commonwealth of Australia for operation as a National Facility managed by CSIRO.
- ... calibration
- For the data reduction we used the MIRIAD package.
- ... analysis
- Note that the final sample used in the analysis does not comprise all the targets of the new ATCA observations described in Sect. 2.
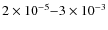
- ... range
- Note that in R10 a slightly narrower spectral range of
 mm
was chosen. We adopted a broader spectral range to include in our
sample the sources YLW 16c and WSB 52, for which no observations at
mm
was chosen. We adopted a broader spectral range to include in our
sample the sources YLW 16c and WSB 52, for which no observations at
 mm
have been carried out so far. The different uncertainties for the
spectral slopes of these sources, due to a shorter spectral leverage,
are properly taken into account in the analysis.
mm
have been carried out so far. The different uncertainties for the
spectral slopes of these sources, due to a shorter spectral leverage,
are properly taken into account in the analysis.
- ... models
- Note that this completeness level is very close to the one obtained in R10 in the Taurus-Auriga star forming region, i.e.
 of the isolated class II YSOs with stellar masses larger than
 .
.
- ... therein
- For only two cases in our sample, i.e. EL 20 and IRS 41, the spectral types are not available in Andrews & Williams (2007a). For these PMS stars we adopted the stellar types from Natta et al. (2006) which are based on near infrared broad band photometry.
- ...-Oph
- For IRS 41, for which the 2MASS J-band flux is not available, we adopted the luminosities as derived by Natta et al. (2006), after correcting them by a multiplicative factor (130 pc/150 pc)2 to account for the different adopted distance of 150 pc in the Natta et al. paper.
- ...

- We also consider the same value of q for both the surface and the midplane. However, contrary to the dust in the midplane where q is a relevant parameter, in the disk surface the adopted q-value is practically non influential since
 is only slightly larger than
.
is only slightly larger than
.
- ... midplane
- Note that this is true only in the case in which the dust emission at long wavelengths comes mostly from the optically thin disk outer regions, as described at the end of Sect. 4.1.
- ... sample
- Note that for a few disks (SR 4, EL 20, RNO 90) the flux at 1 mm
falls below the model line. Although this could be due to problems in
the observations, another possible reason is that the 3 mm-flux
for these sources is contaminated by free-free emission. If this was
the case, the derived -values
for these disks would be only lower-limits. Observations at longer
wavelengths, where free-free dominates the emission, are needed to
constrain its possible contribution at 3 mm.
- ... reported
- Note that the difference
 turns
out to be in the range 1.6-1.9. This (small) discrepancy from the value
of 2 is primarly due to the low temperature of the outer disk
midplane and the consequent deviation from the Rayleigh-Jeans regime of
the mm-wave emission.
turns
out to be in the range 1.6-1.9. This (small) discrepancy from the value
of 2 is primarly due to the low temperature of the outer disk
midplane and the consequent deviation from the Rayleigh-Jeans regime of
the mm-wave emission.
- ... sample
- This sentence is strictly valid for the ten disks in our
sample which have been mapped so far; for the seven disks which have
not been mapped yet this sentence is valid only if the underlying
assumption that their spatial extension is not so small that most of
the mm emission is optically thick (
 AU) holds true.
- ... YSOs
- Note that for these objects there are no robust age-estimates.
- ... rate
- The radial drift, other than decreasing the amount of dust in the disk and thus decreasing the flux at millimeter wavelengths, is more efficient for mm/cm-sized pebbles than for smaller grains in the outer disk. For this reason, if one wants to explain the low values of the mm-spectral indeces only a reduced rate of radial drift (from that expected theoretically) can be invoked.
- ... et al.
- This discrepancy is probably due to a different choice of the literature data used for the derivation of
 .
In the case of R10 all the data obtained at sub-mm and mm wavelengths have been used.
.
In the case of R10 all the data obtained at sub-mm and mm wavelengths have been used.
- ... similar
- Note however that for the four disks with the lowest value of
(
 0)
0)
 cannot be obtained. The reason for this is that these very low -values cannot be explained with q=3 (see discussion in Sect. 5.1). For the same reason only two disks have an estimate for the dust mass with q=3.5.
All Tables
Table 1: Summary of the 3.3 mm ATCA observations.
Table 2: Stellar properties of the considered sample.
Table 3: Disk properties.
All Figures
|
|
Figure 1: Histograms higlighting some properties of our selected sample. In both the histograms our sample is represented by black columns, while the total columns (black+white) include all the class II YSOs from the Andrews & Williams (2007a) catalogue with no evidence of stellar companions in the 0.05-4.0'' interval in angular separation, from which our sample has been selected (see Sect. 3.1). Left) distribution of the fluxes at 1.3 mm, including upper limits; Right) distribution of stellar spectral type (see Sect. 3.3). |
| Open with DEXTER | |
| In the text | |
|
|
Figure 2:
H-R diagram for the sources of our sample. The dashed and solid lines
represent the isochrones and evolutionary tracks respectively from the
Palla & Stahler (1999)
PMS evolutionary models. In this diagram the evolutionary tracks start
from an age of 0.1 Myr. The uncertainties, not shown in the plot,
are typically |
| Open with DEXTER | |
| In the text | |
|
|
Figure 3:
Sub-mm/mm SED fits for the 17 sources in our sample with the two-layer
flared disk models (solid lines). The errorbars in the plots take into
account an uncertainty of 10% on the absolute flux scale at wavelengths
shorter than 3 mm, and of 25% at 3 mm. The fitting
values of the spectral index |
| Open with DEXTER | |
| In the text | |
|
|
Figure 4:
Spectral index |
| Open with DEXTER | |
| In the text | |
|
|
Figure 5:
Distribution of the dust opacity spectral index |
| Open with DEXTER | |
| In the text | |
|
|
Figure 6:
Dust opacity spectral index |
| Open with DEXTER | |
| In the text | |
|
|
Figure 7:
SED spectral index between 1 and 3 mm versus indicators of grain growth from the 10- |
| Open with DEXTER | |
| In the text | |
Copyright ESO 2010
Current usage metrics show cumulative count of Article Views (full-text article views including HTML views, PDF and ePub downloads, according to the available data) and Abstracts Views on Vision4Press platform.
Data correspond to usage on the plateform after 2015. The current usage metrics is available 48-96 hours after online publication and is updated daily on week days.
Initial download of the metrics may take a while.