| Issue |
A&A
Volume 525, January 2011
|
|
|---|---|---|
| Article Number | A48 | |
| Number of page(s) | 11 | |
| Section | Stellar structure and evolution | |
| DOI | https://doi.org/10.1051/0004-6361/201015033 | |
| Published online | 30 November 2010 | |
INTEGRAL, Swift, and RXTE observations of the 518 Hz accreting transient pulsar Swift J1749.4−2807
1
ISDC Data Center for Astrophysics of the University of Geneva chemin
d’Écogia, 16 1290
Versoix,
Switzerland
e-mail: carlo.ferrigno@unige.ch
2
International Space Science Institute (ISSI) Hallerstrasse
6, 3012
Bern,
Switzerland
3
INAF - Osservatorio Astronomico di Roma,
via Frascati 33, 00044
Rome,
Italy
4
INAF - Osservatorio Astronomico di Brera,
via Emilio Bianchi 46,
23807
Merate ( LC), Italy
5
ESA, European Space Astronomy Centre (ESAC),
PO Box 78, 28691
Villanueva de la Cañada
( Madrid),
Spain
6
Universitá degli Studi di Cagliari, Dipartimento di
Fisica, SP Monserrato-Sestu, KM
0.7, 09042
Monserrato ( CA), Italy
7
INAF Osservatorio Astronomico di Cagliari,
Poggio dei Pini, Strada 54,
09012
Capoterra ( CA), Italy
Received: 24 May 2010
Accepted: 13 September 2010
Context. The burst-only source Swift J1749.4−2807 was discovered in a high X-ray-active state, during an INTEGRAL observations of the Galactic bulge on 2010 April 10. Pulsations at 518 Hz were discovered in the RXTE data, confirming previous suggestions of possible associations between burst-only sources and accreting millisecond X-ray pulsars. The subsequent discovery of X-ray eclipses made Swift J1749.4−2807 the first eclipsing accreting millisecond X-ray pulsar.
Aims. We obtain additional information on Swift J1749.4−2807 and other burst-only sources.
Methods. We report on the results of a monitoring campaign on the source, carried out for about two weeks with the Swift, INTEGRAL, and RXTE satellites.
Results. The observations showed that the X-ray spectrum (energy range 0.5–40 keV) of Swift J1749.4−2807 during the entire event was accurately modeled by an absorbed power-law model (NH ≃ 3 × 1022 cm-2, Γ ≃ 1.7). X-ray eclipses were also detected in the Swift data and provides a clear evidence of a dust-scattering halo located along the line of sight to the source. Only one type-I X-ray burst was observed throughout the two-weeks long monitoring. The X-ray flux of Swift J1749.4−2807 decayed below the detection threshold of Swift /XRT about 11 days after the discovery, in a exponential fashion (e-folding time of  days).
Conclusions. We compare the properties of the outburst observed from Swift J1749.4−2807 with those of the previously known millisecond X-ray pulsars and other transient low mass X-ray binaries.
Key words: X-rays: binaries / binaries: eclipsing / X-rays: individual: Swift J1749.4 − 2807 / stars: neutron
© ESO, 2010
1. Introduction
Low mass X-ray binaries (LMXBs) consist of a low-mass donor star (<1 M⊙) and a compact object that accretes matter through an accretion disk. Most LMXBs are transients, i.e. they undergo week-to-month long outbursts during which the accretion takes place at high rates, giving rise to typical (“persistent”) X-ray luminosity of ~1036−38 erg/s. This is ≳ 100 times higher than the X-ray luminosity displayed in quiescence (see e.g. Bildsten et al. 1998; Campana et al. 1998; Liu et al. 2007, for reviews). Depending on the peak X-ray luminosity reached during the outburst (Lpeak), transient LMXBs are historically classified as “bright transient” (Lpeak ≃ 1037−38 erg/s), “faint transient” (Lpeak ≃ 1036−37 erg/s), or “very faint transients” (Lpeak ≤ 1036 erg/s, see e.g., Wijnands et al. 2006; Campana 2009). The outbursts of transient LMXBs are usually interpreted in terms of disk instability models (see e.g., Frank et al. 2002). In a number of these sources, an accreting neutron star (NS) as a compact object has been unambiguously identified by the detection of type-I X-ray bursts and/or coherent pulsations. The former are bright (~1038 erg/s) and short (~10−60 s) flares that result from thermonuclear explosions occurring in the material accreted at the NS surface (see e.g. Lewin et al. 1993; Strohmayer & Bildsten 2006, for reviews).
A peculiar subclass of transient LMXBs was discovered about 10 years ago, mainly thanks to the long-term monitoring of the Galactic center carried out with the BeppoSAX wide field cameras (WFC, Heise et al. 1999; Cocchi et al. 2001; Cornelisse et al. 2002a, 2004). At odds with the previously known transient LMXBs, these systems appeared to be characterized by no persistent emission before and after the occurrence of a type-I X-ray burst (Cornelisse et al. 2002a). The upper-limits inferred for their persistent emission were significantly lower than the persistent emission of the bright transients (1035−36 erg/s) but not very tight due to the modest sensitivity of the BeppoSAX -WFCs. For this reason, they were collectively termed “burst-only sources”. Only in a few cases, a few ks-long Chandra observations carried out after the discovery of a type-I X-ray burst from some of these sources, were able to reveal the presence of a weak persistent emission at a position consistent with that of the X-ray burst. Typical (quiescent) luminosities derived from these detections were ~1032−1033 erg/s (Cornelisse et al. 2002b).
Owing to their peculiar behavior and the discovery of several new members of this class (see e.g., Chelovekov & Grebenev 2007; Degenaar & Wijnands 2009), the burst-only sources have attracted increasing interest in the past few years (see also Del Santo et al. 2010). Systems undergoing type-I X-ray bursts when subject to very low accretion rates allow us to test models of thermonuclear burning in a regime that is still poorly explored (see e.g., Cooper & Narayan 2007; Peng et al. 2007). Moreover, the low persistent luminosity in quiescence and the spectral properties during the outbursts led to the suggestion that the burst-only sources could be linked to very faint transients and accreting millisecond X-ray pulsars (AMSPs, Wijnands et al. 2006; Campana 2009; Trap et al. 2009).
In this paper, we report on the recent discovery of an intense X-ray activity from the burst-only source Swift J1749.4−2807. We studied the timing and spectral properties of the source during this event by exploiting all the available Swift, INTEGRAL, and RXTE data, and report on the detection of millisecond pulsations in the X-ray emission of this source. The results presented here provide a strong support in favor of the association between burst-only sources and AMSPs. In Sect. 1.1, we describe previous observations of Swift J1749.4−2807, and in Sect. 2 our data analysis and results. Our discussion and conclusions are presented in Sect. 3.
1.1. SWIFT J1749.4−2807
Observation log of Swift J1749.4−2807.
Swift J1749.4−2807 was discovered in 2006 during a bright type-I X-ray burst that was initially recorded as a potential gamma ray burst (GRB060602B, Wijnands 2009). Swift /XRT started to follow-up the evolution of the source from 83 s after the BAT trigger, and monitored the source outburst for the following 8 d. The source X-ray flux decayed in an approximately power-law fashion (with index ~− 1), fading below the detection threshold of Swift /XRT in less than 106 s. The BAT spectrum extracted at the peak of the type-I X-ray burst could be described by a black-body (BB) model ( keV) and provided an upper limit to the source distance of 6.7 ± 1.3 kpc (by assuming that the peak X-ray luminosity of the burst corresponded to the Eddington value, uncertainties at 90% c.l.; Wijnands 2009). During the outburst, the XRT spectrum could be described well by an absorbed power-law model. The measured column density was consistent with being constant throughout the event at a value NH = 4 × 1022 cm-2, while the photon index was observed to decrease from
  to 0.5 ± 1.3 (Campana 2009). The estimated X-ray luminosity was ~1036 erg/s at the peak ot the outburst and ~1032 erg/s in the latest Swift observation available.
Wijnands (2009) also reported on three serendipitous detections of Swift J1749.4−2807 in archival XMM-Newton observations. The first observation was carried out on 2000 September 23, and the second two were performed on 2006 September 22 and 26. The count-rate of the source in the three XMM-Newton observations was too low to extract any meaningful spectral information. By assuming an absorbed power-law model with Γ = 2 and NH = 3 × 1022 cm-2, Wijnands (2009) estimated a 2−10 keV unabsorbed flux of ~(1−2) × 10-13 erg/cm2/s. This corresponds to a luminosity of (3−6) × 1032 erg/s (assuming a distance to the source of 7 kpc) and is compatible, to within the errors, with that measured about 6 days after the outburst discovered with Swift.
Swift J1749.4−2807 was detected again in a high X-ray luminosity state on 2010 April 10, during the INTEGRAL Galactic bulge monitoring program (Pavan et al. 2010; Kuulkers et al. 2007). Swift and RXTE target of opportunity observations (ToO) were immediately requested, and these monitored the source outburst for about two weeks. RXTE observations detected coherent pulsations in the X-ray emission of the source at 518 Hz and its second harmonic (Altamirano et al. 2010a; Bozzo et al. 2010). From these data, a preliminary orbital solution was first obtained by Belloni et al. (2010), and then refined by Strohmayer et al. (2010) by using a pulse phase-coherent technique. The latter authors derived an orbital period of 31 740.345 ± 0.04 s (8.8168 h), a projected semi-major axis of asin(i) = 1899.53 ± 0.01 lt-ms, and a barycentric frequency for the second harmonic (i.e., twice the spin frequency) of 1035.840025 Hz ± 0.4 μHz. The time of the ascending node was 2 455 301.1522672 ± 0.0000014 JD (TDB). This solution implied a mass function of 0.05463 ± 0.00018 M⊙ and a minimum mass for the companion of 0.475 M⊙ (assuming a NS of 1.4 M⊙). The discovery of an X-ray eclipse in the RXTE light curve was reported by Markwardt et al. (2010a); this is the first eclipse observed from an accreting millisecond X-ray pulsar. The most accurate source position to date was provided by Yang et al. (2010) at  and
and  9, with a 90% confinement radius of 1.9
 , based on Swift /XRT observations.
2. Data analysis and results
2.1. INTEGRAL data
INTEGRAL data were analyzed using the OSA software (v.9) released by the ISDC (Courvoisier et al. 2003). We considered data from both IBIS/ISGRI (Lebrun et al. 2003) and JEM-X2 (Lund et al. 2003) in the 20−40 keV and 3–23 keV energy ranges, respectively. The average fluxes and spectra for JEM-X2 were extracted from the mosaic images, as recommended in the case of weak sources1. The ISGRI spectrum was extracted using standard procedures. The detail of the INTEGRAL observations is given in Table 1. The source was not detected during the observations carried out on 2010 April 7 and 21−22. Swift J1749.4−2807 was clearly detected (8σ) during the two observations carried out from 2010 April 10 to 13. The simultaneous ISGRI+JEM-X2 spectra could be reasonably well described by a cutoff power-law model of photon index 1.3−1.6 (we fixed the cutoff energy at 20 keV and the absorption column density at 3 × 1022 cm-2, see below); the estimated flux was 3 × 10⁻¹⁰ erg/s/cm2 (3-20 keV). For these observations, we also extracted an event list from the entire JEM-X2 detector in the 3−20 keV band to search for type-I X-ray bursts. Only one burst was detected: the increase in the source flux at the time of the burst is also confirmed by the higher significance of the source detection in the JEM-X2 image extracted during the duration of the burst (see also Chenevez et al. 2010). Our analysis of the burst parameters is described below. A search for type-I X-ray bursts was also performed in the ISGRI data (we used a list of events selected in the 18-40 keV energy band and with a pixel illumination fraction threshold >0.75). No statistically significant bursts were detected in these data.
2.1.1. The type-I X-ray burst
In the INTEGRAL observation carried out on 2010 April 13, a type-I X-ray burst was detected by JEM-X2. The light curve of the burst in the 3−20 keV band and with a time resolution of 2 s is shown in Fig. 1. The rise time of the burst was ~1 s, and the start time2 was 2010 April 13 at 16:51:18 (UTC at the satellite location; these values were determined by using the JEM-X2 source event list rebinned to have a time resolution of 0.5 s). The relevant burst parameters are reported in Table 2. Owing to the relatively low signal-to-noise ratio (S/N), a time-resolved spectral analysis of the burst could not be carried out, thus no signature of a possible photospheric radius expansion (PRE; see e.g., Lewin et al. 1993) could be identified. We determined the flux at the peak of the burst by fitting the spectrum of the initial 4 s with a BB model (the NH was fixed at 3 × 1022 cm-2, see Table 1). The persistent spectrum extracted from a time interval close to the burst was used as a background in the fit. The best-fit BB temperature and radius at the peak were  keV and
  km, respectively (for a source distance of 7 kpc) with a
  . In Table 2, we report the decay time, τlc, of the burst as measured by fitting the observed light curve with an exponential function; this is to be compared with τ, the burst duration that is obtained by dividing the burst fluence by the peak flux (see e.g. Lewin et al. 1993). We note that the two values are in agreement to within the errors. Additional comments on the type-I X-ray burst are given in Sect. 3.
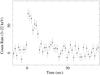 |
Fig. 1 The type-I X-ray burst detected by INTEGRAL/JEM-X2 from Swift J1749.4−2807. The JEM-X (3−20 keV) net light curve is shown (background subtracted). The time bin is 2 s and the start time of the burst is 2010 April 13 at 16:51:18 (UTC at satellite location). |
The type-I X-ray burst parameters.
2.2. RXTE data
RXTE /PCA (Jahoda et al. 1996) data analysis and spectral extraction were carried out with the standard tools available in heasoft (V 6.7). Since the source was relatively faint for the instruments on-board RXTE and is located in the Galactic bulge, we paid particular attention to estimate the background as accurately as possible. For this purpose, we excluded from the spectral analysis, performed using the standard2 mode, the data from the PCU0 detector, because the propane veto layer stopped working in May 2000, leading to significantly worse instrumental noise subtraction. Moreover, we considered only data from the upper anode layer to reduce the systematic error in the instrumental noise.
The large contribution from the Galactic diffuse emission to the RXTE/PCA X-ray fluxes, poses a serious problem for data processing. We used the latest observations, performed after 2010 April 20 to estimate the background for the utilized PCU configurations (Table 1). After 2010 April 20, the source flux measured by Swift /XRT (see Table 1) decreased to below 10-11 erg/cm2/s, indicating that the count-rate in the last two RXTE observations was dominated by the Galactic ridge emission (Valinia et al. 1998). We did not use the HEXTE data, since both units stopped rocking on 2009 December 14 and the background estimation cannot be performed satisfactorily with the available software at the time of writing (the application of the method used for PCA does not give reliable results because of the instrumental variable background induced by high energy particles).
A log of the RXTE observations and a summary of the results of the analysis of these data is provided in Table 1. Here, all the spectra were fit within xspec in the 3−23 keV energy range with an absorbed power-law model, which always provided satisfactory fits. We checked that the relatively large values of the χ2 were due to residuals in the background subtraction and not to the presence of additional spectral components.
For the timing analysis, we used the RXTE event data (mode E_125us_64M_0_1s) with 64 energy channels and 122 μs time resolution. To maximize the S/N, we selected the events in all the active PCUs and layers. The barycenter correction was applied using the tool faxbary and the most precise available source position to date (see Sect. 1.1). Pulsations at the spin frequency of the NS and its second harmonic were clearly detected in all the observations by using the Z2-statistics (Buccheri et al. 1983; Markwardt et al. 2002), in agreement with the results reported by Altamirano et al. (2010a) and Bozzo et al. (2010). An orbital solution for Swift J1749.4−2807 was obtained from the timing analysis based on the frequency modulation of the signal (see Fig. 2 and Table 3). It gave results consistent with those reported by Strohmayer et al. (2010), though with larger uncertainties, since they derived a phase-coherent solution. In the following we use their value for the orbital period, projected semi-major axis, barycentric pulse frequency, and epoch of the ascending node.
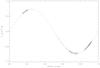 |
Fig. 2 Measurements of the spin period of Swift J1749.4−2807 in the RXTE data. The spin period is computed in each case by using a time window with a duration of between 200 s and 1000 s (depending on the source intensity) and fitting with a Gaussian function the peak in the Z2-statistics corresponding to the first overtone of the pulse. From these measurements, we derived the orbital parameters reported in Table 3. The corresponding orbital solution is represented in this figure with a dotted line. |
Parameters of the orbital solution of Swift J1749.4−2807, as derived from the RXTE observations (errors are given at 1σ c.l. on the last digit).
To study the variations in the amplitude of the fundamental and second harmonic throughout the RXTE monitoring (Bozzo et al. 2010), we used the value of the source spin period reported by Strohmayer et al. (2010) and folded the light curves into time intervals of 100 s to produce in each interval a pulse profile, Pt(φ), in 32 phase bins. We rebinned these pulses adaptively by choosing appropriate time intervals of durations tstop − tstart that permitted us to obtain a S/N ≳ 50 (we were careful not to combine observations separated by more than ~1 day). The characteristic amplitude of the first two Fourier components in each rebinned pulse profile was then computed using the equation 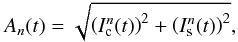 (1)where n = 1,2 is the Fourier order
 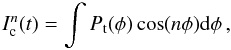 (2)
(2)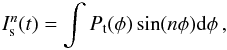 (3)and t = tstart + (tstop − tstart)/2. This method has the advantage that the statistical uncertainties in An(t) can be straightforwardly computed by propagating the errors from the pulse profiles.
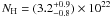
From Fig. 3, we note that during the observation 95085-09-01-01 (~105 s after the first RXTE observation) the power of the second harmonic became higher than that of the fundamental, in agreement with the results reported by Bozzo et al. (2010). The relative power of the two components, A1/A2, varies with time: the second harmonic was clearly dominant during the early stage, before 2010 April 18 (i.e. t < 3 × 10⁵ s in Fig. 4), while the fundamental became more prominent in the later stages (t > 3 × 10⁵ s in Fig. 4).
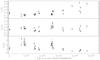 |
Fig. 3 Fourier analysis of the pulsed signal throughout the RXTE monitoring of Swift J1749.4−2807: A0,1,2 are the powers of the first three Fourier coefficients. The pulse profiles have been rebinned to obtain a S/N at least 50 and only detections at more than 3σ of A1,2 are reported. |
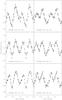 |
Fig. 4 Pulse profiles of Swift J1749.4−2807 in the RXTE observations (the observation ID. is indicated in each panel) normalized for the corresponding average count-rate and folded with respect to the same reference time (53 888.9854166670 MJD). The energy band is 3–23 keV (data from PCU2). In the observation 95085-09-02-02, the eclipse was excluded. The solid line in each figure is obtained by truncating the Fourier series expansion of the pulses profiles to the first three terms. |
The dependence of the fractional rms (Eq. (2.10) in van der Klis 1988) on energy is shown in Fig. 5. In this case, we used the pulse profiles with 32 phase bins obtained by summing up all the RXTE observations prior to 2010 April 17 (total exposure time ~17 ks). The fractional rms slightly increases with energy, as in the results reported for other AMSPs (see e.g., Gierlinski & Poutanen 2005; Patruno et al. 2009).
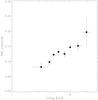 |
Fig. 5 Fractional rms as a function of the energy derived from the average pulse profiles of the RXTE observations (see text for further details). |
To search for X-ray eclipses (Markwardt et al. 2010a), we extracted the source light curves of each PCU unit with a time resolution of 1 s. These light curves were subtracted for instrumental background (we used the background model available for faint sources) and scaled to the effective area of the full PCA array3. The contribution from the diffuse Galactic emission was subtracted by using the data collected in the observations 95085-09-02-08 and 95085-09-02-10 (see above).
These light curves were then barycentered and folded by using the orbital solution reported by Strohmayer et al. (2010). We found that an eclipse ingress was visible during observation 95085-09-02-11, whereas the eclipse egress was clearly present in observations 95085-09-02-02 and 95085-09-02-04. No other orbital feature was detected. To determine the parameters of the eclipse, we separately fit the light curves extracted from the three observations with the rectangular step function (see e.g., Mangano et al. 2004): ![\begin{equation} \frac{A}{\pi} \left[ \tan^{-1} \right. \left( B \left( 0.5 - C - \phi \right) \right) +\left. \tan^{-1} \left( B \left( \phi -0.5 - C\right) \right)\right] +D , \end{equation}](/articles/aa/full_html/2011/01/aa15033-10/aa15033-10-eq143.png) (4)where φ is the orbital phase, A, B, and D are constants to be determined from the fit, and C is the semi-amplitude of the eclipse in phase units. For large values of B this expression mimics the shape of the light curve of an eclipse with sharp ingress and egress, similar to the one we have in our case (the obscuration of a NS of 10 km moving in a ~9 h wide orbit around a solar-type star is expected to occur in Δt ~ 10-6 s). We found that C = (3.450 ± 0.005) × 10-2, (3.41 ± 0.03) × 10-2 for the two egresses, and C = (3.56 ± 0.13) × 10-2 for the ingress (uncertainties are 1σ c.l.). The corresponding durations of the eclipses are 2190 ± 4 s, 2163 ± 17 s and 2260 ± 80 s, which are all compatible with each other within the errors. The duration of the egress is constrained by the first observation to be shorter than 2 s.
(4)where φ is the orbital phase, A, B, and D are constants to be determined from the fit, and C is the semi-amplitude of the eclipse in phase units. For large values of B this expression mimics the shape of the light curve of an eclipse with sharp ingress and egress, similar to the one we have in our case (the obscuration of a NS of 10 km moving in a ~9 h wide orbit around a solar-type star is expected to occur in Δt ~ 10-6 s). We found that C = (3.450 ± 0.005) × 10-2, (3.41 ± 0.03) × 10-2 for the two egresses, and C = (3.56 ± 0.13) × 10-2 for the ingress (uncertainties are 1σ c.l.). The corresponding durations of the eclipses are 2190 ± 4 s, 2163 ± 17 s and 2260 ± 80 s, which are all compatible with each other within the errors. The duration of the egress is constrained by the first observation to be shorter than 2 s.
The RXTE light curve of Swift J1749.4−2807, folded at the orbital period, is shown in Fig. 6, where we have zoomed around the eclipse. From this figure, we notice that the ingress in the eclipse appeared to be less rapid than the egress, and a residual X-ray flux seemed to be present during the eclipse. We investigated a possible energy dependence of the eclipse ingress profile by extracting source light curves in the 3−5 keV and 6−10 keV energy band and calculating the hardness ratio of these light curves4. No evidence of a change in the hardness ratio was found. After taking into account the uncertainties in the removal of the background from the RXTE observations, it is not clear whether the residual X-ray flux visible during the eclipse in Fig. 6 is due to real emission from the source. The RXTE spectrum during the eclipse infers a flux in the 3−20 keV energy band of (1.3 ± 1.1) × 10-11 erg/cm2/s (the power-law photon index was 2.0 ). To investigate the origin of this X-ray emission, we first searched for pulsations in the X-ray emission of Swift J1749.4−2807 during the eclipse. We folded the data from the eclipse in observation ID. 95085-09-02-02, which ended at MJD 55 302.96097 TBD, (effective exposure time 530 s) at the NS spin frequency in 16 phase bins. This profile did not show any statistically significant modulation. To verify this apparent lack of pulsations, we also estimated the power of the pulsed emission during the eclipse. We used as a template the pulse profile in the observation 95085-02-02 excluding the eclipse (energy band 3−20 keV, fractional rms (7.3 ± 0.6)%), and computed its cross-correlation coefficient5 with respect to the pulse during the eclipse (exposure 530 s) and during the 530 s following the eclipse. We measured respectively cross-correlation coefficients of −0.16 ± 0.24 and 0.72 ± 0.12.
Given the systematic uncertainties in the background subtraction, providing a clear explanation of the residual emission during the eclipse (if any) with RXTE can be challenging. Much more detailed information can be obtained from the Swift observations, thus we discuss the origin of the residual emission during the eclipse in Sects. 2.3 and 2.4.
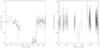 |
Fig. 6 Left: RXTE orbital folded light curve of Swift J1749.4−2807. Diamonds refer to the observation 95085-09-02-04, triangles to 95085-09-02-11, and the other points to the observation 95085-09-02-02. The light curves are normalized to the average values outside the eclipse and rebinned to obtain a S/N ≃ 8 in each time bin. Right: Swift /XRT folded light curve of Swift J1749.4−2807 (0.3−10 keV). The eclipse occurred during the observation ID. 00031686002. In both panels, the solid line is the shape of the eclipse determined from the RXTE observation 95085-09-02-02. |
2.3. Swift data
We analyzed the Swift /XRT (Gehrels et al. 2004) data collected in both photon counting mode (PC) and window timing mode (WT) using standard procedures (Burrows et al. 2005) and the latest calibration files available. Filtering and screening criteria were applied by using ftools. The barycentric correction was applied to the times of all the event files using the online tool barycorr. We extracted source and background light curves and spectra by selecting event grades of 0−2 and 0−12, respectively, for the WT and PC mode. Exposure maps were created through the xrtexpomap task, and we used the latest spectral redistribution matrices in the heasarc calibration database (v.011). Ancillary response files, accounting for different extraction regions, vignetting, and point spread function (PSF) corrections, were generated by using the xrtmkarf task. We corrected the PC data (where required) for pile-up. A log of the Swift observations is given in Table 1. For each observation in the table, we extracted the spectrum and derived the X-ray flux by fitting an absorbed power-law model. Spectra with sufficiently high count rate were rebinned to collect at least 20 photons per bin, to permit minimum χ2 fitting. The spectra extracted in observations with ID. 00031686002 (WT mode) and 00031686006 were characterized by very low count rate; we therefore rebinned these spectra to have at least 5 photons per bin and then fit them by using the C-statistics (Cash 1979). During observation ID. 00031686007, the source was clearly detected in the Swift /XRT image but the exposure was too low to extract a meaningful spectrum. Therefore, we estimated the source count rate of the observation with the sosta program (available within the ftool ximage), and used the resulting count rate within webpimms to derive the X-ray flux (we assumed the same spectral model of the observation ID. 00031686005; see also Bozzo et al. 2009). A similar technique was adopted to estimate a 3σ upper limit to the source X-ray flux during observations ID. 00031686008,9,10, when Swift J1749.4−2807 was not detected. The results from this analysis are reported in Table 1.
The Swift/XRT light curves were folded at the orbital period of the source (see Sect. 2.2) to search for X-ray eclipses. An eclipse occurred during observation ID. 00031686002. A zoom of the light curve of this observation around the eclipse is shown in Fig. 6. This shows a residual X-ray flux during the eclipse (see Sect. 2.4).
We also reanalyzed all the observations carried out with Swift/XRT during the 2006 outburst to search for X-ray eclipses. By using the orbital solution discussed in Sect. 2.2, we noticed that some of these observations were performed when the source was in eclipse. However, the source count rate was far too low to extract a meaningful light curve and spectrum.
2.4. A scattering halo in the direction of Swift J1749.4−2807
To clarify the origin of the residual X-ray emission of Swift J1749.4−2807 during the eclipse, we show in Fig. 7 four images of the source extracted during the Swift observation ID. 00031686002. The two images at the top were accumulated during the time interval in which the X-ray source was eclipsed (total exposure time 840 s) and are in the 0.3−5.0 keV and 5−10 keV energy bands. The source is clearly detected in the lower energy image. The other two images were extracted in the same observation and energy bands, but during the 840 s preceding the eclipse. These figures suggest that the source was not point-like, but slightly extended (by a few arcminutes), especially at lower energies. To support this finding, we compared the radial distribution of photons during the eclipse with the PSF from the calibrations of Swift/XRT (using the tool ximage). We report the results in Fig. 8. The PSF during the eclipse was much flatter than expected for a point source.
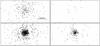 |
Fig. 7 Upper panels: Swift /XRT image of Swift J1749.4−2807 extracted during the eclipse in the observation ID. 00031686002 (exposure time 840 s, see Fig. 6). The left (right) panel shows the image of the source in the 0.3−5 keV (5−10 keV) energy band. The black line corresponds to a distance of 1 arcmin in the images. A source is detected at low energies, but not at high energies. Lower panels: the same as for the upper panel, but the images were extracted during the same observation outside the eclipse (exposure time 840 s). From this image, it is clear that the in-eclipse PSF looks more extended than the point-like PSF observed out of eclipse. |
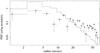 |
Fig. 8 Radial distribution of photons extracted from the image of Swift J1749.4−2807 during the eclipse (0.3−5 keV energy band). The distribution is much flatter than the PSF of a point-like source in Swift /XRT (solid line). |
 cm-2, and Γ = 3.6 ± 0.6 (C-statistic/d.o.f. = 38.4/44, exposure time 840 s). The average 0.5−10 keV flux in the eclipse was (1.6
 erg/cm2/s, with a contribution from the photons in the 5−10 keV energy band lower than 20%. This is compatible (to within the errors) with the flux estimated during the eclipse by using RXTE (see Sect. 2.2).
For comparison, the spectrum of the source extracted outside the eclipse is described well by an absorbed power-law model with NH = (3.0 ± 0.4) × 1022 cm-2, and Γ = 2.3 ± 0.2 ( /d.o.f. = 0.99/85, exposure time 2.6 ks). The X-ray flux in this case was (2.6 ± 0.3) × 10-10 erg/cm2/s, with the photons from the hard energy band (5−10 keV) contributing for more than 45%. In Fig. 9, we also report the light curves of Swift J1749.4−2807 in the observation ID. 00031686002 in two energy bands. The hardness ratio, defined as the ratio of the Swift /XRT count rate in the hard (5−10 keV) to soft (0.3−5 keV) bands versus time, is also shown. Its average value was 0.16 ± 0.02 outside the eclipse and 0.04 ± 0.03 inside the eclipse. We conclude that the spectrum during the eclipse was much softer that that outside the eclipse, and compatible with the softening by a factor of E-2 expected in case the extended emission is due to a scattering halo (see e.g., Day & Tennant 1991, and references therein).
We note that, for a halo size Θ of a few arcmin radius (see Fig. 7) and an estimated source distance of ~7 kpc (see Sect. 1.1), the longer path followed by scattered photons translates into a delay (Thompson & Rothschild 2008)  (5)where x is the fractional distance of the halo from the source along the line of sight, d7 kpc kpc is the source distance in units of 7 kpc, and we have used Θ = 1 arcmin and x = 1/2, as indicative values. The typical delay is thus of few hours, i.e., much longer than the duration of the X-ray eclipse (~2600 s).
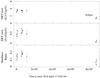 |
Fig. 9 Swift /XRT light curves of observation ID. 00031686002 in the 0.3−5 keV and 5−10 keV energy bands. The lower panel shows the corresponding hardness ratio. The rates measured during the eclipse are indicated. |
days (/d.o.f. = 15.2/4). Even though the is not formally acceptable, we checked that this is due to the relatively large scatter in the Swift points during the steep decay.
In the right panel of Fig. 10, we also report for comparison the outburst occurred in 2006, observed by Swift /XRT. To compare the flux evolution between the two outbursts more reliably, we plot in this panel also the Swift /XRT observations of the outburst in 2010. In both cases, the times of the observations were scaled to the time of the type-I X-ray burst that was detected during each outburst. From this figure it is apparent that the outburst in 2010 lasted much longer than the one in 2006 (a factor of ~2), and was characterized by a higher averaged X-ray luminosity (the decrease in the X-ray flux with time was, on average, much slower; see also Sect. 3). In both cases, the decrease of the source X-ray flux throughout the outburst was not smooth. A relatively large scatter between the fluxes measured from different Swift observations, similar to that reported above for the outburst in 2010, is clearly visible also during the outburst in 2006. Wijnands (2009) suggested that this scatter might be caused by some flares occurring during the decay from the outburst.
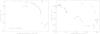 |
Fig. 10 Left: long-term light curve of the outburst of Swift J1749.4−2807 in 2010. Stars, triangles and diamonds represent respectively Swift, INTEGRAL, and RXTE observations. The downward arrows indicate the upper limits to the source X-ray flux. All the fluxes are in the 3−20 keV energy band and have not been corrected for absorption. We converted Swift /XRT fluxes from the 0.5−10 keV energy band to the energy band 3−20 keV by using the spectral model of each observation and the online tool webpimms (http://heasarc.nasa.gov/Tools/w3pimms.html). The errors on the fluxes are given at 90% c.l. The large upward arrow indicates the time of the type I X-ray burst. Right: the outburst of Swift J1749.4−2807 occurred in 2006 as observed by Swift /XRT (red stars). Here the fluxes are in the 0.3−10 keV energy band. For comparison, we report in this panel the Swift /XRT observations in the same energy range carried out during the outburst in 2010 (in black diamonds). The times of the observations in 2006 and 2010 have been scaled to the rise time of the corresponding type-I X-ray burst detected during each event. |
3. Discussion and conclusions
We have reported on the monitoring of the burst-only source Swift J1749.4−2807, which was discovered to undergo a new X-ray outburst by INTEGRAL on 2010 April 10.
3.1. The outburst decay
The peak outburst luminosity (see Fig. 10) was ~1.8 × 1036 erg/s (assuming a distance of 7 kpc), only slightly higher than that reported for the outburst that occurred in 2006 (~1036 erg/s). Despite this similarity in peak X-ray luminosity, the evolution in the source X-ray flux during the two events was significantly different. The 2006 outburst displayed a clear power-law-like decay (index ~− 1, Wijnands 2009), and lasted less than ~6 days (see also Sect. 1.1). In contrast, the 2010 outburst lasted more that 11 days7 and was characterized by an exponential decay (see Sect. 2).
Disk instability models for the outbursts of transient NS LMXBs predict that both linearly and exponentially decaying outbursts can be produced (King 1998). King & Ritter (1998) showed that, when the irradiation of the accretion disk from the X-ray emission of the NS is strong enough (i.e., the peak X-ray luminosity at the onset of the outburst is high), the disk is completely ionized out to its outer edge and the light curve of the outburst follows an exponential decay. In this phase, most of the disc mass can be accreted onto the NS in a viscous timescale. A change in the profile of the outburst is expected once the source has faded below a certain luminosity level. Below this threshold, only part of the accretion disk can be ionized. As a consequence, both the mass accretion rate onto the NS and the outer boundary of the ionized region in the disk begin to decrease with time, leading to a linear (rather than exponential) decay (King 1998; Shahbaz et al. 1998; Powell et al. 2007).
The value of the critical X-ray luminosity at which these changes occur depends on the properties of the system (total mass and orbital period). In the case of Swift J1749.4−2807 , this luminosity is expected to be on the order of 1036 erg/s (Shahbaz et al. 1998), thus comparable to the peak X-ray luminosity estimated during both the events in 2006 and 2010. As the event in 2010 was characterized by an X-ray luminosity slightly higher than that measured at the peak of the outburst in 2006, it is possible that this relatively small difference was sufficient to cause a different behavior during the outburst decay. We note that, even though the peak luminosity of the two outbursts was almost comparable, during the outburst that occurred in 2010 the source remained in a high X-ray luminosity state for a significantly longer time interval than in 2006. This might have caused the ionization of a larger portion of the accretion disk and thus led to an exponential outburst decay. Given the relatively poor number of Swift and RXTE observations during the end of the outburst in 2010, it is not possible to investigate more deeply whether a switch between exponential and linear decay occurred at some point during the steep decay of the 2010 outburst.
The discovery of millisecond pulsations in the X-ray emission of Swift J1749.4−2807 secured the previously suggested association of this source (and other burst-only sources in general) with the class of the accreting AMSPs. This permits a comparison between the two classes. In particular, AMSPs are known to undergo week-to-month-long outbursts that usually exhibit an initial exponential decay, followed by a linear one, in agreement with the prediction of the disk instability model discussed above. An in-depth study of the outburst decay of a number of AMSPs was carried out by Powell et al. (2007). These authors showed that most of these sources display a “knee” in their decay, when the X-ray luminosity falls below the threshold at which the switch between exponential to linear decay is predicted.
This behavior was observed in the AMSPs SAX J1808.4−3658, XTE J1751−305, and XTE J0929−314. Some anomalies in the outburst decay were reported for the AMSPs SAX J1808.4−3658, XTE J1807−294, and IGR J1751−305. During an outburst in 2000, SAX J1808.4−3658 displayed several unexpected “re-flares” about ~20 days after the initial exponential+linear decay (Wijnands et al. 2006; Campana et al. 2008), whereas the source XTE J1807−294 underwent in 2003 a rather long (≳ 100 day) pure exponential outburst without any clear evidence of a linear phase (see e.g., Falanga et al. 2005; Powell et al. 2007, and references therein). Another AMSP, IGR J1751−305, displayed a few outbursts lasting exceptionally only a few days and reaching a relatively low X-ray luminosity (a few mCrab, see e.g., Falanga et al. 2007; Markwardt et al. 2007). The outbursts observed from Swift J1749.4−2807 in 2006 and 2010 were both significantly shorter than those observed from the other AMSPs, and only the anomalous outbursts detected from IGR J1751−305 resemble those of Swift J1749.4−2807.
Similar dim outbursts have been observed from the very faint X-ray transients (VFXTs, see Sect. 1), and an association between these sources and the burst-only sources was suggested by Campana (2009). Different ways of interpreting the behavior of the VFXTs were reported by King & Wijnands (2006). These authors showed that the VFXTs hosting NS primaries can be relatively well understood if the material accreted on these systems originates from brown dwarfs or planetary companions. However, in the case of Swift J1749.4−2807 such low-mass companion is ruled out by the mass function of the system, which implies a minimum companion mass of ~0.5 M⊙ assuming a NS of 1 M⊙.
3.2. Timing features
In the case of Swift J1749.4−2807, an in-depth study of the properties of the primary and secondary stars is possible for the first time by using the orbital solution and characteristics of the X-ray eclipses. At present, Swift J1749.4−2807 is the only eclipsing AMSPs. An extensive discussion of these issues is beyond the scope of the present work, and will be reported in a separate paper (Campana et al. 2010, in preparation).
In Sect. 2.4, we carried out a careful analysis of the residual X-ray emission of Swift J1749.4−2807 during the eclipse. While our analysis of the RXTE data could not unambiguously identify the origin of this emission, we found in the Swift data strong evidence that residual emission during the eclipse is caused by a scattering halo in the direction of the source. The effect of a dust scattering halo is most prominent when a source is in eclipse and at lower energies (≲3 keV, see Sect. 2.4). Since Swift J1749.4−2807 is the first eclipsing AMSP, it is also the first source in this class for which this effect could be detected.
An additional peculiarity of Swift J1749.4−2807 was revealed by the Fourier analysis of the RXTE data, which showed a signal at the spin frequency of the NS and its second harmonic. This is consistent with the fact that the pulse profiles clearly displayed a double peak (see Fig. 4). This feature has never been observed in another AMSP and is most likely due to emission from both accreting polar caps that sweeps across our line of sight. This geometry is possible because the system is seen nearly edge-on (as confirmed by the detection of X-ray eclipses). Moreover, the study of the pulse profile in different RXTE observations has found that the shape and amplitude of the two peaks changed significantly during the outburst decay. We propose that this behavior is caused by changes in the geometry of the emitting region close to the NS surface and/or changes in the radius and/or thickness of the inner edge of the accretion disk.
3.3. Type I X-ray burst
Our analysis of the data presented here has also detected a type-I X-ray burst in the JEM-X2 light curve. This is the second type-I X-ray burst reported so far from Swift J1749.4−2807. The first burst was discovered with Swift /BAT (Wijnands 2009) and was characterized by a peak flux a factor of ~2 higher than that measured by JEM-X2 (see also Sect. 1.1). The statistics of the JEM-X2 were of too low quality to perform a time-resolved spectral analysis of the burst, and no evidence of a photospheric radius expansion could be found (see Sect. 2). The observation of a type-I X-ray burst can be used to derive an upper limit to the source distance by assuming that the peak X-ray luminosity of the burst corresponded to the Eddington value LEdd ≈ 3.8 × 1038 erg/s (as empirically derived by Kuulkers et al. 2003, for a helium burst). However, since the peak flux of the JEM-X2 burst was significantly lower than that observed previously by Swift, the latter already provided the most restrictive upper limit8 of 7 kpc on the distance to Swift J1749.4−2807 (see Sect. 1). Using this distance, the persistent unabsorbed 0.1−100 keV flux of the source at the time of the JEM-X2 burst would translate into a bolometric luminosity of Lpers ≈ 4.7 × 1036 erg/s, or 1.2% LEdd. This corresponds to a local accretion rate per unit area of ṁ ≈ 3.2 × 10³ g/s/cm2 ≃ 1.2%ṁEdd, where we have used the relation Lpers = 4πR2ṁ(GM/R)/(1 + z) (with z = 0.31 the NS gravitational redshift; see e.g., Lewin et al. 1993).
Theoretical models predict that, when 0.01 < ṁ/ , H burns stably through the hot CNO cycle and a layer composed of pure He develops underneath the NS surface. This layer can then ignite by means of the 3α process and lead to a pure He burst, with a typical rise time of ~1 s and a duration of ~10 s. These quantities, estimated for the burst detected by JEM-X2 (see Sect. 2), are fully compatible with those expected for a pure He burst.
We note that pure He runaways were also reported for the other burst-only source GRS 1741.9−2853 (Trap et al. 2009). The detection of this kind of type-I X-ray bursts from the burst-only sources is particularly intriguing because it would argue against the idea that these sources are the prototypes of the (poorly observed) H-burning bursts with low accretion rates (see Sect. 1 and, e.g. Peng et al. 2007).
Finally, we can check the consistency of the results derived above for the type-I X-ray burst by evaluating the theoretically expected recurrence time of the burst. We first estimate the ignition depth of the burst, yign, using the equation Eburst = 4πR2yignQnuc/(1 + z), where Eburst = 4πd2fb = 2.0 × 1039 erg (d/7 kpc), fb is the measured fluence of the burst (see Table 2), and Qnuc ≈ 1.6 MeV corresponds to the nuclear energy release per nucleon for complete burning of helium to iron group elements (Wallace & Woosley 1981; Fujimoto et al. 1987). We obtained yign = 1.4 × 10⁸ g cm-2. For the above values of the local accretion rates and ignition depth, the expected recurrence time of a He bursts is about Δt = (yign/ṁ)(1 + z) ≃ 0.6 days (independent of the assumed distance). The burst detected by JEM-X2 occurred ~6.8 d after the first available INTEGRAL observation (see Fig. 10). However, the total effective exposure time on the source was ~0.9 days, thus compatible with the observation of a single type-I X-ray burst throughout the observational period.
At the time of writing this work, two other papers were submitted describing the same source: Markwardt et al. (2010b) and Altamirano et al. (2010b). These authors focused mostly on the timing analysis of the system and discussed in detail the dynamical constraints on the binary system that could be derived by using the eclipses detected in the RXTE data. In our paper, we have concentrated more on the study and interpretation of the evolution of the timing and spectral properties of the source during the outburst. We checked (where possible) that the results derived in our paper are fully compatible with those reported in the other two papers. We have also discussed for the first time the properties of the eclipse found in the Swift data, and provided an interpretation of the residual flux during the eclipse.
We note that a study of the PSF outside the eclipse in the observation ID. 00031686002 would also reveal a deviation with respect to the theoretically expected profile. However, in this case, this is due to the effect of the pile-up (see Sect. 2.3).
Note that we were unable to determine the exact starting point of the outburst, since the first available observation prior to the discovery of the renewed activity is on 2010 April 7 and the relatively short exposure time enables to derive only a poorly constraining upper limit (see Table 1).
Acknowledgments
E.B. and C.F. thank N. Gehrels and the Swift team for their availability and prompt response in carrying out follow-up observations of Swift J1749.4−2807. We thank S. Suchy for support from the HEXTE instrument team and the research groups of IAA-Tübingen and Dr. Remeis-Sternwarte in Bamberg for developing and making available useful scripts to analyze RXTE data. This research has made use of the XRT Data Analysis Software (XRTDAS) developed under the responsibility of the ASI Science Data Center (ASDC), Italy. A.P. acknowledges financial support from the Autonomous Region of Sardinia through a research grant under the program PO Sardegna FSE 2007-2013, L.R. 7/2007 “Promoting scientific research and innovation technology in Sardinia”.
References
- Altamirano, D., Wijnands, R., van der Klis, M., et al. 2010a, Astr. Tel., 2565 [Google Scholar]
- Altamirano, D., Cavecchi, Y., Patruno, A., et al. 2010b [arXiv:1005.3527] [Google Scholar]
- Belloni, T., Stella, L., Bozzo, E., Israel, G., & Campana, S. 2010, Astr. Tel., 2568 [Google Scholar]
- Bildsten, T. 1998, in NATO ASIC Proc, The Many Faces of Neutron Stars, ed. R. Buccheri, J. van Paradijs, & A. Alpar, 515, 419 [Google Scholar]
- Bozzo, E., Giunta, A., Stella, L., et al. 2009, A&A, 502, 21 [NASA ADS] [CrossRef] [EDP Sciences] [Google Scholar]
- Bozzo, E., Belloni, T., Israel, G., & Stella, L. 2010, Astr. Tel., 2567 [Google Scholar]
- Buccheri, R., Bennett, K., Bignami, G. F., et al. 1983, A&A, 128, 245 [NASA ADS] [Google Scholar]
- Burrows, D. N., Hill, J. E., Nousek, J. A., et al. 2005, SSRv, 120, 165 [Google Scholar]
- Campana, S. 2008, ApJ, 684, 99 [Google Scholar]
- Campana, S. 2009, ApJ, 699, 1144 [NASA ADS] [CrossRef] [Google Scholar]
- Campana, S., Colpi, M., Mereghetti, S., Stella, L., & Tavani, M. 1998, A&ARv, 8, 279 [NASA ADS] [CrossRef] [Google Scholar]
- Cash, W. 1979, ApJ, 228, 939 [NASA ADS] [CrossRef] [Google Scholar]
- Chelovekov, I. V., & Grebenev, S. A. 2007, AstL, 33, 807 [Google Scholar]
- Chenevez, J., Brandt, S., Sanchez-Fernandez, C., et al. 2010, Astr. Tel., 2561 [Google Scholar]
- Cocchi, M., Bazzano, A., Natalucci, L., et al. 2001, A&A, 378, 37 [Google Scholar]
- Cooper, R. L., & Narayan, R. 2007, ApJ, 661, 468 [NASA ADS] [CrossRef] [Google Scholar]
- Cornelisse, R., Verbunt, F., in ’t Zand, J. J. M., et al. 2002a, A&A, 392, 885 [NASA ADS] [CrossRef] [EDP Sciences] [Google Scholar]
- Cornelisse, R., Verbunt, F., in ’t Zand, J. J. M., Kuulkers, E., & Heise, J. 2002b, A&A, 392, 931 [NASA ADS] [CrossRef] [EDP Sciences] [Google Scholar]
- Cornelisse, R., in ’t Zand, J. J. M., Kuulkers, E., et al. 2004, NuPhS, 132, 518 [Google Scholar]
- Day, C. S. R., & Tennant, A. F. 1991, MNRAS, 251, 76 [NASA ADS] [Google Scholar]
- Degenaar, N., & Wijnands, R. 2009, A&A, 495, 547 S [NASA ADS] [CrossRef] [EDP Sciences] [Google Scholar]
- Courvoisier, T. J.-L., Walter, R., Beckmann, V., et al. 2003, A&A, 411, 53 [Google Scholar]
- Del Santo, M., Sidoli, L., Romano, P., et al. 2010, MNRAS, 403, L89 [NASA ADS] [Google Scholar]
- Falanga, M., Bonnet-Bidaud, J. M., Poutanen, J., et al. 2005, A&A, 436, 647 [NASA ADS] [CrossRef] [EDP Sciences] [Google Scholar]
- Falanga, M., Soldi, S., Shaw, S., et al. 2007, Astr. Tel., 1046 [Google Scholar]
- Ferrigno, C., Segreto, A., Santangelo, A., et al. 2007, A&A, 462, 995 [NASA ADS] [CrossRef] [EDP Sciences] [Google Scholar]
- Frank, J., King, A., & Raine, D. 2002, Accretion Power in Astrophysics (Cambridge University Press), 110 [Google Scholar]
- Fujimoto, M. Y., Hanawa, T., Miyaji, S., et al. 1981, ApJ, 247, 267 [NASA ADS] [CrossRef] [Google Scholar]
- Fujimoto, M. Y., Sztajno, M., Lewin, W. H. G., & van Paradijs, J. 1987, ApJ, 319, 902 [CrossRef] [Google Scholar]
- Gehrels, N., Chincarini, G., Giommi, P., et al. 2004, ApJ, 611, 1005 [NASA ADS] [CrossRef] [Google Scholar]
- Gierlinski, M., & Poutanen, J. 2005, MNRAS, 359, 1261 [NASA ADS] [CrossRef] [Google Scholar]
- Ghosh, P., & Lamb, F. K. 1979, ApJ, 234, 296 [NASA ADS] [CrossRef] [Google Scholar]
- Heise, J., in ’t Zand, J. J. M., Smith, M. J. S., et al. 1999, Astrophys. Lett. Comm., 38, 297 [NASA ADS] [Google Scholar]
- King, A. R. 1998, MNRAS, 296, 45 [Google Scholar]
- Jahoda, K., Swank, J. H., Giles, A. B., et al. 1996, SPIE, 2808, 59 [Google Scholar]
- King, A. R., & Ritter, H. 1998, MNRAS, 293, 42 [Google Scholar]
- King, A. R., & Wijnands, R. 2006, MNRAS, 366, L31 [NASA ADS] [Google Scholar]
- Kuulkers, E., den Hartog, P. R., in ’t Zand, J. J. M., et al. 2003, A&A, 399, 663 [NASA ADS] [CrossRef] [EDP Sciences] [Google Scholar]
- Kuulkers, E., Shaw, S. E., Paizis, A., et al. 2007, A&A, 466, 595 [NASA ADS] [CrossRef] [EDP Sciences] [Google Scholar]
- Lebrun, F., Leray, J. P., Lavocat, P., et al. 2003, A&A, 411, 141 [Google Scholar]
- Lewin, W. H. G., van Paradijs, J., & Taam, R. E. 1993, SSRv, 62, 223 [NASA ADS] [Google Scholar]
- Liu, Q. Z., van Paradijs, J., van den Heuvel, E. P. J., et al. 2007, A&A, 469, 807 [NASA ADS] [CrossRef] [EDP Sciences] [Google Scholar]
- Lund, N., Budtz-Jørgensen, C., Westergaard, N. J., et al. 2003, A&A, 411, 231 [Google Scholar]
- Mangano, V., Israel, G. L., & Stella, L. 2004, A&A, 419, 1045 [NASA ADS] [CrossRef] [EDP Sciences] [Google Scholar]
- Markwardt, C. B., Swank, J. H., Strohmayer, T. E., in ’t Zand, J. J. M., & Marshall, F. E. 2002, ApJ, 575, L21 [Google Scholar]
- Markwardt, C. B., Pereira, D., Swank, J. H., et al. 2007, Astr. Tel., 1051 [Google Scholar]
- Markwardt, C. B., Strohmayer, T. E., Swank, J. H., Pereira, D., & Smith, E. 2010a, Astr. Tel., 2576 [Google Scholar]
- Markwardt, C. B., & Strohmayer, T. E. 2010b, ApJ, 717, L149 [NASA ADS] [CrossRef] [Google Scholar]
- Patruno, A., Rea, N., Altamirano, D., et al. 2009, MNRAS, 396, L51 [NASA ADS] [Google Scholar]
- Pavan, L., Chenevez, J., Bozzo, E., et al. 2010, Astr. Tel., 2548 [Google Scholar]
- Peng, F., Brown, E. F., Truran, J. W., et al. 2007, ApJ, 654, 1022 [NASA ADS] [CrossRef] [Google Scholar]
- Powell, C. R., Haswell, C. A., Falanga, M., et al. 2007, MNRAS, 374, 466 [NASA ADS] [CrossRef] [Google Scholar]
- Predehl, P., & Schmitt, J. H. M. M. 1995, A&A, 293, 889 [NASA ADS] [Google Scholar]
- Shahbaz, T., Charles, P. A., & King, A. R. 1998, MNRAS, 301, 382 [NASA ADS] [CrossRef] [Google Scholar]
- Strohmayer, T. E., & Bildsten L. 2006, in Compact stellar X-ray sources, ed. W. Lewin, & M., van der Klis (Cambridge University Press), 113 [Google Scholar]
- Strohmayer, T. E., et al. 2010, Astr. Tel., 2569 [Google Scholar]
- Thompson, T. W. J., & Rothschild, R. E. 2009, ApJ, 691, 1744 [NASA ADS] [CrossRef] [Google Scholar]
- Trap, G., Falanga, M., Goldwurm, A., et al. 2009, A&A, 504, 510 [Google Scholar]
- Valinia, A., & Marshall, F. E. 1998, ApJ, 505, 134 [NASA ADS] [CrossRef] [Google Scholar]
- van der Klis, M. 1988, Timing Neutron Stars, ed. H. Ogelman, & E. P. J. van den Heuvel, NATO ASI Series C, 262, 27 [Google Scholar]
- Vaughan, S., Goad, M. R., Beardmore, A. P., et al. 2006, ApJ, 638, 920 [NASA ADS] [CrossRef] [Google Scholar]
- Wallace, R. K., & Woosley, S. E. 1981, ApJS, 45, 389 [NASA ADS] [CrossRef] [Google Scholar]
- Wang, Y.-M. 1995, ApJ, 449, L153 [NASA ADS] [Google Scholar]
- Wijnands, R., in ’t Zand, J. J. M., Rupen, M., et al. 2006, A&A, 449, 1117 [NASA ADS] [CrossRef] [EDP Sciences] [Google Scholar]
- Wijnands, R., Rol, E., Cackett, E., et al. 2009, MNRAS, 393, 126 [NASA ADS] [CrossRef] [Google Scholar]
- Yang, Y. J., Russell, D. M., Wijnands, R., et al. 2010, Astr. Tel., 2579 [Google Scholar]
All Tables
Parameters of the orbital solution of Swift J1749.4−2807, as derived from the RXTE observations (errors are given at 1σ c.l. on the last digit).
All Figures
|
Fig. 1 The type-I X-ray burst detected by INTEGRAL/JEM-X2 from Swift J1749.4−2807. The JEM-X (3−20 keV) net light curve is shown (background subtracted). The time bin is 2 s and the start time of the burst is 2010 April 13 at 16:51:18 (UTC at satellite location). |
| In the text | |
|
Fig. 2 Measurements of the spin period of Swift J1749.4−2807 in the RXTE data. The spin period is computed in each case by using a time window with a duration of between 200 s and 1000 s (depending on the source intensity) and fitting with a Gaussian function the peak in the Z2-statistics corresponding to the first overtone of the pulse. From these measurements, we derived the orbital parameters reported in Table 3. The corresponding orbital solution is represented in this figure with a dotted line. |
| In the text | |
|
Fig. 3 Fourier analysis of the pulsed signal throughout the RXTE monitoring of Swift J1749.4−2807: A0,1,2 are the powers of the first three Fourier coefficients. The pulse profiles have been rebinned to obtain a S/N at least 50 and only detections at more than 3σ of A1,2 are reported. |
| In the text | |
|
Fig. 4 Pulse profiles of Swift J1749.4−2807 in the RXTE observations (the observation ID. is indicated in each panel) normalized for the corresponding average count-rate and folded with respect to the same reference time (53 888.9854166670 MJD). The energy band is 3–23 keV (data from PCU2). In the observation 95085-09-02-02, the eclipse was excluded. The solid line in each figure is obtained by truncating the Fourier series expansion of the pulses profiles to the first three terms. |
| In the text | |
|
Fig. 5 Fractional rms as a function of the energy derived from the average pulse profiles of the RXTE observations (see text for further details). |
| In the text | |
|
Fig. 6 Left: RXTE orbital folded light curve of Swift J1749.4−2807. Diamonds refer to the observation 95085-09-02-04, triangles to 95085-09-02-11, and the other points to the observation 95085-09-02-02. The light curves are normalized to the average values outside the eclipse and rebinned to obtain a S/N ≃ 8 in each time bin. Right: Swift /XRT folded light curve of Swift J1749.4−2807 (0.3−10 keV). The eclipse occurred during the observation ID. 00031686002. In both panels, the solid line is the shape of the eclipse determined from the RXTE observation 95085-09-02-02. |
| In the text | |
|
Fig. 7 Upper panels: Swift /XRT image of Swift J1749.4−2807 extracted during the eclipse in the observation ID. 00031686002 (exposure time 840 s, see Fig. 6). The left (right) panel shows the image of the source in the 0.3−5 keV (5−10 keV) energy band. The black line corresponds to a distance of 1 arcmin in the images. A source is detected at low energies, but not at high energies. Lower panels: the same as for the upper panel, but the images were extracted during the same observation outside the eclipse (exposure time 840 s). From this image, it is clear that the in-eclipse PSF looks more extended than the point-like PSF observed out of eclipse. |
| In the text | |
|
Fig. 8 Radial distribution of photons extracted from the image of Swift J1749.4−2807 during the eclipse (0.3−5 keV energy band). The distribution is much flatter than the PSF of a point-like source in Swift /XRT (solid line). |
| In the text | |
|
Fig. 9 Swift /XRT light curves of observation ID. 00031686002 in the 0.3−5 keV and 5−10 keV energy bands. The lower panel shows the corresponding hardness ratio. The rates measured during the eclipse are indicated. |
| In the text | |
|
Fig. 10 Left: long-term light curve of the outburst of Swift J1749.4−2807 in 2010. Stars, triangles and diamonds represent respectively Swift, INTEGRAL, and RXTE observations. The downward arrows indicate the upper limits to the source X-ray flux. All the fluxes are in the 3−20 keV energy band and have not been corrected for absorption. We converted Swift /XRT fluxes from the 0.5−10 keV energy band to the energy band 3−20 keV by using the spectral model of each observation and the online tool webpimms (http://heasarc.nasa.gov/Tools/w3pimms.html). The errors on the fluxes are given at 90% c.l. The large upward arrow indicates the time of the type I X-ray burst. Right: the outburst of Swift J1749.4−2807 occurred in 2006 as observed by Swift /XRT (red stars). Here the fluxes are in the 0.3−10 keV energy band. For comparison, we report in this panel the Swift /XRT observations in the same energy range carried out during the outburst in 2010 (in black diamonds). The times of the observations in 2006 and 2010 have been scaled to the rise time of the corresponding type-I X-ray burst detected during each event. |
| In the text | |
Current usage metrics show cumulative count of Article Views (full-text article views including HTML views, PDF and ePub downloads, according to the available data) and Abstracts Views on Vision4Press platform.
Data correspond to usage on the plateform after 2015. The current usage metrics is available 48-96 hours after online publication and is updated daily on week days.
Initial download of the metrics may take a while.