Fig. 7
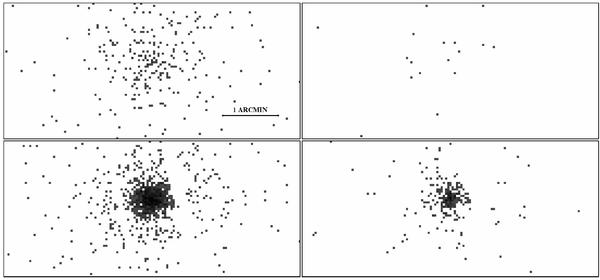
Upper panels: Swift /XRT image of Swift J1749.4−2807 extracted during the eclipse in the observation ID. 00031686002 (exposure time 840 s, see Fig. 6). The left (right) panel shows the image of the source in the 0.3−5 keV (5−10 keV) energy band. The black line corresponds to a distance of 1 arcmin in the images. A source is detected at low energies, but not at high energies. Lower panels: the same as for the upper panel, but the images were extracted during the same observation outside the eclipse (exposure time 840 s). From this image, it is clear that the in-eclipse PSF looks more extended than the point-like PSF observed out of eclipse.
Current usage metrics show cumulative count of Article Views (full-text article views including HTML views, PDF and ePub downloads, according to the available data) and Abstracts Views on Vision4Press platform.
Data correspond to usage on the plateform after 2015. The current usage metrics is available 48-96 hours after online publication and is updated daily on week days.
Initial download of the metrics may take a while.