Fig. 10
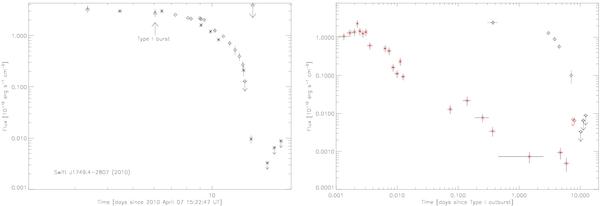
Left: long-term light curve of the outburst of Swift J1749.4−2807 in 2010. Stars, triangles and diamonds represent respectively Swift, INTEGRAL, and RXTE observations. The downward arrows indicate the upper limits to the source X-ray flux. All the fluxes are in the 3−20 keV energy band and have not been corrected for absorption. We converted Swift /XRT fluxes from the 0.5−10 keV energy band to the energy band 3−20 keV by using the spectral model of each observation and the online tool webpimms (http://heasarc.nasa.gov/Tools/w3pimms.html). The errors on the fluxes are given at 90% c.l. The large upward arrow indicates the time of the type I X-ray burst. Right: the outburst of Swift J1749.4−2807 occurred in 2006 as observed by Swift /XRT (red stars). Here the fluxes are in the 0.3−10 keV energy band. For comparison, we report in this panel the Swift /XRT observations in the same energy range carried out during the outburst in 2010 (in black diamonds). The times of the observations in 2006 and 2010 have been scaled to the rise time of the corresponding type-I X-ray burst detected during each event.
Current usage metrics show cumulative count of Article Views (full-text article views including HTML views, PDF and ePub downloads, according to the available data) and Abstracts Views on Vision4Press platform.
Data correspond to usage on the plateform after 2015. The current usage metrics is available 48-96 hours after online publication and is updated daily on week days.
Initial download of the metrics may take a while.