| Issue |
A&A
Volume 512, March-April 2010
|
|
|---|---|---|
| Article Number | A73 | |
| Number of page(s) | 13 | |
| Section | Interstellar and circumstellar matter | |
| DOI | https://doi.org/10.1051/0004-6361/200913640 | |
| Published online | 07 April 2010 | |
Resolving the dusty circumstellar
environment of the A[e] supergiant HD 62623 with the VLTI/MIDI![[*]](/icons/foot_motif.png)
A. Meilland1 - S. Kanaan2 - M. Borges Fernandes2 - O. Chesneau2, F. Millour1 - Ph. Stee2 - B. Lopez2
1 - Max Planck Intitut für Radioastronomie, Auf dem Hugel 69, 53121
Bonn, Germany
2 - UMR 6525 CNRS H. FIZEAU UNS, OCA, Campus Valrose, 06108 Nice Cedex
2, France CNRS, Avenue Copernic, Grasse, France
Received 11 November 2009 / Accepted 9 December 2009
Abstract
Context. B[e] stars are hot stars surrounded by
circumstellar gas and dust which is responsible for the presence of
emission lines and IR-excess in their spectra. How dust can be formed
in this highly illuminated and diluted environment remains an open
issue.
Aims. HD 62623 is one of the very few
A-type supergiants showing the B[e] phenomenon. We studied the geometry
of its circumstellar envelope in the mid-infrared using long-baseline
interferometry, which is the only observing technique able to spatially
resolve objects smaller than a few tens of milliarcseconds.
Methods. We obtained nine calibrated visibility
measurements between October 2006 and January 2008 using the VLTI/MIDI
instrument in SCI-PHOT mode and PRISM spectral dispersion mode with
projected baselines ranging from 13 to 71 m and with
various position angles (PA). We used geometrical models and physical
modeling with a radiative transfer code to analyze these data.
Results. The dusty circumstellar environment of
HD 62623 is partially resolved by the VLTI/MIDI, even with the
shortest baselines. The environment is flattened (
![]() )
and can be separated into two components: a compact one whose extension
grows from 17 mas at 8
)
and can be separated into two components: a compact one whose extension
grows from 17 mas at 8 ![]() m to 30 mas at 9.6
m to 30 mas at 9.6 ![]() m and stays
almost constant up to 13
m and stays
almost constant up to 13 ![]() m, and a more extended one that is over-resolved
even with the shortest baselines. Using the radiative transfer code
MC3D, we managed to model HD 62623's circumstellar environment
as a dusty disk with an inner radius of
m, and a more extended one that is over-resolved
even with the shortest baselines. Using the radiative transfer code
MC3D, we managed to model HD 62623's circumstellar environment
as a dusty disk with an inner radius of ![]() AU,
an inclination angle of
AU,
an inclination angle of ![]() ,
and a mass of
,
and a mass of ![]()
![]() .
.
Conclusions. It is the first time that the dusty
disk inner rim of a supergiant star exhibiting the B[e] phenomenon is
significantly constrained. The inner gaseous envelope likely
contributes up to 20![]() to the total N band flux and acts like a reprocessing disk.
Finally, the hypothesis of a stellar wind deceleration by the
companion's gravitational effects remains the most probable case since
the bi-stability mechanism does not seem to be efficient for this star.
to the total N band flux and acts like a reprocessing disk.
Finally, the hypothesis of a stellar wind deceleration by the
companion's gravitational effects remains the most probable case since
the bi-stability mechanism does not seem to be efficient for this star.
Key words: techniques: high angular resolution - techniques: interferometric - stars: emission-line, Be - stars: winds, outflows - stars: individual: HD 62623 - circumstellar matter
1 Introduction
The B[e] phenomenon is defined by strong Balmer lines in emission, low-excitation emission lines (especially of ionized metals such as FeII), forbidden emission lines of [FeII] and [OI], and strong infrared excess due to hot circumstellar dust (Lamers et al. 1998). However, these objects are not a homogeneous group of stars in terms of stellar evolution, as such features have been detected for both pre-main sequence and evolved stars. Thus, this group of stars has been divided into four subclasses: B[e] supergiants, Herbig AeB[e] stars, compact planetary nebulae B[e]-type stars, and symbiotic B[e]-type stars. Moreover, since the spectral class of some of these stars was still very difficult to determine accurately, a fifth class was added: unclassified B[e] stars. Recently, in an effort to investigate this mysterious subgroup, Miroshnichenko (2007) has proposed to classify most of their members as a new homogeneous group of non-supergiant and non-pre-main sequence stars. He proposes to name this group after its precursor, i.e. FS CMa's group. Finally, the binarity detected for 30% of these stars could play a key role in the origin of the B[e] phenomenon for these FS CMa stars.
![\begin{figure}
\par\includegraphics[height=6cm,clip]{13640f01.ps}\includegraphics[height=6cm,clip]{13640f02.ps}
\end{figure}](/articles/aa/full_html/2010/04/aa13640-09/img14.png)
|
Figure 1:
Left: HD 62623 SED from various
sources of literature: red circles are flux measurements listed in
Bittar et al. (2001);
green lines, IRAS LRS spectra; dark blue lines, IUE spectra; light blue
lines with errors bars, our VLTI/MIDI measurements; and the dark line
is the best reddened Kurucz model, whose parameters are presented in
Table 1.
Right: zoom of the N band of the SED
(8-13 |
| Open with DEXTER | |
In this context, HD 62623 (3 Puppis, HR 2996) was
classified as an A2Iabe in the Yale Bright Stars Catalogue
(Hoffeit & Jaschek 1982)
making it one of the latest stars showing the B[e] phenomenon. Other
classifications range from A2Ia to A3IIpe. Its distance was estimated
to be ![]() pc, and its radius
pc, and its radius ![]() (Bittar et al. 2001).
It exhibits radial velocity variations with a period of
137.7 days, interpreted as direct evidence of an unseen
companion (Lambert 1988).
Plets et al. (1995)
found that a 161.1-day period can also fit these variations. In both
hypotheses, the system seems to be composed of a massive primary star
with 31
(Bittar et al. 2001).
It exhibits radial velocity variations with a period of
137.7 days, interpreted as direct evidence of an unseen
companion (Lambert 1988).
Plets et al. (1995)
found that a 161.1-day period can also fit these variations. In both
hypotheses, the system seems to be composed of a massive primary star
with 31
![]() and a low mass ratio of
0.03<M2/M1<0.15,
while the projected semi-major axis is
1.6 AU <
and a low mass ratio of
0.03<M2/M1<0.15,
while the projected semi-major axis is
1.6 AU < ![]() < 2.4 AU.
< 2.4 AU.
Using color indices (H - K)
and (K - L), Allen (1973) found that
HD 62623's infrared excess is too large to only originate in
the free-free and free-bound emissions of a gaseous envelope and is
probably due to the presence of optically thick dust in the
circumstellar environment of this star. Observations with the
low-resolution spectrograph (LRS) of the InfraRed Astronomical
Satellite (IRAS) clearly exhibit a 9.6 ![]() m silicate feature in the object spectra,
confirming the presence of dust in the envelope. Since the star also
shows evidence of H
m silicate feature in the object spectra,
confirming the presence of dust in the envelope. Since the star also
shows evidence of H![]() and [OI] emission lines (Swings & Allen 1976), it was
classified as a B[e] supergiant, i.e. sgB[e] (Miroshnichenko 2007).
and [OI] emission lines (Swings & Allen 1976), it was
classified as a B[e] supergiant, i.e. sgB[e] (Miroshnichenko 2007).
The formation mechanisms responsible for sgB[e] stars' circumstellar environment are still an open issue. Spectroscopic and polarimetric observations suggest that their circumstellar envelopes are nonspherical (Magalhães 1992). Zickgraf et al. (1985) proposed a general scheme for these stars consisting of a hot and fast line-driven polar wind responsible for the presence of forbidden lines and a slowly expanding dense equatorial region where permitted-emission lines and dust can form. The deviation from the spherical geometry for this model can be produced by a nearly critically rotating star.
Using aperture masking interferometry with the Keck I
telescope, Bittar et al. (2001)
partially resolved HD 62623's circumstellar envelope
between 1.65 and 3.08 ![]() m and show that the envelope extension was
increasing from 6-7 mas at 1.65
m and show that the envelope extension was
increasing from 6-7 mas at 1.65 ![]() m to 25-30 mas at 3.08
m to 25-30 mas at 3.08 ![]() m. Stee
et al. (2004)
have successfully modeled both these observations and the spectral
energy distribution (SED) using a gas + dust model
with an inner dust radius of 15-20
m. Stee
et al. (2004)
have successfully modeled both these observations and the spectral
energy distribution (SED) using a gas + dust model
with an inner dust radius of 15-20 ![]() and a temperature at this boundary of 1500 K. In their best
model, the gas emission originates in the inner part of the envelope
and not in a polar wind. Nevertheless, the issue of HD 62623's
envelope flattening remains unsolved, even if Yudin & Evans (1998) measured a
polarization in the visible of 1.5% with a polarization angle
of 95
and a temperature at this boundary of 1500 K. In their best
model, the gas emission originates in the inner part of the envelope
and not in a polar wind. Nevertheless, the issue of HD 62623's
envelope flattening remains unsolved, even if Yudin & Evans (1998) measured a
polarization in the visible of 1.5% with a polarization angle
of 95 ![]() 5
5![]() ,
which seems to favor a nonspherical object.
,
which seems to favor a nonspherical object.
By putting strong constraints on the envelope geometry,
long-baseline infrared interferometry can be a key technique for
studying the physics of active hot stars (Stee et al. 2005). Using both
VLTI/MIDI and VLTI/AMBER data, Domiciano de Souza et al.
(2007) resolved the circumstellar environment of the sgB[e] CPD -57![]() 2874
and modeled it as a flattened compact envelope with an extension
increasing with wavelength.
2874
and modeled it as a flattened compact envelope with an extension
increasing with wavelength.
In this paper, we present new spectrally resolved VLTI/MIDI interferometric observations of HD 62623 that allow us to characterize its circumstellar envelope geometry and determine its physical parameters.
The paper is organized as follows. In Sect. 2 we start our modeling of HD 62623 by reconstructing its SED to constrain its stellar parameters and distance. The VLTI/MIDI observations and the data reduction process are briefly introduced in Sect. 3, and a first analysis of the calibrated visibilities using simple geometrical models is presented in Sect. 4. The result of this study is used as a starting point for a three-dimensional Monte-Carlo radiative transfer modeling presented in Sect. 5. Finally, the physical properties of HD 62623 are discussed in Sect. 6, while Sect. 7 draws the main conclusions of this study.
2 Preliminary study
2.1 The spectral energy distribution
To accurately determine the stellar parameters of HD 62623, we started our study by reconstructing the object SED using photometric and low-resolution spectral measurements ranging from ultraviolet to far-infrared. We used data from various sources in the literature already described in Bittar et al. (2001). These data include IRAS fluxes and low resolution spectra (LRS), IUE spectra, and other photometric measurements in the UV, the visible, and the near-IR. We also included our N band VLTI/MIDI spectra in this study. The resulting reconstructed SED is plotted in Fig. 1. The strong IR-excess due to circumstellar dust is shown by the inflection point in the SED around 1.52.2 Circumstellar or interstellar extinction
We tried to fit the UV and visible parts of the reconstructed SED using
typical Kurucz models (Kurucz 1979)
for supergiant stars; i.e., with
1.5 < log g < 2.5
and 8000 K <
![]() K.
None of these models were able to simultaneously fit all the SED from
UV wavelengths up to 1
K.
None of these models were able to simultaneously fit all the SED from
UV wavelengths up to 1 ![]() m, and the observed SED seems to be slightly
reddened. To explain this reddening, two hypotheses can be formulated:
(1) if the circumstellar dust becomes optically thick at short
wavelengths, it can absorb a part of the stellar UV emission,
assuming this dust is located in the line of sight, or (2) the
reddening can be due to interstellar matter.
m, and the observed SED seems to be slightly
reddened. To explain this reddening, two hypotheses can be formulated:
(1) if the circumstellar dust becomes optically thick at short
wavelengths, it can absorb a part of the stellar UV emission,
assuming this dust is located in the line of sight, or (2) the
reddening can be due to interstellar matter.
It is hard to distinguish between these two hypotheses without
fully modeling HD 62623's circumstellar environment. However,
it is still possible to estimate the reddening without solving the
issue concerning its origin. Using the Meynet & Hauck (1985) intrinsic
Geneva colors laws for A-F supergiants, Plets et al. (1995) estimated a
reddening E(B-V)
of 0.17 ![]() 0.03.
0.03.
Table 1: Stellar parameters from the fit of HD 62623 SED.
2.3 Stellar parameters
Assuming that the extinction originates in a standard interstellar
medium (RV=3.1)
and that it follows Cardelli et al.'s (1989) law from UV to
far-IR wavelengths, the SED can be successfully fitted with reddened
Kurucz models with ![]() ranging from 8000 K to 8500 K and log g
from 1.5 to 2.5. Our best model, using
ranging from 8000 K to 8500 K and log g
from 1.5 to 2.5. Our best model, using ![]() K
and log g = 2.0, is
overplotted in Fig. 1.
The good agreement between the observed SED and the modeled one is
obtained for an d/
K
and log g = 2.0, is
overplotted in Fig. 1.
The good agreement between the observed SED and the modeled one is
obtained for an d/![]() ratio of
ratio of ![]() ,
where the distance d is expressed in parsecs and
the stellar radius
,
where the distance d is expressed in parsecs and
the stellar radius ![]() in
in ![]() .
Since a typical value of
.
Since a typical value of ![]() for an A supergiant is 65
for an A supergiant is 65 ![]() 5 (Allen 2000), we can
estimate a distance for the star of 650
5 (Allen 2000), we can
estimate a distance for the star of 650 ![]() 100 pc, which is compatible
with the previous estimation by Bittar et al. (2001). The
resulting parameters used in this paper to model HD 62623's
central star are presented in Table 1.
100 pc, which is compatible
with the previous estimation by Bittar et al. (2001). The
resulting parameters used in this paper to model HD 62623's
central star are presented in Table 1.
3 VLTI/MIDI observations and data reduction
Table 2: VLTI/MIDI observations log of HD 62623 and its calibrators.
VLTI/MIDI observations of HD 62623 were carried out at Paranal Observatory between October 2006 and January 2008 (quaranteed time observing runs 078.D-0511 and 080.D.0181) with the 1.8 m Auxiliary Telescopes (ATs). We obtained nine visibility measurements with projected baselines ranging from 13.4 to 71.4 m and with various orientations on the sky plane. Three stars were used as calibrators during this observing campaign: Procyon, Sirius, and Alphard. The log of these observations is presented in Table 2.
All observations were made with the SCI-PHOT mode, which
enables a better visibility calibration since the photometry and the
interferometric fringes are recorded simultaneously. Thanks to the
PRISM low spectral dispersion mode, we also obtained spectrally
resolved visibility with R=30 in the
N band (7.5-13.5 ![]() m). Two different reduction packages were used to
reduce these data: MIA developed at the Max-Planck Institut für
Astronomie and EWS developed at the Leiden Observatory
(MIA + EWS, ver. 1.5.1). Since the two
methods provide the same results within the error bars, we decided to
use the MIA reduced visibilities in this work.
m). Two different reduction packages were used to
reduce these data: MIA developed at the Max-Planck Institut für
Astronomie and EWS developed at the Leiden Observatory
(MIA + EWS, ver. 1.5.1). Since the two
methods provide the same results within the error bars, we decided to
use the MIA reduced visibilities in this work.
HD 62623's (u, v)
plane coverage is plotted in Fig. 2. The wide spread
of baseline length (between 13.4 and 71.4) and PA
(between -4.1![]() and 85.3
and 85.3![]() )
will allow us to put strong constraints on the envelope geometry in the
N band (i.e. extension, flattening, radial intensity profile).
Moreover, two triplets of baselines are almost aligned: B2,
B3, and B6 with
PA
)
will allow us to put strong constraints on the envelope geometry in the
N band (i.e. extension, flattening, radial intensity profile).
Moreover, two triplets of baselines are almost aligned: B2,
B3, and B6 with
PA ![]() 40
40![]() ,
and B4, B5, and B9
with PA
,
and B4, B5, and B9
with PA ![]() 85
85![]() .
This will simplify our modeling by allowing us to directly determine
the object's projected intensity profile at these two orientations.
.
This will simplify our modeling by allowing us to directly determine
the object's projected intensity profile at these two orientations.
![\begin{figure}
\includegraphics[width=8cm,clip]{13640f03.ps}
\end{figure}](/articles/aa/full_html/2010/04/aa13640-09/img29.png)
|
Figure 2:
UV plane coverage obtained for HD 62623. The dotted line
represents the polarization angle measured by Yudin & Evans (1998). The circle
colors represent the two triplets of aligned baselines discussed in
Sect. 3: red for PA |
| Open with DEXTER | |
4 Results
4.1 Visibilty and Gaussian equivalent FWHM
The calibrated visibilities for the nine projected baselines are
plotted as a function of wavelength in Fig. 3. All these
spectrally resolved visibilities, except the ones from the two longest
baselines (i.e., B7 and B8),
exhibit a small drop with a minimum around 9.6 ![]() 0.1
0.1 ![]() m. Such an
effect, often found in N-band interferometric observations of dusty
circumstellar environments, comes from an opacity increase between the
continuum and a silicate band. This greater opacity in the silicate
band causes the circumstellar envelope to appear more extended than in
the continuum. That such an effect is not visible in the B7
and B8 data probably means that both the
silicate and the continuum emission are over-resolved with these
baselines. We note that, for this A[e] supergiant star, the silicate
band is clearly in emission (see Fig. 1).
m. Such an
effect, often found in N-band interferometric observations of dusty
circumstellar environments, comes from an opacity increase between the
continuum and a silicate band. This greater opacity in the silicate
band causes the circumstellar envelope to appear more extended than in
the continuum. That such an effect is not visible in the B7
and B8 data probably means that both the
silicate and the continuum emission are over-resolved with these
baselines. We note that, for this A[e] supergiant star, the silicate
band is clearly in emission (see Fig. 1).
The object is partially resolved for all baselines, even for
the shortest ones (i.e., V<0.9 for B6=13.3 m
and B9=14.0 m). This implies that the
circumstellar envelope is quite extended. To roughly estimate its size,
we calculated the Gaussian equivalent FWHM for each
baseline and at three wavelengths (i.e., 8, 10, and 12 ![]() m). The
results, presented in Table 3, clearly
show that the envelope extension is growing by about 45
m). The
results, presented in Table 3, clearly
show that the envelope extension is growing by about 45![]() between 8 and 10
between 8 and 10 ![]() m, whereas it remains nearly constant
between 10 and 12
m, whereas it remains nearly constant
between 10 and 12 ![]() m. As already mentioned, the envelope size
variation between 8 and 10
m. As already mentioned, the envelope size
variation between 8 and 10 ![]() m is mainly due to the change in opacity between
the continuum and the silicate band, but another effect has to be
considered to explain why the size does not drop back to its 8
m is mainly due to the change in opacity between
the continuum and the silicate band, but another effect has to be
considered to explain why the size does not drop back to its 8 ![]() m value
from 10 to 12
m value
from 10 to 12 ![]() m. Remembering that longer wavelengths can probe
a cooler region, it implies that the size of the emission is growing
with the wavelength for an untruncated gaseous or dusty envelope heated
by a central source, i.e., a single star, as the cooler regions are
located farther from the heating source. If the size in the continuum
were not increasing with the wavelength, this would have implied that
the disk was somehow truncated, as was discovered for the classical Be
star
m. Remembering that longer wavelengths can probe
a cooler region, it implies that the size of the emission is growing
with the wavelength for an untruncated gaseous or dusty envelope heated
by a central source, i.e., a single star, as the cooler regions are
located farther from the heating source. If the size in the continuum
were not increasing with the wavelength, this would have implied that
the disk was somehow truncated, as was discovered for the classical Be
star ![]() Arae
(Meilland et al. 2007),
or that the disk was mainly isothermal (Jones et al. 2004).
Arae
(Meilland et al. 2007),
or that the disk was mainly isothermal (Jones et al. 2004).
![\begin{figure}
\par\includegraphics[width=8.5cm,clip]{13640f04.ps}
\end{figure}](/articles/aa/full_html/2010/04/aa13640-09/img30.png)
|
Figure 3:
HD 62623 VLTI/MIDI calibrated visibilities for the nine
baselines from Fig. 2 plotted as a function of wavelength. The
dotted line corresponds to the central wavelength of the silicate band,
i.e., 9.6 |
| Open with DEXTER | |
Table 3: Gaussian-disk equivalent FWHM for all baselines.
If the intensity distribution of the object was close to an elliptical Gaussian, the estimated FWMH should only depend on the baseline orientation and not on its length. As already mentioned in the previous section, two groups of three baselines are almost aligned. Consequently, the Gaussian equivalent FWHM should be nearly constant within each one. As shown in Table 3, this is not the case for HD 62623 and for a given wavelength and PA The estimated size shrinks with the baseline length, and finally, the Gaussian equivalent size measured for the shortest baseline is about twice the one measured for the longest baseline. This result is also valid if we model the object as a single uniform ellipse or elliptical ring. This clearly shows that the object geometry is more complicated and should be modeled using at least two components: a compact one that is resolved only by the longest baselines and a more extended one that may even be fully resolved by the smallest baselines.
This assumption becomes obvious when plotting the visibility
for all baselines as a function of the spatial frequency ![]() (Fig. 4).
This plot also exhibits all the previously described characteristics of
the object in a very synthetic way. The wavelength dependence is shown
in each of the seven curves representing the visibility for each
baseline. These curves are inverted compared to Fig. 3 (i.e., the
wavelength increases from right to left), but both the silicate band
and the continuum effects on the visibility are shown. Clues to the
flattening of the envelope, at least in the silicate band, are also
shown since the visibility depends not only on the baseline length but
also on its orientation. The object is larger in the B2,
B3, and B9 orientation
(PA
(Fig. 4).
This plot also exhibits all the previously described characteristics of
the object in a very synthetic way. The wavelength dependence is shown
in each of the seven curves representing the visibility for each
baseline. These curves are inverted compared to Fig. 3 (i.e., the
wavelength increases from right to left), but both the silicate band
and the continuum effects on the visibility are shown. Clues to the
flattening of the envelope, at least in the silicate band, are also
shown since the visibility depends not only on the baseline length but
also on its orientation. The object is larger in the B2,
B3, and B9 orientation
(PA ![]() 40
40![]() )
than in the B4, B5, and B9
one (PA
)
than in the B4, B5, and B9
one (PA ![]() 85
85![]() ), and is
even larger along B1 (PA = 27.2
), and is
even larger along B1 (PA = 27.2![]() ). These
visibility variations as a function of the PA are consistent with an
orientation of the major axis of 5
). These
visibility variations as a function of the PA are consistent with an
orientation of the major axis of 5![]() derived from Yudin & Evans (1998)
polarization measurements. Nevertheless, the flattening cannot be
accurately determined without knowing the radial intensity profile of
the object. We note that B7 and B8
are almost aligned with the putative envelope major-axis.
derived from Yudin & Evans (1998)
polarization measurements. Nevertheless, the flattening cannot be
accurately determined without knowing the radial intensity profile of
the object. We note that B7 and B8
are almost aligned with the putative envelope major-axis.
4.2 A two-component model
It is obvious from Table 3 and
Fig. 4
that HD 62623 MIDI visibilities cannot be fitted by a single
component model. Thus, we try to fit them with three different kinds of
two-component geometrical models. For all of these models, the most
compact component is an elliptical Gaussian defined by three
parameters: the major-axis FWHM (a1),
the minor-axis FWHM (b1),
and the orientation of the major-axis into the sky plane (![]() ). Since the
polarization angle measurement seems to provide the orientation of the
minor axis with a good accuracy, we can set the value of
). Since the
polarization angle measurement seems to provide the orientation of the
minor axis with a good accuracy, we can set the value of ![]() to 5
to 5![]() .
We see in Sect. 5 that this component probably corresponds to the inner
rim of the circumstellar dusty disk and that it can be modeled as an
elliptical ring. However, the envelope is not fully resolved, and this
component can be successfully fitted by several other flattened models
including Gaussian or uniform ellipse.
.
We see in Sect. 5 that this component probably corresponds to the inner
rim of the circumstellar dusty disk and that it can be modeled as an
elliptical ring. However, the envelope is not fully resolved, and this
component can be successfully fitted by several other flattened models
including Gaussian or uniform ellipse.
![\begin{figure}
\par\includegraphics[width=8.5cm,clip]{13640f05.ps}
\end{figure}](/articles/aa/full_html/2010/04/aa13640-09/img33.png)
|
Figure 4:
HD 62623 VLTI/MIDI calibrated visibilities plotted as a function of
the spatial frequency |
| Open with DEXTER | |
The last parameter concerning this compact component is the flux ratio between this Gaussian (F1) and the total normalized flux at each wavelength. The flux of the extended component is consequently (1-F1). Since we want to determine if it can be fully resolved by the smallest baselines, we model it following three different ways of increasing complexity to test if we can put some constraints on its geometry. To check the consistency of our two-component modeling, we also add a ``reference'' model assuming only one elliptical Gaussian. The parameters of the four different geometries tested (G0, G1, G2, and G3) are the following:
- G0: this is the ``reference'' model. The geometry is defined by a single elliptical Gaussian. This model has only 2 free parameters: a1 and b1;
- G1: here, we consider that the extended component is fully resolved, and we model it as a homogeneous constant contribution. This first model has 3 free parameters: a1, b1, and F1;
- G2: we try to model the extended component as a Gaussian with the same flattening as the compact one so that it is only defined by its major axis FWHM a2. This model has 4 free parameters: a1, a2, b1, and F1;
- G3: in this last model, the minor axis FWHM (b2) of the extended component is also a free parameter. Thus, this model has 5 free parameters: a1, a2, b1, b2, and F1.
| Figure 5:
Best-fit model parameters and |
|
| Open with DEXTER | |
On the other hand, the relative flux of the two components and the
minor and major axes of the compact component are well-constrained and
do not depend on the geometry used to model the extended component in
the 8-12.5 ![]() m
range. We have shown that we cannot constrain the geometry of the
extended component; consequently, in the following, we will only
discuss results concerning the best-fitted G1 model. The
wavelength dependence of F1,
a1, a1/b1,
and the reduced
m
range. We have shown that we cannot constrain the geometry of the
extended component; consequently, in the following, we will only
discuss results concerning the best-fitted G1 model. The
wavelength dependence of F1,
a1, a1/b1,
and the reduced ![]() for the best-fitted G1 model are plotted in Fig. 5.
for the best-fitted G1 model are plotted in Fig. 5.
This figure clearly exhibits the effect of the 9.6 ![]() m silicate
band on the object geometry. The compact component extension and
flattening strongly varies between 8 and 10
m silicate
band on the object geometry. The compact component extension and
flattening strongly varies between 8 and 10 ![]() m. At
8
m. At
8 ![]() m
this structure does not show any flattening, and a1
and b1 are about
15-16 mas. Their respective size increases to about 22 and
28 mas at 10
m
this structure does not show any flattening, and a1
and b1 are about
15-16 mas. Their respective size increases to about 22 and
28 mas at 10 ![]() m and then remains almost constant up to
13
m and then remains almost constant up to
13 ![]() m.
On the other hand, the relative flux of the compact component F1/
m.
On the other hand, the relative flux of the compact component F1/
![]() is almost
constant between 8 and 10
is almost
constant between 8 and 10 ![]() m and about
m and about ![]() .
Beyond 10
.
Beyond 10 ![]() m,
it starts rising up to
m,
it starts rising up to ![]() around 13
around 13 ![]() m.
m.
As already mentioned in the previous sections, the envelope extension variation in the N band can be explained easily by the silicate band and continuum effects. However, the apparent variation of its flattening remains hard to explain in the scheme of a classical dusty disk. If the disk is Keplerian and stratified, we would expect it to be flared. Remembering that longer wavelengths are probing cooler regions, hence farther from the central star, we would expect that the apparent flattening of a flared disk decreases with wavelength. Another possibility is that the disk might be created by an outflowing radiative wind. In this case, if the terminal velocity of the wind is high enough to avoid any stratification of the disk, we would expect that the flattening does not depend on the wavelength. Additional effects have to be considered to allow the disk to appear more flattened at greater distances from the central star. One solution might be the presence of a puffed-up inner rim, as already proposed for Herbig stars by Natta et al. (2001). However more measurements are needed to solve these issues.
If we consider that the 13 ![]() m envelope is a geometrically thin equatorial
disk, the flattening would only come from its projection onto the sky
plane, and we can estimate HD 62623's inclination angle to be
38
m envelope is a geometrically thin equatorial
disk, the flattening would only come from its projection onto the sky
plane, and we can estimate HD 62623's inclination angle to be
38 ![]() 8
8![]() (using the 13
(using the 13 ![]() m
value for the flattening). Unfortunately, the disk may not be
geometrically thin and may also be flared, as already discussed.
Consequently, we can only estimate a lower limit on this parameter of 30
m
value for the flattening). Unfortunately, the disk may not be
geometrically thin and may also be flared, as already discussed.
Consequently, we can only estimate a lower limit on this parameter of 30![]() .
.
4.3 Comparison with KECK measurements
Using Keck I aperture-masking interferometry, Bittar et al. (2001) partially
resolved HD 62623's circumstellar environment in the
near-infrared. They estimated the circumstellar environment extension
using Gaussian disk models and found that its size was ![]() mas
at 1.65
mas
at 1.65 ![]() m,
m,
![]() mas
at 2.26, and
mas
at 2.26, and ![]() mas
at 3.08
mas
at 3.08 ![]() m.
Even if their estimation at 3.08 is almost two times more than our
compact component at 8
m.
Even if their estimation at 3.08 is almost two times more than our
compact component at 8 ![]() m, one must keep in mind that they only obtained
measurements for spatial frequencies less than 0.02 cycles/mas
and that we should compare it to a ``single'' Gaussian estimation for
our small and intermediate baselines (i.e., B3, B5,
B6, and B9 from
Table 3).
Using these measurements, we obtained an average size of
29.9 mas at 8
m, one must keep in mind that they only obtained
measurements for spatial frequencies less than 0.02 cycles/mas
and that we should compare it to a ``single'' Gaussian estimation for
our small and intermediate baselines (i.e., B3, B5,
B6, and B9 from
Table 3).
Using these measurements, we obtained an average size of
29.9 mas at 8 ![]() m. This value is clearly compatible with the one
determined by Bittar et al. (2001)
at 2.26 and 3.08
m. This value is clearly compatible with the one
determined by Bittar et al. (2001)
at 2.26 and 3.08 ![]() m. Moreover, the estimated size does not strongly
vary between 2.26 and 8
m. Moreover, the estimated size does not strongly
vary between 2.26 and 8 ![]() m (i.e., only 1.21 times larger), which
might indicate that the measured extension in the K band
is close to the diameter of the inner rim of the dusty disk.
m (i.e., only 1.21 times larger), which
might indicate that the measured extension in the K band
is close to the diameter of the inner rim of the dusty disk.
The existence of the two components in our HD 62623
modeling probably comes from the presence of a bright inner rim in the
dusty disk that probably lies within the compact component of our model
and is ``blurred'' because we do not fully resolved it. Thus, the inner
radius of the dusty disc should be smaller than the Gaussian equivalent
size measurement of the compact component at 8 ![]() m.
m.
We obtained 15 mas ![]() 16
16 ![]() at 8
at 8 ![]() m
for the compact component Gaussian equivalent FWHM,
and the extension at 2.26
m
for the compact component Gaussian equivalent FWHM,
and the extension at 2.26 ![]() m is 1.21 times smaller than the one at
8
m is 1.21 times smaller than the one at
8 ![]() m.
Moreover, when the envelope is not fully resolved, estimating its size
with a ring diameter corresponds to a value 1.24 times less
than if we were using a Gaussian FWHM. Thus, we can
roughly estimate the dusty disk inner rim radius to be
m.
Moreover, when the envelope is not fully resolved, estimating its size
with a ring diameter corresponds to a value 1.24 times less
than if we were using a Gaussian FWHM. Thus, we can
roughly estimate the dusty disk inner rim radius to be ![]() or 3 AU.
or 3 AU.
5 MC3D simulations of HD 62623
5.1 The Monte-Carlo code
MC3D (Wolf et al. 1999; Wolf 2003) is a three-dimensional continuum radiative transfer code. It is based on the Monte-Carlo method and solves the radiative transfer equations self-consistently. Starting with a spatial density distribution of scatterers and absorbers and some primary radiative source(s), it can be used to determine the temperature in this medium by an iterative process of heating, absorption, and reemission by dust grains. When the self-consistent temperature distribution is reached, the software can compute the resulting observables: SED, wavelength-dependent images, and polarization maps.
The software allows various geometries for the density distribution: one-dimensional (i.e., dust shells), two-dimensional (i.e., axi-symmetric disk or torus), or fully three-dimensional in spherical, cylindrical, or Cartesian coordinates (for example, to model inhomogeneities in a circumstellar disk).
5.2 Dust disk model
We decided to model HD 62623 with a two-dimensional dust
density distribution and a radial and vertical structure, as described
in Shakura & Sunyaev (1973)
and Wood et al. (2002):
|
(1) |
Here, r is the radial distance in the midplane of the disk,

|
(2) |
where
Details of the spatial distribution of chemical compositions, shapes,
sizes, and other parameters of real dust grains in this object are
poorly known. Large uncertainties of the real properties of dust
enormously increase the free parameter space of the models to be
explored. Since our purpose is to reconstruct global properties of the
disk, we decided to fix the dust grain properties. We have only treated
the transfer of dust radiation in this work. The gas component, present
in the model only implicitly, is described by a dust-to-gas ratio
of 1![]() within the dense disk.
within the dense disk.
We assumed the standard interstellar size distribution from
Mathis et al. (1977):

|
(3) |
where a is the dust grain radius extending from 0.005 to
| Figure 6: Typical radial and vertical density distribution for an equatorial wind ( left) and a Keplerian viscous disk ( right). |
|
| Open with DEXTER | |
![\begin{figure}
\par\includegraphics[width=17cm,clip]{13640f08.ps}
\end{figure}](/articles/aa/full_html/2010/04/aa13640-09/img54.png)
|
Figure 7:
From left to right: 8.2, 9.9, and 13.1 |
| Open with DEXTER | |
5.3 Model fitting
We calculated several hundred models to explore the free-parameters space and tried to constrain their values and uncertainties. We focused on both the viscous disk and the equatorial wind models defined in the previous section to test if we can clearly distinguish between them. Finally, we also tried many intermediate models which imply that the disk is slowly expanding and not perfectly stratified.
We considered the following outputs from our simulations:
- 1.
- the total SED computed from 1 to 20
 m that can
be directly compared to our reconstructed SED, including our MIDI data
presented in Sect. 2;
m that can
be directly compared to our reconstructed SED, including our MIDI data
presented in Sect. 2;
- 2.
- twenty
 pixels
intensity maps in the MIDI wavelength range, i.e., 8-13.5 m, with a
pixel size of 0.7 mas. Each image allows us to fit the
spectrally dispersed visibilities at one wavelength. The transformation
of the images into a visibility signal is straightforward: the images
are rotated by the PA angle of the object onto the sky and
then collapsed as a 1D flux distribution in the direction of
each of the nine baselines. These vectors are Fourier-transformed and
normalized.
pixels
intensity maps in the MIDI wavelength range, i.e., 8-13.5 m, with a
pixel size of 0.7 mas. Each image allows us to fit the
spectrally dispersed visibilities at one wavelength. The transformation
of the images into a visibility signal is straightforward: the images
are rotated by the PA angle of the object onto the sky and
then collapsed as a 1D flux distribution in the direction of
each of the nine baselines. These vectors are Fourier-transformed and
normalized.
Table 4: Parameters of the best-fitted MC3D models.
![\begin{figure}
\par\mbox{\includegraphics[width=8.5cm,clip]{13640f09.ps}\include...
...lip]{13640f11.ps}\includegraphics[width=8.5cm,clip]{13640f12.ps} }\end{figure}](/articles/aa/full_html/2010/04/aa13640-09/img63.png)
|
Figure 8: Fit of the nine visibility measurements ( top) and SED ( bottom) of the best equatorial wind model ( left) and Keplerian viscous disk model ( right). The dotted lines correspond to the models and the errors bars to the data. |
| Open with DEXTER | |
5.4 The best models
The parameters of the best equatorial wind and Keplerian viscous disk
models are presented in Table 8, and the
corresponding 8.2, 9.9, and 13.1 ![]() m images for
both geometries are plotted in Fig. 7. The fit of the
visibilities is plotted in Fig. 8. These figures
show that both scenarios are able to reproduce the general trends of
the seven shorter baseline visibility variations, but the ones measured
for B7 and B8 are
significantly underestimated for wavelengths shorter than 11
m images for
both geometries are plotted in Fig. 7. The fit of the
visibilities is plotted in Fig. 8. These figures
show that both scenarios are able to reproduce the general trends of
the seven shorter baseline visibility variations, but the ones measured
for B7 and B8 are
significantly underestimated for wavelengths shorter than 11 ![]() m. Such a
residual visibility might suggest the presence of structures not fully
resolved with the 70 m baselines, which are not taken into
account in our MC3D model. Some hypotheses on the nature of
these structures are discussed in Sect. 6.1.
m. Such a
residual visibility might suggest the presence of structures not fully
resolved with the 70 m baselines, which are not taken into
account in our MC3D model. Some hypotheses on the nature of
these structures are discussed in Sect. 6.1.
The reduced ![]() on the interferometric data of the best equatorial wind and Keplerian
disk are 14.9 and 11.5, respectively. These high values are
mainly due to the poor fit of the 70 m baselines. Thus,
skipping B7 and B8
measurements, the reduced
on the interferometric data of the best equatorial wind and Keplerian
disk are 14.9 and 11.5, respectively. These high values are
mainly due to the poor fit of the 70 m baselines. Thus,
skipping B7 and B8
measurements, the reduced ![]() reach values of 2.8 and 2.4, respectively. The main
qualitative difference between the two scenarios is the silicate-band
visibility drop scale. This favors the hypothesis of the stratification
of the disk.
reach values of 2.8 and 2.4, respectively. The main
qualitative difference between the two scenarios is the silicate-band
visibility drop scale. This favors the hypothesis of the stratification
of the disk.
![\begin{figure}
\par\includegraphics[height=0.275\textheight,clip]{13640f13.ps}\includegraphics[height=0.26\textheight,clip]{13640f14.ps}
\end{figure}](/articles/aa/full_html/2010/04/aa13640-09/img65.png)
|
Figure 9:
Left: visibility plotted as a function of the
spatial frequency for several random clump distributions (colored solid
lines) with |
| Open with DEXTER | |
However, the differences are small, and a large set of intermediate
values of ![]() and
and ![]() are also possible so that the disk stratification cannot be inferred
accurately. Actually, as can be seen in Fig. 7, the
geometrical differences between these scenarios are too small to be
properly constrained by our nine VLTI/MIDI measurements with
uncertainties of 5
are also possible so that the disk stratification cannot be inferred
accurately. Actually, as can be seen in Fig. 7, the
geometrical differences between these scenarios are too small to be
properly constrained by our nine VLTI/MIDI measurements with
uncertainties of 5![]() .
.
Nevertheless, despite our inability to deduce accurate values
of the radial and vertical disk structure from the visibility fits, we
clearly constrain the inner disk radius, ![]() (or
(or ![]() AU
for the equatorial wind and
AU
for the equatorial wind and ![]() AU
for the stratified disk). This represents the first measurement of the
extension of the inner rim of a B[e] supergiant dusty disk. The mass of
the envelope does not strongly depend on the disk stratification and is
also well constrained, i.e.,
AU
for the stratified disk). This represents the first measurement of the
extension of the inner rim of a B[e] supergiant dusty disk. The mass of
the envelope does not strongly depend on the disk stratification and is
also well constrained, i.e., ![]()
![]() ,
so is the inclination angle, i.e.,
,
so is the inclination angle, i.e., ![]() .
Finally, the position of the major axis is roughly perpendicular to
Yudin & Evans (1998)
polarization angle measurement 95
.
Finally, the position of the major axis is roughly perpendicular to
Yudin & Evans (1998)
polarization angle measurement 95![]() .
.
The SED fit for each scenario is presented in Fig. 8. For both
scenarios, the fit of the SED is not good enough, especially the
9.6 ![]() m
silicate peak, which is too strong for both models, whereas the
IR-excess is overestimated for the equatorial wind and underestimated
for the Keplerian disk scenario. However, the general agreement is
better for the Keplerian disk, and we note that both models managed to
reproduce the 13-20
m
silicate peak, which is too strong for both models, whereas the
IR-excess is overestimated for the equatorial wind and underestimated
for the Keplerian disk scenario. However, the general agreement is
better for the Keplerian disk, and we note that both models managed to
reproduce the 13-20 ![]() m
SED well.
m
SED well.
In fact, an accurate fit of the silicate feature is very often difficult to obtain. The strength of the feature depends on the size and composition of the silicate grains, but also on the level of the underlying continuum, thus, on the quality of the model density structure. The near-IR region of the SED is also strongly influenced by the detailed structure of the inner rim of the disk which is assumed to be a wall in this study. Recently, many studies have been devoted to this point in the field of young stellar objects, involving a puffed-up inner rim and dust settling (Dullemond et al. 2001, 2004; Tannirkulam et al. 2007).
For the Keplerian disk, the near-IR flux is underestimated
because the inner rim is probably not large enough. On the contrary,
the equatorial wind model overestimates the near-IR as a direct
consequence of the smaller density coefficient ![]() ,
making the inner rim almost as opaque as a true wall. Moreover, the
flaring of the density structure is also greater; thus, more of the
surface of the dust disk is directly exposed to the stellar radiation
and the vertical extent of the structure is probably overestimated.
,
making the inner rim almost as opaque as a true wall. Moreover, the
flaring of the density structure is also greater; thus, more of the
surface of the dust disk is directly exposed to the stellar radiation
and the vertical extent of the structure is probably overestimated.
6 Discussions
6.1 Nature of the residual visibility
As already mentioned in Sect. 4.1, that the two largest
baselines, i.e. B7 and B8,
do not exhibit the same wavelength dependence as the shorter ones, in
particular the lack of a clear drop in the visibility in the
9.6 ![]() m
silicate band, might be a clue that both the continuum and the silicate
emissions are over-resolved with these baselines. Since the visibility
does not reach zero with these baselines, but 0.17
m
silicate band, might be a clue that both the continuum and the silicate
emissions are over-resolved with these baselines. Since the visibility
does not reach zero with these baselines, but 0.17 ![]() 0.05
at 8
0.05
at 8 ![]() m
and 0.12
m
and 0.12 ![]() 0.03
at 13
0.03
at 13 ![]() m,
this might advocate for the presence of a unresolved structure that
contributes to the total flux at least to 17
m,
this might advocate for the presence of a unresolved structure that
contributes to the total flux at least to 17![]() at 8
at 8 ![]() m
and 12
m
and 12![]() at 13
at 13 ![]() m,
assuming it is fully unresolved.
m,
assuming it is fully unresolved.
This assumption is confirmed by our MC3D models that clearly
show the impossibility reproducing the B7 and B8
measurements simultaneously to the other ones. Actually, with these
70 m baselines, the dusty disk inner rim (i.e., ![]() AU = 12.8
AU = 12.8 ![]() )
is almost fully resolved. Thus, the visibility should be close to zero.
Taking a smaller
)
is almost fully resolved. Thus, the visibility should be close to zero.
Taking a smaller ![]() would lead to a better fit of B7 and B8
visibilities, but to an overestimation for the other ones. Moreover,
the fit of the largest baselines would not be totally satisfying since
the silicate band effect would be clearly visible in the modeling.
would lead to a better fit of B7 and B8
visibilities, but to an overestimation for the other ones. Moreover,
the fit of the largest baselines would not be totally satisfying since
the silicate band effect would be clearly visible in the modeling.
Thus, in the following, we investigate two different hypotheses to explain the residual visibility measured with the 70 m baselines.
6.1.1 Clumping of the dust disk
Effects of clumping on the visibility are not trivial and depend mainly
on the number of clumps and their extension. If they are unresolved,
i.e. ![]()
![]() ,
they will significantly increase the visibility level. However, if
their number is small, they will act like multiple objects and produce
oscillations structures in the visibility function as a function of the
spatial frequency. Consequently, since a clear increase in the
visibility level but no oscillation are evident in our data, we can
assume that the clumps are unresolved and numerous.
,
they will significantly increase the visibility level. However, if
their number is small, they will act like multiple objects and produce
oscillations structures in the visibility function as a function of the
spatial frequency. Consequently, since a clear increase in the
visibility level but no oscillation are evident in our data, we can
assume that the clumps are unresolved and numerous.
To simulate the effect of clumping on our visibility
measurements, we used a simple and ad-hoc method to produce a clumped,
dusty disk emission map. We computed a random clumps map in which each
clump is a normalized Gaussian. We then multiplied this map by an MC3D
emission map. The resulting map consists of a clumped version of our
previous MC3D emission map. Figure 9 (left) presents the
visibility plotted as a function of the spatial frequency for several
random clump distributions using a 13.1 ![]() m intensity map from our best MC3D Keplerian disk
model as an input and with
m intensity map from our best MC3D Keplerian disk
model as an input and with ![]() and
and ![]() mas.
An illustration of a randomly clumped map is also plotted in
Fig. 9 (right).
mas.
An illustration of a randomly clumped map is also plotted in
Fig. 9 (right).
This figure exhibits the random clump distribution effect on
the visibility. For the selected clump parameters, it clearly shows
that, when the global disk structure is fully resolved (i.e. ![]() ), the
visibility can take any value between 0 and 0.2,
depending on the clump distribution. Such random effects due to
clumpiness have already been studied using fully radiative transfer
clumped-disk models by Hönig et al. (2006) for AGN tori.
), the
visibility can take any value between 0 and 0.2,
depending on the clump distribution. Such random effects due to
clumpiness have already been studied using fully radiative transfer
clumped-disk models by Hönig et al. (2006) for AGN tori.
Finally, it seems that random clump distributions with the
previous parameters can produce visibilities compatible with our
measurements. We note that this result strongly depends on the baseline
PA, and two baselines separated by a few degrees can produce totally
different visibility profiles. Consequently, knowing that our two
largest baselines are separated by nearly 20![]() ,
that they exhibit nearly the same trend can be considered an argument
against the dust disk clumping hypothesis. However, we cannot totally
exclude that a random distribution of clumps may reproduce the observed
visibilities.
,
that they exhibit nearly the same trend can be considered an argument
against the dust disk clumping hypothesis. However, we cannot totally
exclude that a random distribution of clumps may reproduce the observed
visibilities.
6.1.2 Inner gaseous disk
To test if the inner gaseous disk of HD 62623 can be
responsible for the residual visibility, we used the SIMECA code
developed by Stee (1996)
to model the circumstellar gaseous environment of active hot stars.
This code is based on a latitudinal-dependent CAK wind model (Castor
et al. 1975)
and large velocity gradient radiative transfer (Sobolev 1960) and is able
to compute SED, hydrogen emission line profiles, and intensity maps in
the continuum and in the emission lines. However, in our case we only
need to compute radiative transfer in the continuum to
obtain 8 and 13 ![]() m intensity maps and 0.1-100
m intensity maps and 0.1-100 ![]() m SED. The
aim of this modeling is not to constrain the physical properties of
HD 62623's gaseous inner envelope, which is not possible
because of our small number of measurements, but rather to determine
whether this component can be responsible for the 70 m N-band
residual visibility.
m SED. The
aim of this modeling is not to constrain the physical properties of
HD 62623's gaseous inner envelope, which is not possible
because of our small number of measurements, but rather to determine
whether this component can be responsible for the 70 m N-band
residual visibility.
In the SIMECA code, m1
and m2 are exponents used to
set the latitudinal dependence of the mass-flux (![]() )
and terminal velocity (
)
and terminal velocity (![]() ),
respectively:
),
respectively:
|
(4) |
|
(5) |
Typical values of the terminal velocity of an A supergiant wind are on the order of 500 km s-1 (Achmad et al. 1997), although Lamer et al. (1995) derived a terminal velocity of
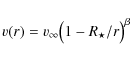
Thus, we tested various geometries and kinematics to simulate
HD 62623's gaseous environment: a spherical wind with terminal
velocities between 10 and 500 km s-1,
and a flattened envelope with terminal velocity between
100-500 kms-1 at the pole and
1-100 km s-1 at the equator.
We also tested various mass-loss rates and densities. This modeling
provides a typical extension for the gaseous environment of
5-10 mas in the N-band (assuming a 65 ![]() star located at 650 pc). Thus, the visibility of such a
component for a 70 m baseline is about 0.8-0.95 at 8
star located at 650 pc). Thus, the visibility of such a
component for a 70 m baseline is about 0.8-0.95 at 8 ![]() m and
0.91-0.97 at 13
m and
0.91-0.97 at 13 ![]() m.
Finally, this inner gaseous disk should be almost unresolved and can
explain the observed residual visibility.
m.
Finally, this inner gaseous disk should be almost unresolved and can
explain the observed residual visibility.
Assuming that all other components are fully resolved, we can
roughly deduce the 8 and 13 ![]() m flux of this structure to be 20
m flux of this structure to be 20![]() and 12
and 12![]() of the total flux, respectively. To produce such a contribution to the
observed flux, the mass of the gaseous envelope has to be around
of the total flux, respectively. To produce such a contribution to the
observed flux, the mass of the gaseous envelope has to be around ![]()
![]() .
.
To illustrate this scenario we combined an MC3D and a SIMECA
model without taking the interaction between the gas and the dust into
account. We calculated the complex visibility for each contribution
separately and finally add both components using the formula:
The resulting visibilities are plotted as a function of the spatial frequency in Fig. 10. An 8
![\begin{figure}
\par\includegraphics[height=0.28\textheight,clip]{13640f15.ps}\includegraphics[height=0.27\textheight,clip]{13640f16.ps}
\end{figure}](/articles/aa/full_html/2010/04/aa13640-09/img84.png)
|
Figure 10:
Left: visibility plotted as a function of the
spatial frequency for the SIMECA + MC3D model with parameters from
Table 5.
Right: corresponding 8 |
| Open with DEXTER | |
Table 5: Parameter values for the SIMECA model.
6.2 Physical conditions in the inner gaseous envelope
One of the main issues regarding supergiants showing the B[e] phenomenon is how dust can form in the surroundings of these highly luminous, hot stars. To form dust in a circumstellar environment, two conditions must be met: the temperature must be lower than the dust sublimation temperature (i.e., between 800 and 2000 K, depending on the chemical composition of the dust), and the density of the chemical elements involved in the dust formation have to be higher than a critical value.
These two conditions are hard to find at the same location in the circumstellar environment of these stars since, for most models, the density quickly falls with the distance. However, the stellar radiation might be shielded by the gaseous inner envelope. This would allow the temperature to decrease faster than in a normal reprocessing disk, and thus, the sublimation temperature could be reached closer to the central star.
Since we managed to significantly constrain the inner rim
extension of a supergiant dust disk for the first time, we can test
this hypothesis by inferring the temperature variation in the inner
gaseous envelope. We assume that the temperature distribution follows a
power law as a function of the distance to the central star:
|
(7) |
where
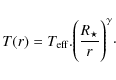
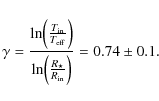
Using ![]() AU
(or 12.8
AU
(or 12.8 ![]() 2.5
2.5![]() )
and
)
and ![]() K,
we can determine the value of
K,
we can determine the value of ![]() for HD 62623's circumstellar disk. Using Eq. (4) with
for HD 62623's circumstellar disk. Using Eq. (4) with
![]() leads
to:
leads
to:
|
(8) |
This value of
![\begin{figure}
\par\includegraphics[width=0.9\textwidth,clip]{13640f17.ps}
\end{figure}](/articles/aa/full_html/2010/04/aa13640-09/img100.png)
|
Figure 11: A composite map of HD 62623's circumstellar environment in the N band from our MC3D + SIMECA model. |
| Open with DEXTER | |
6.3 Comparison with other A-type supergiants
HD 62623 is one of the coolest stars that exhibit the B[e] phenomenon. Actually, it is a member of the very rare A[e] supergiant class. A similar object has recently been discovered in the Small Magelenic Cloud by Kraus M. et al. (2008). Apart from the spectral features relative to the B[e] phenomenon exhibiting the presence of a highly illuminated gas and dust region, these stars seem to share the same properties as their ``normal'' counterparts.
Normal-A-Type supergiants are known to exhibit
radiation-driven stellar wind with a terminal velocity of several
hundred km s-1 and mass-loss between 10-8 ![]() and 10-6
and 10-6 ![]() (Achmad et al. 1997).
However, no dust has been found in the circumstellar environment of
these standard A-Type supergiants. As already discussed in the previous
section, this implies that the critical density of chemical elements
that can be involved in the dust formation (i.e., mainly Si, O, and C)
is reached too close to the star, where the temperature is still higher
than the sublimation limit. This is probably because the relatively
high wind terminal velocity is reached close to the central star.
Aufdenberg et al. (2002)
studied the mass-loss and radiative stellar wind of the A-supergiant
prototype Deneb. They approximated the wind velocity assuming:
(Achmad et al. 1997).
However, no dust has been found in the circumstellar environment of
these standard A-Type supergiants. As already discussed in the previous
section, this implies that the critical density of chemical elements
that can be involved in the dust formation (i.e., mainly Si, O, and C)
is reached too close to the star, where the temperature is still higher
than the sublimation limit. This is probably because the relatively
high wind terminal velocity is reached close to the central star.
Aufdenberg et al. (2002)
studied the mass-loss and radiative stellar wind of the A-supergiant
prototype Deneb. They approximated the wind velocity assuming:
|
(9) |
and found that
However, even if Deneb and HD 62623 have the same spectral
class (i.e., A2Ia), their physical parameters can be different enough
to affect the wind properties. For instance, Schiller &
Przybilla (2008)
derive a luminosity of ![]()
![]() for Deneb, thus about 12 times our estimation for
HD 62623. Remembering that the mass loss rate scales the
luminosity, this should imply a stronger wind for Deneb. But, in their
estimation the authors use a distance of 802 pc, while the one
derived from ``Hipparcos the New Reduction'' (van Leeuwen 2007) is
1.86 smaller (i.e.,
for Deneb, thus about 12 times our estimation for
HD 62623. Remembering that the mass loss rate scales the
luminosity, this should imply a stronger wind for Deneb. But, in their
estimation the authors use a distance of 802 pc, while the one
derived from ``Hipparcos the New Reduction'' (van Leeuwen 2007) is
1.86 smaller (i.e., ![]() pc).
Finally, using this latest estimation of the distance, we derived a
luminosity of
pc).
Finally, using this latest estimation of the distance, we derived a
luminosity of ![]()
![]() ,
closer to HD 62623 luminosity.
,
closer to HD 62623 luminosity.
Thus, we can still use Deneb's wind parameters as a rough
estimate for HD 62623. Consequently, at 12.8 ![]() ,
i.e. dust sublimation radius of HD 62623 determined by our
MIDI observation and MC3D modeling, the expansion velocity should be on
the order of 176 km s-1.
,
i.e. dust sublimation radius of HD 62623 determined by our
MIDI observation and MC3D modeling, the expansion velocity should be on
the order of 176 km s-1.
It is difficult to explain why HD 62623 is forming
dust in its circumstellar environment, while Deneb exhibits a purely
gaseous stellar wind. Among the putative explanations for such a
difference is a possible effect from to the stellar rotation. In the
bi-stability model developed by Lamers & Pauldrach (1991), the fast
rotation induces a strong opacity change in the wind between the pole
and the equator resulting in two distinct regions in the circumstellar
environment, i.e., a quickly expanding, low density polar wind and a
dense equatorial outflow with a lower terminal velocity. However, they
conclude that this mechanism is more efficient for stars with
15 000 K <
![]() < 30 000 K.
For lower temperature, the mass-loss rate is usually too low to reach
the optically thick wind near the equator unless the stars are almost
critical rotators.
< 30 000 K.
For lower temperature, the mass-loss rate is usually too low to reach
the optically thick wind near the equator unless the stars are almost
critical rotators.
In the case of HD 62623, considering that ![]() km s-1,
km s-1,
![]() ,
and 160 km s
-1
< vc
< 250 km s-1, the
rotational velocity
,
and 160 km s
-1
< vc
< 250 km s-1, the
rotational velocity ![]() ranged between 0.3 and 0.6 vc,
which is not high enough to reach the bi-stability limit and produce a
dense, optically thick equatorial region. Moreover, the efficiency of
the bi-stability model also increases with the luminosity as shown by
Pelupessy et al. (2000). For instance, for a
20 000 K star rotating at 60
ranged between 0.3 and 0.6 vc,
which is not high enough to reach the bi-stability limit and produce a
dense, optically thick equatorial region. Moreover, the efficiency of
the bi-stability model also increases with the luminosity as shown by
Pelupessy et al. (2000). For instance, for a
20 000 K star rotating at 60![]() of its critical velocity, the polar-to-equatorial density ratio
is 0.95 for
of its critical velocity, the polar-to-equatorial density ratio
is 0.95 for ![]() = 104.5
= 104.5 ![]() ,
while it decreases down to 0.21 for
,
while it decreases down to 0.21 for ![]() = 106.0
= 106.0 ![]() .
Finally, other phenomena have to be present to explain the differences
between a standard A-type supergiant and HD 62623.
.
Finally, other phenomena have to be present to explain the differences
between a standard A-type supergiant and HD 62623.
6.4 The putative binary nature of HD 62623
Studying the periodical variations of HD 62623's radial
velocity (137.7 or 161.1 days), Plets et al. (1995) found
evidence of the binarity for this star. They concluded that the system
is composed of a massive primary; i.e., ![]() or
or ![]() ,
and a low mass ratio of M2/M1=0.03
or M2/M1=0.15.
The estimation of the projected semi-major axis of the system is
1.6 AU < a
sin i < 2.4 AU.
Considering that the companion orbits in the equatorial plan of
HD 62623's primary, and using our estimation for the
inclination angle i = 60
,
and a low mass ratio of M2/M1=0.03
or M2/M1=0.15.
The estimation of the projected semi-major axis of the system is
1.6 AU < a
sin i < 2.4 AU.
Considering that the companion orbits in the equatorial plan of
HD 62623's primary, and using our estimation for the
inclination angle i = 60 ![]() 10
10![]() ,
we obtain a semi-major axis of
,
we obtain a semi-major axis of ![]() AU.
AU.
Finally, Plets et al. (1995) proposed a general scheme for HD 62623. The matter is probably ejected by the evolved massive primary stellar wind with typical terminal velocity of 80 km s-1. However, the matter located in the equatorial plane cannot reach this value since it is decelerated by the companion, finally forming a circumbinary disk. Thanks to this deceleration, the density in the equatorial plane could be 10 times higher than the typical density for a single A2I star stellar wind.
Binarity can be detected with interferometric techniques, and
recent VLTI/AMBER observations of the classical Be star ![]() Cen
by Meilland et al. (2008),
and VLTI/AMBER + VLTI/MIDI observations of the unclassified B[e]
HD 87643 by Millour et al. (2009) resulted in
the discovery of companions around these two stars. However,
HD 62623's companion cannot be detected in our VLTI/MIDI data
since the N band flux is fully dominated by the dusty disk
emission and because the projected separation between the two
components of the system is too small compared to the spatial
frequencies probed by the instrument.
Cen
by Meilland et al. (2008),
and VLTI/AMBER + VLTI/MIDI observations of the unclassified B[e]
HD 87643 by Millour et al. (2009) resulted in
the discovery of companions around these two stars. However,
HD 62623's companion cannot be detected in our VLTI/MIDI data
since the N band flux is fully dominated by the dusty disk
emission and because the projected separation between the two
components of the system is too small compared to the spatial
frequencies probed by the instrument.
Nevertheless, considering the stellar parameters determined by
Plets et al. (1995),
the luminosity of the central star is at least 14 times higher
than the companion's, since for ![]() and M2/M1=0.15,
we obtain
and M2/M1=0.15,
we obtain ![]() ,
and the companion spectral class is between B8III and B6V. Thus, it
would lead to visibility oscillations with a maximum amplitude of
2/14
,
and the companion spectral class is between B8III and B6V. Thus, it
would lead to visibility oscillations with a maximum amplitude of
2/14 ![]() 0.14
for the binary system assuming no envelope contribution. In the H
and K band, the envelope emission should
represent 20
0.14
for the binary system assuming no envelope contribution. In the H
and K band, the envelope emission should
represent 20![]() and 60
and 60![]() of the total flux, respectively. Thus, the oscillations should have a
maximum amplitude of 0.11 in the H band
and 0.056 in the K band and could
be detected, at least in the H band, with
the VLTI/AMBER.
of the total flux, respectively. Thus, the oscillations should have a
maximum amplitude of 0.11 in the H band
and 0.056 in the K band and could
be detected, at least in the H band, with
the VLTI/AMBER.
Finally, it is interesting to note that the putative companion is probably located inside the inner radius of the dusty circumstellar disk, as seen by the VLTI/MIDI instrument. The disk geometry determined using the MC3D code and our interferometric observations is thus compatible with Plets et al.'s (1995) scheme for HD 62623.
7 Conclusion
Thanks to these first VLTI/MIDI observations of HD 62623, we were not only able to determine the extension and flattening of a supergiant star showing the B[e] phenomenon, as already done by Domiciano de Souza et al. (2007) on CPD -57We have shown that the inner gaseous envelope likely acts as a
reprocessing disk. Since we detect residual visibilities for the
70 m baseline, it is also probable that the inner gaseous
envelope free-free N-band emission is not negligible and contributes to
10-20![]() of the total flux. However, other hypothesis like clumping within the
disk cannot be totally ruled out.
of the total flux. However, other hypothesis like clumping within the
disk cannot be totally ruled out.
How dust can form around this highly luminous (i.e.,
![]() )
star still remains unclear. Moreover, HD 62623 is one of the
few known A[e] supergiants, and it is hard to understand what the
differences are between this object and other stars with similar
spectral classes, such as Deneb, which only exhibits a moderate
radiatively driven stellar wind and no dust in its circumstellar
environment. Lamers & Pauldrach's (1997) bi-stability model
does not seem to accurately fit HD 62623 data since this star
is likely to have a moderate rotational velocity, i.e.
0.3<Vc<0.6.
)
star still remains unclear. Moreover, HD 62623 is one of the
few known A[e] supergiants, and it is hard to understand what the
differences are between this object and other stars with similar
spectral classes, such as Deneb, which only exhibits a moderate
radiatively driven stellar wind and no dust in its circumstellar
environment. Lamers & Pauldrach's (1997) bi-stability model
does not seem to accurately fit HD 62623 data since this star
is likely to have a moderate rotational velocity, i.e.
0.3<Vc<0.6.
Moreover, comparing the dusty disk's inner-rim extension ![]() AU
and Plets et al.'s (1995)
companion orbit estimation; i.e.,
1.6 AU < a.sin i < 2.4 AU,
we can conclude that a stellar wind deceleration by the companion's
gravitational effects remains the most favorable hypothesis.
AU
and Plets et al.'s (1995)
companion orbit estimation; i.e.,
1.6 AU < a.sin i < 2.4 AU,
we can conclude that a stellar wind deceleration by the companion's
gravitational effects remains the most favorable hypothesis.
However, to definitely rule out other possible explanations, we need to constrain both the geometry and kinematics of the inner gaseous envelope. As already shown for classical Be stars (Meilland et al. 2007a,b) and Herbig stars (Malbet et al. 2007; Kraus S. et al. 2008), spectrally resolved interferometry with the VLTI/AMBER instrument in medium (R=1500) or high (R=12 000) spectral resolution mode is the most suitable method for that purpose. New VLTI/MIDI observations with baselines longer than 70 m can also bring additional constraints on the gaseous environment geometry. Finally, as shown for Be stars by Meilland et al. (2007a, 2009) and Kervella et al. (2009), comparing N band VLTI/MIDI and H-K-band VLTI/AMBER measurements can add additional constraints on the physical parameters, for instance, the temperature and density of the gaseous environment.
AcknowledgementsThe Programme National de Physique Stellaire (PNPS) and the Institut National en Sciences de l'Univers (INSU) are acknowledged for their financial support. F. Millour & A. Meilland acknowledge financial support from the Max Planck Institut für Radioastronomy.
References
- Allen, C. W. 2000, Allen's Astrophysical Quantities, 15.3.1, 388 [Google Scholar]
- Allen, D. A. 1973, MNRAS, 161, 145 [NASA ADS] [Google Scholar]
- Bittar, J., Tuthill, P., Monnier, J. D., et al. 2001, A&A, 368, 197 [NASA ADS] [CrossRef] [EDP Sciences] [Google Scholar]
- Achmad, L., Lamers, H. J. G. L. M., & Pasquini, L. 1997, A&A, 320, 196 [NASA ADS] [Google Scholar]
- Aufdenberg, J. P., Hauschildt, P. H., Baron, E., et al. 2002, ApJ, 570, 344 [NASA ADS] [CrossRef] [Google Scholar]
- Draines, B. T., & Lee, H. M. 1984, ApJ, 285, 89 [Google Scholar]
- Castor, J. L., Abbott, D. C., & Klein, R. I. 1975, ApJ, 195, 157 [NASA ADS] [CrossRef] [Google Scholar]
- Cotton, W., Monnier, J., Baron, F., et al. 2008, SPIE, 7013, 1N [Google Scholar]
- Domiciano de Souza, A., Kervella, P., Jankov, S., et al. 2003, A&A, 407, L47 [NASA ADS] [CrossRef] [EDP Sciences] [Google Scholar]
- Dullemond, C. P., & Dominik, C. 2004, A&A, 417, 159 [NASA ADS] [CrossRef] [EDP Sciences] [Google Scholar]
- Dullemond, C. P., Dominik, C., & Natta, A. 2001, ApJ, 560, 957 [NASA ADS] [CrossRef] [Google Scholar]
- Hoffeit, D., & Jaschek, C. 1982, The Bright Star Catalogue, Yale University Obs. [Google Scholar]
- Kraus, M., Borges Fernandes, M., Kubát, J., & de Araújo, F. X. 2008, A&A, 487, 697 [NASA ADS] [CrossRef] [EDP Sciences] [Google Scholar]
- Kraus, S., Hofmann, K.-H., Benisty, M., et al. 2008, A&A, 489, 1157 [NASA ADS] [CrossRef] [EDP Sciences] [Google Scholar]
- Kervella, P., Domiciano de Souza, A., Kanaan, S., et al. 2009, A&A, 493, 53 [NASA ADS] [CrossRef] [EDP Sciences] [Google Scholar]
- Kurucz, R. L. 1979, ApJS, 40, 1 [NASA ADS] [CrossRef] [Google Scholar]
- Lambert, D. L., Hinkle, K. H., & Luck, R. E. 1988, ApJ, 333, 917 [NASA ADS] [CrossRef] [Google Scholar]
- Lamers, H. J. G. L. M., & Pauldrach, A. W. A. 1991, A&A, 244, L5 [NASA ADS] [Google Scholar]
- Lamers, H. J. G. L. M., Snow, T. P., & Lindholm, D. M. 1995, ApJ, 455, 269 [NASA ADS] [CrossRef] [Google Scholar]
- Lamers, H. J. G. L. M., Zickgraf, F.-J., de Winter, D., et al. 1998, A&A, 340, L117 [NASA ADS] [Google Scholar]
- Magalhaes, A. M. 1992, ApJ, 398, 286 [NASA ADS] [CrossRef] [Google Scholar]
- Malbet, F., Benisty, M., de Wit, W.-J., et al. 2007, A&A, 464, 43 [NASA ADS] [CrossRef] [EDP Sciences] [Google Scholar]
- Mathis, J. S., Rumpl, W., & Nordsieck, K. H. 1977, ApJ, 217, 425 [NASA ADS] [CrossRef] [Google Scholar]
- Meilland, A., Stee, P., Vannier, M., et al. 2007a, A&A, 464, 59 [Google Scholar]
- Meilland, A., Millour, F., Stee, Ph., et al. 2007b, A&A, 464, 73 [NASA ADS] [CrossRef] [EDP Sciences] [Google Scholar]
- Meilland, A., Millour, F., Stee, Ph., et al. 2008, A&A, 488, L67 [NASA ADS] [CrossRef] [EDP Sciences] [Google Scholar]
- Meilland, A., Stee, Ph., Chesneau, O., & Jones, C. 2009, A&A, 505, 687 [NASA ADS] [CrossRef] [EDP Sciences] [Google Scholar]
- Meynet, G., & Hauck, B. 1985, A&A, 150, 163 [NASA ADS] [Google Scholar]
- Millour, F., Chesneau, O., Borges Fernedes, M., et al. 2009, A&A, 507, 317 [NASA ADS] [CrossRef] [EDP Sciences] [Google Scholar]
- Miroshnichenko, A. S. 2007, ApJ, 667, 497 [NASA ADS] [CrossRef] [Google Scholar]
- Natta, A., Prusti, R., Wooden, D., et al. 2001, A&A, 371, 186 [NASA ADS] [CrossRef] [EDP Sciences] [Google Scholar]
- Pelupessi, I., Lamers, H. J. G. L. M., & Vink, J. S. 2000, A&A, 359, 695 [NASA ADS] [Google Scholar]
- Plets, H., Waelkens, C., & Trams, N. R. 1995, A&A, 293, 363 [NASA ADS] [Google Scholar]
- Schiller, F., & Przybilla, N. 2008, A&A, 479, 849 [NASA ADS] [CrossRef] [EDP Sciences] [Google Scholar]
- Shakura, N. I., & Sunyaev, R. A. 1973, A&A, 24, 337 [NASA ADS] [Google Scholar]
- Sobolev, V. V. 1960, Moving envelopes of stars (Harvard University Press) [Google Scholar]
- Stee, Ph. 1996, A&A, 311, 945 [NASA ADS] [Google Scholar]
- Stee, Ph., Bittar, J., & Lopez, B. 2004, ApJ, 602, 978 [NASA ADS] [CrossRef] [Google Scholar]
- Stee, Ph., Meilland, A., Berger, D., & Gies, D. 2005, ASPC, 337, 211 [NASA ADS] [Google Scholar]
- Tannirkulam, A., Harries, T. J., & Monnier, J. D. 2007, ApJ, 661, 374 [NASA ADS] [CrossRef] [Google Scholar]
- Thiébaut, E. 2008, SPIE, 7013, 1I [Google Scholar]
- van Leeuwen 2007, Hipparcos the New Reduction [Google Scholar]
- Wolf, S. 2003, Comp. Phys. Comm., 150, 99 [Google Scholar]
- Wolf, S., Henning, Th., & Stecklum, B. 1999, A&A, 349, 839 [NASA ADS] [Google Scholar]
- Wood, K., Wolff, M. J., Bjorkman, J. E., et al. 2002, ApJ, 564, 887 [NASA ADS] [CrossRef] [Google Scholar]
- Yudin, R. V., & Evans, A. 1998, A&AS, 131, 401 [NASA ADS] [CrossRef] [EDP Sciences] [Google Scholar]
- Zickgraf, F. J., Wolf, B., Stahl, O., et al. 1985, A&A, 143, 421 [NASA ADS] [Google Scholar]
Footnotes
- ... VLTI/MIDI
- Based on observations made with ESO Telescopes at Paranal Observatory under programs 078.D-O511 and 080.D.0181.
All Tables
Table 1: Stellar parameters from the fit of HD 62623 SED.
Table 2: VLTI/MIDI observations log of HD 62623 and its calibrators.
Table 3: Gaussian-disk equivalent FWHM for all baselines.
Table 4: Parameters of the best-fitted MC3D models.
Table 5: Parameter values for the SIMECA model.
All Figures
|
|
Figure 1:
Left: HD 62623 SED from various
sources of literature: red circles are flux measurements listed in
Bittar et al. (2001);
green lines, IRAS LRS spectra; dark blue lines, IUE spectra; light blue
lines with errors bars, our VLTI/MIDI measurements; and the dark line
is the best reddened Kurucz model, whose parameters are presented in
Table 1.
Right: zoom of the N band of the SED
(8-13 |
| Open with DEXTER | |
| In the text | |
|
|
Figure 2:
UV plane coverage obtained for HD 62623. The dotted line
represents the polarization angle measured by Yudin & Evans (1998). The circle
colors represent the two triplets of aligned baselines discussed in
Sect. 3: red for PA |
| Open with DEXTER | |
| In the text | |
|
|
Figure 3:
HD 62623 VLTI/MIDI calibrated visibilities for the nine
baselines from Fig. 2 plotted as a function of wavelength. The
dotted line corresponds to the central wavelength of the silicate band,
i.e., 9.6 |
| Open with DEXTER | |
| In the text | |
|
|
Figure 4:
HD 62623 VLTI/MIDI calibrated visibilities plotted as a function of
the spatial frequency |
| Open with DEXTER | |
| In the text | |
| |
Figure 5:
Best-fit model parameters and |
| Open with DEXTER | |
| In the text | |
| |
Figure 6: Typical radial and vertical density distribution for an equatorial wind ( left) and a Keplerian viscous disk ( right). |
| Open with DEXTER | |
| In the text | |
|
|
Figure 7:
From left to right: 8.2, 9.9, and 13.1 |
| Open with DEXTER | |
| In the text | |
|
|
Figure 8: Fit of the nine visibility measurements ( top) and SED ( bottom) of the best equatorial wind model ( left) and Keplerian viscous disk model ( right). The dotted lines correspond to the models and the errors bars to the data. |
| Open with DEXTER | |
| In the text | |
|
|
Figure 9:
Left: visibility plotted as a function of the
spatial frequency for several random clump distributions (colored solid
lines) with |
| Open with DEXTER | |
| In the text | |
|
|
Figure 10:
Left: visibility plotted as a function of the
spatial frequency for the SIMECA + MC3D model with parameters from
Table 5.
Right: corresponding 8 |
| Open with DEXTER | |
| In the text | |
|
|
Figure 11: A composite map of HD 62623's circumstellar environment in the N band from our MC3D + SIMECA model. |
| Open with DEXTER | |
| In the text | |
Copyright ESO 2010
Current usage metrics show cumulative count of Article Views (full-text article views including HTML views, PDF and ePub downloads, according to the available data) and Abstracts Views on Vision4Press platform.
Data correspond to usage on the plateform after 2015. The current usage metrics is available 48-96 hours after online publication and is updated daily on week days.
Initial download of the metrics may take a while.