| Issue |
A&A
Volume 517, July 2010
|
|
|---|---|---|
| Article Number | A87 | |
| Number of page(s) | 17 | |
| Section | Interstellar and circumstellar matter | |
| DOI | https://doi.org/10.1051/0004-6361/200911849 | |
| Published online | 13 August 2010 | |
Spatially resolved detection of crystallized water ice in a T Tauri
object![[*]](/icons/foot_motif.png) ,
,
A. A. Schegerer 1,2 - S. Wolf3
1 - Helmholtz Zentrum München, German Research Center for
Environmental Health, Ingolstädter Landstraße 1,
85758 Neuherberg,
Germany
2 - Max-Planck-Institut für Astronomie, Königstuhl 17, 69117
Heidelberg, Germany
3 - Universität Kiel, Institut
für Theoretische Physik und Astrophysik, Leibnizstraße 15, 24098
Kiel, Germany
Received 15 February 2009 / Accepted 29 April 2010
Abstract
Aims. We search for frozen water and its processing around
young stellar objects (YSOs of class I/II). We try to detect
potential, regional differences in water ice evolution within YSOs,
which is relevant to understanding the chemical structure of the
progenitors of protoplanetary systems and the evolution of solid
materials. Water plays an important role as a reaction bed for rich
chemistry and is an indispensable requirement for life as known on
Earth.
Methods. We present our analysis of NAOS-CONICA/VLT spectroscopy of water ice at 3 ![]() m for the T Tauri star YLW 16 A in the
m for the T Tauri star YLW 16 A in the ![]() Ophiuchi
molecular cloud. We obtained spectra for different regions of the
circumstellar environment. The observed absorption profiles are
deconvolved with the mass extinction profiles of amorphous and
crystallized ice measured in laboratory. We take into account both
absorption and scattering by ice grains.
Ophiuchi
molecular cloud. We obtained spectra for different regions of the
circumstellar environment. The observed absorption profiles are
deconvolved with the mass extinction profiles of amorphous and
crystallized ice measured in laboratory. We take into account both
absorption and scattering by ice grains.
Results. Water ice in YLW16A is detected with optical depths of between ![]() and
and ![]() .
The profiles that are measured can be fitted predominantly by the extinction profiles of small grains (0.1
.
The profiles that are measured can be fitted predominantly by the extinction profiles of small grains (0.1 ![]() m-0.3
m-0.3 ![]() m)
with a small contribution from large grains (<10%). However, an
unambiguous trace of grain growth cannot be found. We detected
crystallized water ice spectra that have their origin in different
regions of the circumstellar environment of the T Tauri star
YLW 16 A. The crystallinity increases in the upper layers of
the circumstellar disk, while only amorphous grains exist in the
bipolar envelope. As in studies of silicate grains in T Tauri
objects, the higher crystallinity in the upper layers of the outer disk
regions implies that water ice crystallizes and remains crystallized
close to the disk atmosphere where water ice is shielded against hard
irradiation.
m)
with a small contribution from large grains (<10%). However, an
unambiguous trace of grain growth cannot be found. We detected
crystallized water ice spectra that have their origin in different
regions of the circumstellar environment of the T Tauri star
YLW 16 A. The crystallinity increases in the upper layers of
the circumstellar disk, while only amorphous grains exist in the
bipolar envelope. As in studies of silicate grains in T Tauri
objects, the higher crystallinity in the upper layers of the outer disk
regions implies that water ice crystallizes and remains crystallized
close to the disk atmosphere where water ice is shielded against hard
irradiation.
Key words: infrared: stars - accretion, accretion disks - astrobiology
1 Introduction
The importance of water (ice) to protoplanetary systems is justified by the following properties: liquid water is a proper solvent for many minerals and organic molecules and allows the formation of complex organic molecules. Water is the reaction bed for the photochemical synthesis of both aromatic compounds (Bernstein et al. 2002) and amino acids (Munoz Caro et al. 2002), even in its solid state. Therefore, rich deposits of water (ice) in protoplanetary disks are assumed to be a requirement for the formation of life as known on Earth. The importance of water ice is in addition emphasized by the assumption that ice planets, such as Neptune, form outside the snowline where water condenses on dust grains. The mass fraction of solid matter in protoplanetary disks abruptly increases at the snowline at least by one order of magnitude (Stevenson & Lunine1988).
The water ice band at
![]() ,
which is caused by a
vibrational excitation of the OH bond in the water molecule, was
primarily discovered in the envelopes of numerous deeply embedded
protostars (Gillett & Forrest 1973; Gillett et al. 1975; Merrill et al. 1976). Frozen water that can
be found in
dust particles is the most frequent ice molecule in YSOs
(Ehrenfreund et al. 1996)
,
which is caused by a
vibrational excitation of the OH bond in the water molecule, was
primarily discovered in the envelopes of numerous deeply embedded
protostars (Gillett & Forrest 1973; Gillett et al. 1975; Merrill et al. 1976). Frozen water that can
be found in
dust particles is the most frequent ice molecule in YSOs
(Ehrenfreund et al. 1996)![]() . The huge water ice deposit results
from its molecular
property: in contrast to nonpolar, volatile ice molecules,
such as CO, CO
. The huge water ice deposit results
from its molecular
property: in contrast to nonpolar, volatile ice molecules,
such as CO, CO![]() ,
N
,
N![]() ,
and O
,
and O![]() ice,
H
ice,
H![]() O ice has a high sublimation temperature of
O ice has a high sublimation temperature of
![]()
![]() depending on the ambient pressure
(Davis 2007). The polarity of the water molecule is
responsible for its stable adsorption by condensation seeds such as silicate
dust grains. Cosmic irradiation and chemical reactions could force the
evaporation of water ice (Léger et al. 1985; Hartquist &
Wolf 1990). However, these reactions are impeded by
regions with strong shielding and low temperatures
(Tielens &
Hagen 1982). This is why the water ice band is
commonly observed in the spectra of deeply embedded protostars
(Boogert et al. 2004). However, it is assumed that larger deposits
of water ice exist in the optically
thick regions of circumstellar disks (Fig. 1 in Chiang et
al. 2001). This assumption may be supported by the
detection of the water ice band at
depending on the ambient pressure
(Davis 2007). The polarity of the water molecule is
responsible for its stable adsorption by condensation seeds such as silicate
dust grains. Cosmic irradiation and chemical reactions could force the
evaporation of water ice (Léger et al. 1985; Hartquist &
Wolf 1990). However, these reactions are impeded by
regions with strong shielding and low temperatures
(Tielens &
Hagen 1982). This is why the water ice band is
commonly observed in the spectra of deeply embedded protostars
(Boogert et al. 2004). However, it is assumed that larger deposits
of water ice exist in the optically
thick regions of circumstellar disks (Fig. 1 in Chiang et
al. 2001). This assumption may be supported by the
detection of the water ice band at
![]() (Creech-Eakman et al. 2002) and
(Creech-Eakman et al. 2002) and
![]() (Leinert et al. 2001; Terada et al. 2007) in
the spectra of several T Tauri objects.
(Leinert et al. 2001; Terada et al. 2007) in
the spectra of several T Tauri objects.
The water ice band at
![]() in L band
in L band![]() is assumed
to be an excellent indicator of
the evolutionary status of circumstellar disks (van de
Bult 1985). In a protostellar molecular cloud, water ice has
a primarily amorphous structure, as many previous studies have shown (e.g., Thi et al. 2006; Pontoppidan et al. 2005). As soon as the temperature exceeds a level of
is assumed
to be an excellent indicator of
the evolutionary status of circumstellar disks (van de
Bult 1985). In a protostellar molecular cloud, water ice has
a primarily amorphous structure, as many previous studies have shown (e.g., Thi et al. 2006; Pontoppidan et al. 2005). As soon as the temperature exceeds a level of ![]()
![]() ,
water ice begins to crystallize (Hagen et al. 1981a). This conversion can
be detected by monitoring the profile of the optical depth, i.e., the logarithm of the
absorption band: as the
crystallinity increases, the profile narrows and its maximum
shifts to longer wavelengths (e.g., Smith et al. 1989). But the crystalline structure can also be destroyed, e.g., by
hard irradiation (Kouchi &
Kuroda 1990). In addition to crystallization, grain growth of ice particles can be inferred from a modification of the optical depth
profile. An increase in the dust grain radius results in a
higher scattering efficiency, a broadening of the absorption band
at long wavelengths, and a shift of the maximum to longer
wavelengths. These changes are comparable to those related to the prominent
,
water ice begins to crystallize (Hagen et al. 1981a). This conversion can
be detected by monitoring the profile of the optical depth, i.e., the logarithm of the
absorption band: as the
crystallinity increases, the profile narrows and its maximum
shifts to longer wavelengths (e.g., Smith et al. 1989). But the crystalline structure can also be destroyed, e.g., by
hard irradiation (Kouchi &
Kuroda 1990). In addition to crystallization, grain growth of ice particles can be inferred from a modification of the optical depth
profile. An increase in the dust grain radius results in a
higher scattering efficiency, a broadening of the absorption band
at long wavelengths, and a shift of the maximum to longer
wavelengths. These changes are comparable to those related to the prominent
![]() silicate band (e.g., Bouwman et al. 2001), but the origin of the spectral bands is
different. While the emission band of silicate has its origin in the
warm disk atmosphere, the absorption band of water ice originates in
more embedded, cold regions closer to the disk midplane and far from the
central star.
silicate band (e.g., Bouwman et al. 2001), but the origin of the spectral bands is
different. While the emission band of silicate has its origin in the
warm disk atmosphere, the absorption band of water ice originates in
more embedded, cold regions closer to the disk midplane and far from the
central star.
The water ice band interferes with absorption bands of additional
materials that are dissolved in water ice or form a complex
compound with the water molecule: ammonia hydrate
H![]() O.NH
O.NH![]() (minimum at
(minimum at
![]() :
Merrill et al. 1976; Mukai et al. 1986; Dartois &
d'Hendecourt 2001), ammonia NH
:
Merrill et al. 1976; Mukai et al. 1986; Dartois &
d'Hendecourt 2001), ammonia NH![]() (
(
![]() :
d'Hendecourt et al. 1985; Dartois &
d'Hendecourt 1985), methanol CH
:
d'Hendecourt et al. 1985; Dartois &
d'Hendecourt 1985), methanol CH![]() OH
(
OH
(
![]() :
Dartois et al. 2001),
hydrocarbons with the vibrational excitations of the CH,
CH
:
Dartois et al. 2001),
hydrocarbons with the vibrational excitations of the CH,
CH![]() ,
and CH
,
and CH![]() bond (
bond (
![]() ,
,
![]() ,
and
,
and
![]() :
Duley &
Williams 1984; Chiar et al. 2002), and other chemical
compounds (Ehrenfreund et al. 1996). The
absorption bands of these molecules are narrow and interfere predominantly
with the water ice band at longer wavelengths around
:
Duley &
Williams 1984; Chiar et al. 2002), and other chemical
compounds (Ehrenfreund et al. 1996). The
absorption bands of these molecules are narrow and interfere predominantly
with the water ice band at longer wavelengths around
![]() .
They can
therefore be distinguished from the water ice band. To study the chemical
evaluation of ices in solar-mass systems, a survey in the infrared
wavelength range where 41 low-luminosity YSOs were included was
conducted by using the infrared spectrograph on the Spitzer
Space Telescope (Boogert et al. 2008).
.
They can
therefore be distinguished from the water ice band. To study the chemical
evaluation of ices in solar-mass systems, a survey in the infrared
wavelength range where 41 low-luminosity YSOs were included was
conducted by using the infrared spectrograph on the Spitzer
Space Telescope (Boogert et al. 2008).
Table 1: Overview of our observations with NAOS-CONICA.
The scientific scope of this study is to look for spatial variations in the water ice band profile at
![]() within a T Tauri star to detect possible, regional differences in water ice evolution. In
Sects. 2 and 3, we
scrutinize in detail our spectroscopic observations and data
reduction, respectively. The derived water ice profiles are presented in
Sect. 4. The ice profiles that could be derived are
analyzed in Sect. 5.2 by considering both the
absorption profiles of ice grains of different size and
crystallization degree that are measured in laboratory. This
well-established approach of deconvolution is described
in Sect. 5.1. The question of whether evolved, i.e., large and/or crystyllized ice grains may finally be found is discussed in
Sects. 5.3 and 5.4. We
conclude this study with a summary in Sect. 6.
within a T Tauri star to detect possible, regional differences in water ice evolution. In
Sects. 2 and 3, we
scrutinize in detail our spectroscopic observations and data
reduction, respectively. The derived water ice profiles are presented in
Sect. 4. The ice profiles that could be derived are
analyzed in Sect. 5.2 by considering both the
absorption profiles of ice grains of different size and
crystallization degree that are measured in laboratory. This
well-established approach of deconvolution is described
in Sect. 5.1. The question of whether evolved, i.e., large and/or crystyllized ice grains may finally be found is discussed in
Sects. 5.3 and 5.4. We
conclude this study with a summary in Sect. 6.
2 Observations
Our observations with the near-infrared (NIR) spectrometer CONICA (Lenzen et al. 2003) were performed at the
![]() YEPUN telescope of the Very Large Telescope (VLT) in spring and
summer 2006. We used the L54_1_SL mode where a wavelength range of
between
YEPUN telescope of the Very Large Telescope (VLT) in spring and
summer 2006. We used the L54_1_SL mode where a wavelength range of
between
![]() and
and
![]() is covered. Observations
with CONICA are
supported by the adaptive optics NAOS (Rousset et al. 2003).
A linear, spectral dispersion of
is covered. Observations
with CONICA are
supported by the adaptive optics NAOS (Rousset et al. 2003).
A linear, spectral dispersion of
![]() could be
reached. The spatial resolution that could theoretically be reached
was 0.054
could be
reached. The spatial resolution that could theoretically be reached
was 0.054
![]() .
Depending on the weather conditions during our
observations, the pixel scale was
.
Depending on the weather conditions during our
observations, the pixel scale was ![]() 0.12
0.12
![]() .
The slit of the
spectrometer had a width of 0.172
.
The slit of the
spectrometer had a width of 0.172
![]() and a length of
28
and a length of
28
![]() .
.
We selected YSOs with quasi edge-on disks to be able to
observe optically thick regions that shield
ice from hard irradiation. Images, polarimetric maps, and previous object
models were used as selection criteria. A visual extinction of
![]() is
sufficient for an effective shielding of water ice against irradiation
(Murakawa et al. 2000).
is
sufficient for an effective shielding of water ice against irradiation
(Murakawa et al. 2000).
A lunar occultation observation of YLW 16 A at
![]() (Simon et al. 1987) showed that the object is a single extended source and strongly inclined. Two brightness peaks are separated by
(Simon et al. 1987) showed that the object is a single extended source and strongly inclined. Two brightness peaks are separated by ![]() 0.5
0.5
![]() in a K band image
obtained by NICMOS at the Hubble Space Telescope (HST; Allen et al. 2002). These peaks are assigned to the optically thin bipolar
envelope.
in a K band image
obtained by NICMOS at the Hubble Space Telescope (HST; Allen et al. 2002). These peaks are assigned to the optically thin bipolar
envelope.
Table 1 provides an overview of our observations of the target YLW 16 A and the corresponding standard star HR 6070. The brightness of the standard star, an A 0 V star, is known from the standard star catalog of van Bliek et al. (1996). For the preparation of the observations, the L band brightness of the target was estimated in this study by considering the H band magnitudes and the (H-K) and (K-N) colors of additional YSOs of the same star-forming region (Allen et al. 2002).
Our target was observed using the nodding mode with a nodding angle
of 10
![]() .
Thus, the target was successively
observed in different detector areas where the sky background could be
eliminated by subtracting subsequent exposures.
The chopping mode, which provides a more effective
elimination of short-term variations in the sky, was not available in
the observation mode used.
.
Thus, the target was successively
observed in different detector areas where the sky background could be
eliminated by subtracting subsequent exposures.
The chopping mode, which provides a more effective
elimination of short-term variations in the sky, was not available in
the observation mode used.
The target was observed twice, with two orthogonal
orientations of the slit. The observation sequence started with a slit
orientation parallel to the rotational axis of the object (position:
p-parallel). In a second
exposure, the slit was rotated by
![]() (position: o-orthogonal). The
photometric center served as a rotation center. This procedure is
assumed to allow the determination of the spatial
distribution of water ice in the different regions of the circumstellar
environment.
(position: o-orthogonal). The
photometric center served as a rotation center. This procedure is
assumed to allow the determination of the spatial
distribution of water ice in the different regions of the circumstellar
environment.
In the appendix of this publication, we list additional observations of
YSOs within this program. These YSOs also belong to the ![]() Ophiuchi region.
Ophiuchi region.
3 Data reduction
When reducing the spectroscopic data obtained with NAOS-CONICA, particular problems have to be taken into account. The specific steps of the reduction are therefore considered in detail:
- 1.
- Bad pixels are localized and replaced by the median
of the pixels within the surrounding
 detector segment.
- 2.
- The background of detector, telescope, and sky are eliminated by the subtraction of successive exposures for different nodding positions. Owing to unavailability of the chopping mode that can clear short-term variations in the sky, telluric features cannot be completely removed in the object spectra. The resulting images are flatfielded.
- 3.
- The spatial and spectral dimensions of a spectroscopic
exposure are
assigned to the rows and columns of the image matrix,
respectively, to a first
approximation. A Gaussian function is fitted to each row of the
array to determine the maximum of the spatial intensity
distribution. The counting rates of the pixels within
 (full width at half maximum) of
each Gaussian function are added. Alternatively,
the Gaussian functions are divided into seven single intervals resulting in
spatially
adjacent spectra. For a pixel scale of
0.12
(full width at half maximum) of
each Gaussian function are added. Alternatively,
the Gaussian functions are divided into seven single intervals resulting in
spatially
adjacent spectra. For a pixel scale of
0.12
 and the source distance of
 ,
the single intervals have widths of about
,
the single intervals have widths of about
 ,
,
,
,
 ,
and
,
and
 ,
respectively, symmetrically
arranged of increasing
width at increasing distance from the brightness maximum. The
interval of the central region has a width of
,
the
intervals of the outermost regions have widths of
.
,
respectively, symmetrically
arranged of increasing
width at increasing distance from the brightness maximum. The
interval of the central region has a width of
,
the
intervals of the outermost regions have widths of
.
- 4.
- The wavelength calibration of the L band spectra acquired with
NAOS-CONICA is difficult because observations of specific calibration lamps
could not be performed in this observing mode. Intrinsic stellar emission lines
such as the Pf
 -line at
 (Wallace &
Hinkle 2002) do not clearly emerge from the background
noise. Therefore, the measured spectra were cross-correlated with the
telluric features of a sky spectrum obtained from
NSF/NOAO.
As the shapes of the asymmetrically curved telluric lines are not known,
the accuracy of the wavelength calibration cannot be better than
the accuracy provided by a pixel width.
(Wallace &
Hinkle 2002) do not clearly emerge from the background
noise. Therefore, the measured spectra were cross-correlated with the
telluric features of a sky spectrum obtained from
NSF/NOAO.
As the shapes of the asymmetrically curved telluric lines are not known,
the accuracy of the wavelength calibration cannot be better than
the accuracy provided by a pixel width.
- 5.
- To perform subsequent flux calibration, the standard star HR 6070 was
observed in the immediate
vicinity (
 1
1 ), directly before or after the observation of the target. This ensured that instrumental and
the atmospheric transmission could be determined, simultaneously. The
division by a black-body function
), directly before or after the observation of the target. This ensured that instrumental and
the atmospheric transmission could be determined, simultaneously. The
division by a black-body function
 with
with
 for
HR 6070 (Allen 2000) helps to reduce the influence of the
continuum of the standard star. Considering the template spectrum
of an F 0 V star in L band (Rayner et al. 2009), the
template spectrum of an A 0 V star up to
for
HR 6070 (Allen 2000) helps to reduce the influence of the
continuum of the standard star. Considering the template spectrum
of an F 0 V star in L band (Rayner et al. 2009), the
template spectrum of an A 0 V star up to
 (Pickles 1998) and the amplitude of the
absorption depth of the water ice feature, potential stellar
lines are assumed to be neglected, i.e., we do not correct for
potential absorption lines in the spectrum of
HR 6070. Figure 1
presents the normalized transmission of sky and instrument that were
obtained from the observation of the standard star HR 6070. Spectral
shifts of the standard star spectra on a sub-pixel scale allowed an improved
elimination of the telluric lines in the spectrum of the target. To remove atmospheric residuals and
data points affected by poor atmospheric transmission, sections of the
spectra with less than 35% transmission are not considered in the
analysis. These vary from
exposure to exposure depending on weather conditions.
(Pickles 1998) and the amplitude of the
absorption depth of the water ice feature, potential stellar
lines are assumed to be neglected, i.e., we do not correct for
potential absorption lines in the spectrum of
HR 6070. Figure 1
presents the normalized transmission of sky and instrument that were
obtained from the observation of the standard star HR 6070. Spectral
shifts of the standard star spectra on a sub-pixel scale allowed an improved
elimination of the telluric lines in the spectrum of the target. To remove atmospheric residuals and
data points affected by poor atmospheric transmission, sections of the
spectra with less than 35% transmission are not considered in the
analysis. These vary from
exposure to exposure depending on weather conditions.
- 6.
- By considering the photometric L' band spectra and the filter
curves that were formerly used to perform the photometric measurements of the standard star (van Bliek et al. 1996), a photometric flux calibration of the observed spectra of the target is
possible. We note that the resulting scale
factor of the photometric calibration can vary by more than 15% during a night
(Przygodda 2004).
![\begin{figure}
\par\includegraphics[width=8.5cm,clip]{figure/004fig01.ps}
\end{figure}](/articles/aa/full_html/2010/09/aa11849-09/img72.png)
|
Figure 1: Transmission of atmosphere and instrument derived from the spectrum of the standard star HR 6070. |
| Open with DEXTER | |
4 Results
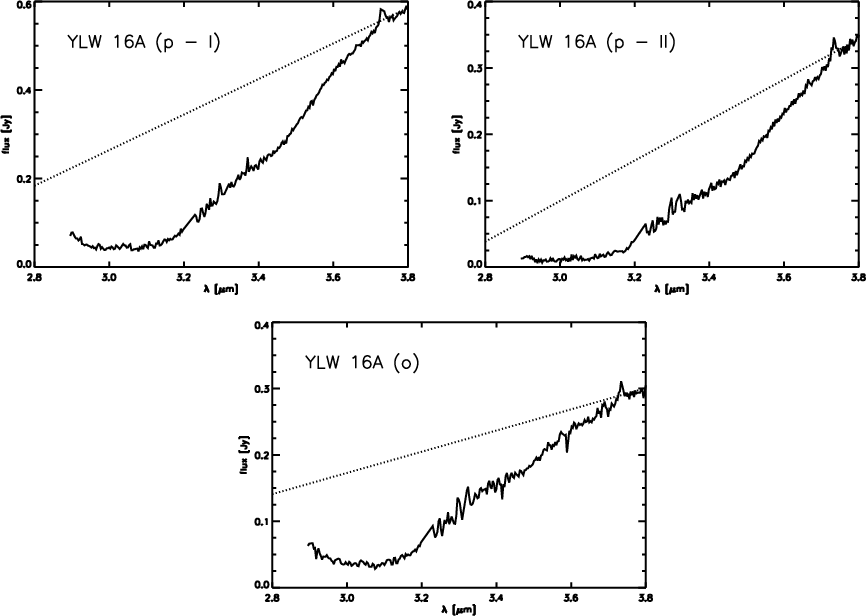
Figure 2 shows the resulting L band
spectra of the target for which the counting rates of
![]() of the spectrum were determined
(Sect. 3). To provide spatial
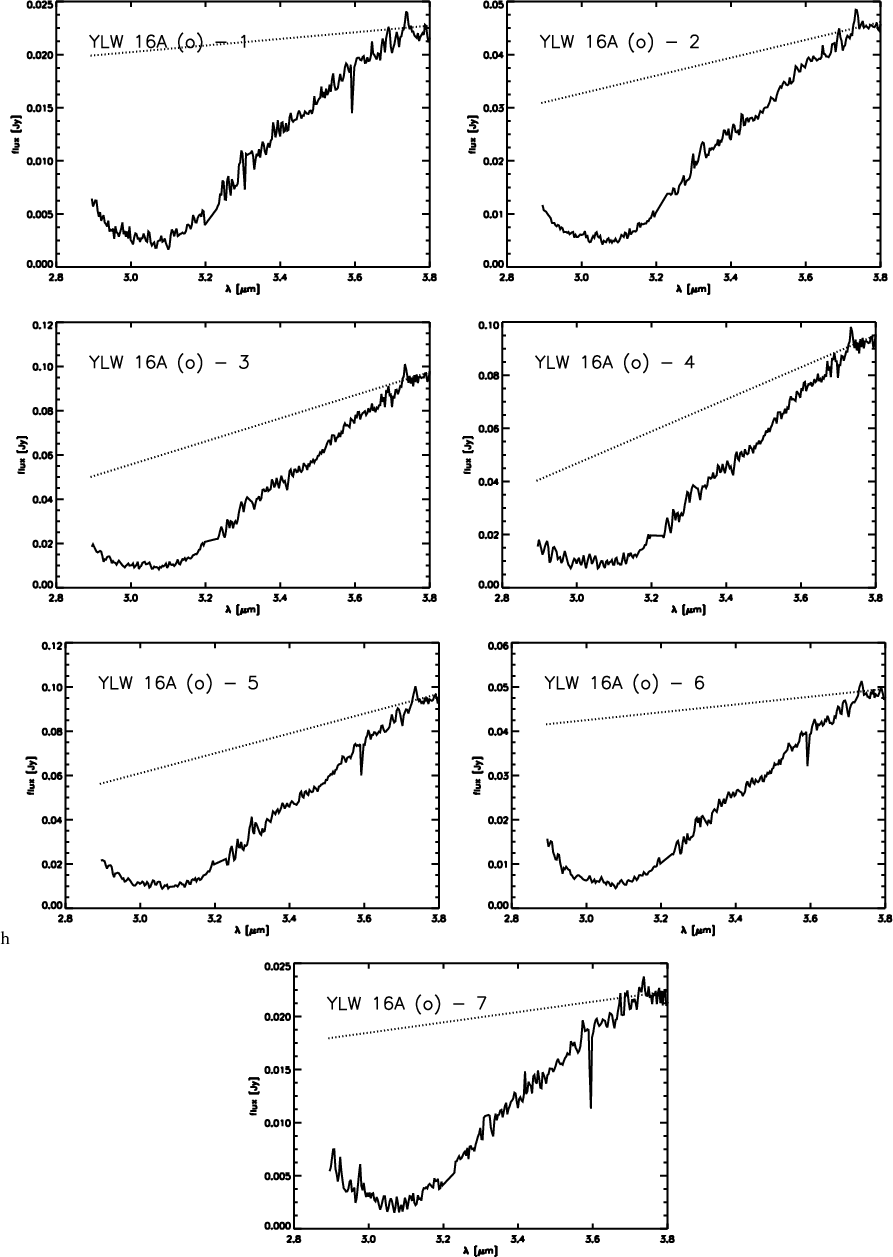
information, Fig. 3 shows the spectra
derived from seven spatially adjacent stripes of the total spectra measured in orthogonal
orientations. Spectra 1 to 7 represent spectra derived from
source regions with projected widths of
of the spectrum were determined
(Sect. 3). To provide spatial
information, Fig. 3 shows the spectra
derived from seven spatially adjacent stripes of the total spectra measured in orthogonal
orientations. Spectra 1 to 7 represent spectra derived from
source regions with projected widths of
![]() ,
,
![]() ,
,
![]() ,
,
![]() ,
,
![]() ,
,
![]() ,
and
,
and
![]() ,
respectively.
,
respectively.
|
Figure 2:
Extracted and photometrically calibrated L band spectra of the
source YLW 16 A for slit orientations parallel and orthogonal to
its rotational axis. The counting rates of
|
| Open with DEXTER | |
The NICMOS/HST-images of the class-I-object YLW 16 A exhibit a bipolar envelope above and below its circumstellar disk (Allen et al. 2002). Both bipolar components yield two separate spectra I and II in the (p)-orientation of the slit.
The photometric flux can be
compared to photometric measurements of the Infrared Array Camera (IRAC)
onboard of the Spitzer
satellite. We perform photometry on the pipeline mosaic available at the
Spitzer
archive![]() .
The photometric
calibration of IRAC is based on an aperture whose radius is set to be 10 pixels. The flux amounts to
.
The photometric
calibration of IRAC is based on an aperture whose radius is set to be 10 pixels. The flux amounts to
![]() at
at
![]() after
background subtraction.
In contrast to NAOS-CONICA, IRAC does
not allow us to spatially resolve the geometrical structure of
YLW 16 A. Therefore, the different spatial resolution powers of IRAC and NAOS-CONICA
explain the differences between the L band fluxes.
after
background subtraction.
In contrast to NAOS-CONICA, IRAC does
not allow us to spatially resolve the geometrical structure of
YLW 16 A. Therefore, the different spatial resolution powers of IRAC and NAOS-CONICA
explain the differences between the L band fluxes.
All spectra derived from our NAOS-CONICA observations display the
broad water-ice band absorption feature with its minimum at ![]()
![]() .
As the atmospheric transmission is low at wavelengths of
<
.
As the atmospheric transmission is low at wavelengths of
<
![]() (Fig. 1), the water
ice feature is truncated at this lower wavelength end of the spectra.
(Fig. 1), the water
ice feature is truncated at this lower wavelength end of the spectra.
|
Figure 3:
Extracted and photometrically calibrated L band spectra of YLW 16 A
derived from seven spatially adjacent stripes cut from the
acquired
spectra. The spectra 1 to 7 represent spectra derived from
source regions of widths
|
| Open with DEXTER | |
5 Modeling of the water ice band
5.1 Modeling approach
By definition, the depth of the absorption band is the natural
logarithm of the ratio of the
measured flux
![]() to the continuum flux
to the continuum flux
![]() above the absorption band. It depends on the path L through the
absorbing material, its (mean) extinction
above the absorption band. It depends on the path L through the
absorbing material, its (mean) extinction
![]() ,
and the particle density
,
and the particle density ![]() .
Whittet (2002)
derived the optical depth
.
Whittet (2002)
derived the optical depth ![]() of spherical particles with a mean radius
a and a mean material
density
of spherical particles with a mean radius
a and a mean material
density ![]() to be
to be

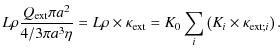
The quantity
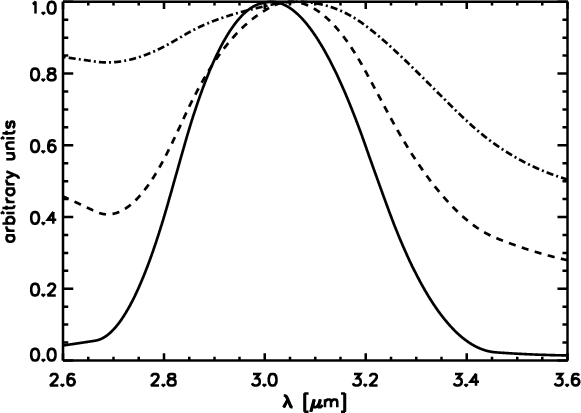
| Figure 4:
Normalized extinction profiles
|
|
| Open with DEXTER | |
To determine the ice components that effectively contribute to the
![]() -absorption band, extinction profiles of ice grains of
different size and crystallinity are linearly combined to fit the
ice profile. As a first approximation, scattering effects can
only be neglected if the condition
-absorption band, extinction profiles of ice grains of
different size and crystallinity are linearly combined to fit the
ice profile. As a first approximation, scattering effects can
only be neglected if the condition
is fulfilled (Dartois et al. 2001), where the quantity |m| is the complex refractive index. For
For our fitting routine, we assume opacities of entirely amorphous
(
![]() )
and crystallized (
)
and crystallized (
![]() )
water ice. The
ice grain radii a are
)
water ice. The
ice grain radii a are
![]() ,
,
![]() ,
,
![]() ,
,
![]() ,
and
,
and
![]() .
In this study, grains with
.
In this study, grains with
![]() and
and
![]() are called large and small grains,
respectively. A restriction to two grain radii (e.g.,
are called large and small grains,
respectively. A restriction to two grain radii (e.g.,
![]() and
and
![]() )
only increases the deviation
between model and measurement but does not modify the resulting mass ratios Ki. Figure 4 shows the mass
extinction
)
only increases the deviation
between model and measurement but does not modify the resulting mass ratios Ki. Figure 4 shows the mass
extinction
![]() of
amorphous and crystallized water ice used in our fitting approach
(Eq. (1)). Assuming spherical, compact ice
particles, the mass
extinction curves are derived using the program MIEX (Wolf &
Voshchinnikov 2004), which is based on Mie scattering. This program
calculates the extinction profiles by considering the
grain size and refractive indices (Schmitt et al. 1998;
Dartois & d'Hendecourt 2001).
of
amorphous and crystallized water ice used in our fitting approach
(Eq. (1)). Assuming spherical, compact ice
particles, the mass
extinction curves are derived using the program MIEX (Wolf &
Voshchinnikov 2004), which is based on Mie scattering. This program
calculates the extinction profiles by considering the
grain size and refractive indices (Schmitt et al. 1998;
Dartois & d'Hendecourt 2001).
|
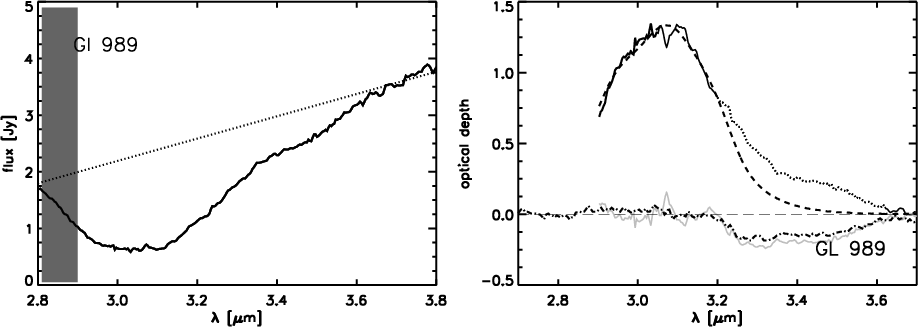
Figure 5:
Left panel: L band spectrum of the object GL 989 measured with the ISO satellite. Because of the lower
transmission of the sky, the spectral interval at short wavelengths that
is indicated by gray color is difficult to observe using
NAOS-CONICA or any
other instrument on the ground because of the lower transmission of the sky. The
dotted line represents the likely
linear continuum. |
| Open with DEXTER | |
An unambigous determination of the continuum flux
![]() above the
absorption band is difficult. Owing to reduced atmospheric transmission
(Fig. 1), parts of the spectra at
short-wavelengths are missing. The determination of the continuum at
longer wavelengths (>
above the
absorption band is difficult. Owing to reduced atmospheric transmission
(Fig. 1), parts of the spectra at
short-wavelengths are missing. The determination of the continuum at
longer wavelengths (>
![]() )
is also difficult because some
telluric lines could not be removed entirely during data reduction, producing
noisy spectra. In previous
investigations of the water ice band (Thi et al. 2006;
Dartois et al. 2002; Boogert et al. 2008), a Planck
function
)
is also difficult because some
telluric lines could not be removed entirely during data reduction, producing
noisy spectra. In previous
investigations of the water ice band (Thi et al. 2006;
Dartois et al. 2002; Boogert et al. 2008), a Planck
function
![]() or a spline function was
fitted to the continuum and - if available - to photometric data
points in adjacent spectral bands to determine the continuum. In
addition, studies were performed where
the spectral energy distribution of the entire
infrared wavelength range was fitted using disk models (Pontoppidan
et al. 2004). Assuming a spatial resolution of
0.12
or a spline function was
fitted to the continuum and - if available - to photometric data
points in adjacent spectral bands to determine the continuum. In
addition, studies were performed where
the spectral energy distribution of the entire
infrared wavelength range was fitted using disk models (Pontoppidan
et al. 2004). Assuming a spatial resolution of
0.12
![]() (
(![]()
![]() )
for our NAOS-CONICA observations, which is smaller than the true spatial
extension of the object, only a fraction of the total flux of the
disk is
detected. Therefore, when comparing with IRAS observations (Sect. 4),
photometric measurements do not have to represent the absolute
level of the L band spectra measured with NAOS-CONICA.
)
for our NAOS-CONICA observations, which is smaller than the true spatial
extension of the object, only a fraction of the total flux of the
disk is
detected. Therefore, when comparing with IRAS observations (Sect. 4),
photometric measurements do not have to represent the absolute
level of the L band spectra measured with NAOS-CONICA.
Apart from either the Planck function
![]() or a spline function, we
use a straight line to determine the
continuum. The straight line is rotated successively around
different spectral points resulting in different optical depths
(Eq. (1)). The spectral points about which the line is rotated
are the sampling points at
or a spline function, we
use a straight line to determine the
continuum. The straight line is rotated successively around
different spectral points resulting in different optical depths
(Eq. (1)). The spectral points about which the line is rotated
are the sampling points at
![]() and
and
![]() ,
respectively. The latter point is used because the
water ice band and other
compounds (Sect. 1) do not contribute to the
spectrum around
,
respectively. The latter point is used because the
water ice band and other
compounds (Sect. 1) do not contribute to the
spectrum around
![]() .
The angular
step used to represent the rotation
depends on the depth of the absorption profile. Smaller angular steps were
not found to improve the fit to the optical depth
.
The angular
step used to represent the rotation
depends on the depth of the absorption profile. Smaller angular steps were
not found to improve the fit to the optical depth ![]() .
We found that the
resulting optical depth
.
We found that the
resulting optical depth
![]() is strongly affected by the gradient
of the continuum's line. We finally look for the
line at a certain rotational center whose corresponding linear combination
of extinction profiles
is strongly affected by the gradient
of the continuum's line. We finally look for the
line at a certain rotational center whose corresponding linear combination
of extinction profiles
![]() reproduce the optical depth
reproduce the optical depth ![]() the
most successfully, i.e.,
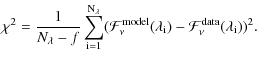
with the smallest reduced chi-square
the
most successfully, i.e.,
with the smallest reduced chi-square ![]() (Eq. (3)). We use the
fitting routine presented
in Schegerer et al. (2006). Representative continuum lines are drawn in the spectra shown in Figs. 2 and 3.
(Eq. (3)). We use the
fitting routine presented
in Schegerer et al. (2006). Representative continuum lines are drawn in the spectra shown in Figs. 2 and 3.
Table 2:
Relative mass contribution of amorphous-small (
![]() :
:
![]() and
and
![]() ), amorphous-large (
), amorphous-large (
![]() :
:
![]() ,
,
![]() ,
and
,
and
![]() )
and crystallized (
)
and crystallized (![]() :
all particle radii) water
ice grains derived from our modeling approach by using a
rotational center at
:
all particle radii) water
ice grains derived from our modeling approach by using a
rotational center at
![]() .
.
The determinations of both the continuum and the ice components
that effectively contribute to the absorption profile were tested by
analyzing the spectrum of the YSO GL 989. Its L band
spectral distribution was previously
investigated by Dartois & d'Hendecourt (2001). In
contrast to our measurements, the source was formerly observed with the ISO satellite
(Infrared Space Observatory) where the spectrum at short wavelengths could
be retained. But when this spectrum is cut at short wavelengths up to a wavelength of
![]() ,
the resulting
spectrum corresponds to the NAOS-CONICA spectra that we acquired
during different weather conditions.
The results of the analysis of the
,
the resulting
spectrum corresponds to the NAOS-CONICA spectra that we acquired
during different weather conditions.
The results of the analysis of the
![]() spectra of GL 989 with and without the short-wavelength
interval are finally compared. Potential differences
can then be considered
as an approximation of the systematic error caused by the missing
interval of the NAOS-CONICA spectra up to
spectra of GL 989 with and without the short-wavelength
interval are finally compared. Potential differences
can then be considered
as an approximation of the systematic error caused by the missing
interval of the NAOS-CONICA spectra up to
![]() .
We
note that Dartois & d'Hendecourt (2001) used a Planck function to
determine the underlying continuum of GL 989 assuming a temperature
of
.
We
note that Dartois & d'Hendecourt (2001) used a Planck function to
determine the underlying continuum of GL 989 assuming a temperature
of
![]() .
Furthermore, they considered extinction profiles of ice
grains with a continous size distribution.
.
Furthermore, they considered extinction profiles of ice
grains with a continous size distribution.
Figure 5 shows the results. Independent of
the rotational center used, the fitting
results obtained from the spectra that are truncated at
![]() differ by <
differ by <![]() from the results derived from
spectra for which the lower end of the L band
is considered. The mass contribution of crystallized ice can be
neglected in all spectra. The mass contribution of amorphous, large
grains depends strongly on the rotational center used. Both the
non-truncated and truncated spectra exhibit only marginal evidence of
large water ice grains (<
from the results derived from
spectra for which the lower end of the L band
is considered. The mass contribution of crystallized ice can be
neglected in all spectra. The mass contribution of amorphous, large
grains depends strongly on the rotational center used. Both the
non-truncated and truncated spectra exhibit only marginal evidence of
large water ice grains (<![]() )
when a rotational center at
)
when a rotational center at
![]() is used for the linear continuum. In contrast, the
contribution of amorphous, large grains with a size of
is used for the linear continuum. In contrast, the
contribution of amorphous, large grains with a size of
![]() is
>
is
>![]() when a rotational center at
when a rotational center at
![]() is used.
The fitting results deviate by between
is used.
The fitting results deviate by between
![]() and
and
![]() from the measurement (Eq. (3)). The deviation from the measurement is larger for fits with the rotational center at
from the measurement (Eq. (3)). The deviation from the measurement is larger for fits with the rotational center at
![]() .
.
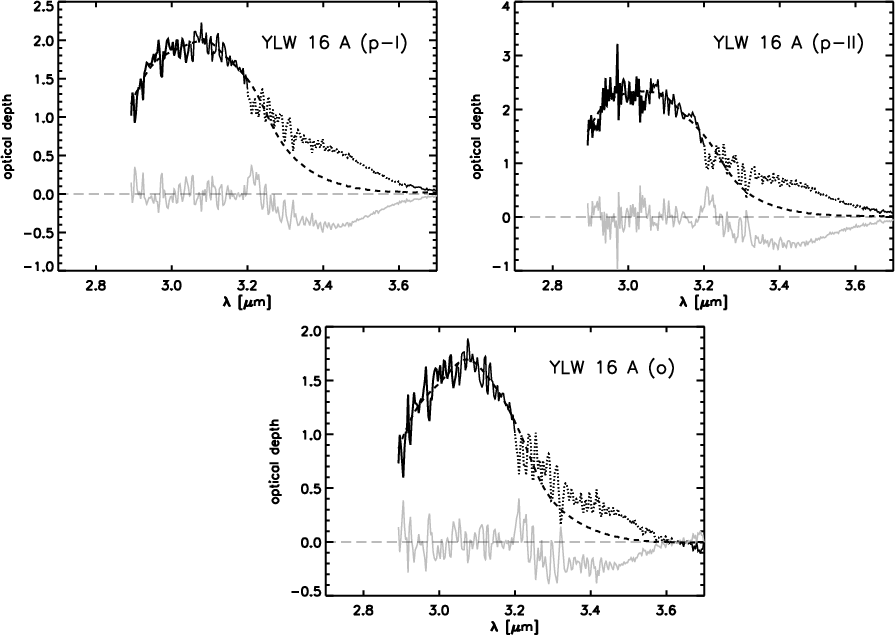
5.2 Modeling results
Table 2 and
Figs. 6 and 7
summarize our modeling results. The quality of each fit is characterized
by ![]() (e.g., Press et al. 1986) with
(e.g., Press et al. 1986) with
The data with the largest
The features of additional compounds (e.g., of ammonia
hydrate) is superimposed on fractions
of the ice absorption band at a wavelength of ![]()
![]() .
The spectral region between
.
The spectral region between
![]() and
and
![]() is not considered by our modeling approach
(dotted curves).
is not considered by our modeling approach
(dotted curves).
In contrast to our results for
spectra with the parallel slit orientation of the slit, a larger amount of crystalline grains (28%) contributes to the
spectrum of the orthogonal slit orientation (3rd line
in the Table 2). We point out
that this spectrum can be fitted by a larger amount of large,
i.e.,
![]() -sized amorphous grains, if crystallized grains
are excluded from the fit. As the fit then worsens by 35%, this finding
can be considered as evidence of crystalline dust grains, as the
maximum of the extinction profile of larger
amorphous grains shifts to longer wavelengths similar to the shift of the
extinction profile of crystalline grains.
-sized amorphous grains, if crystallized grains
are excluded from the fit. As the fit then worsens by 35%, this finding
can be considered as evidence of crystalline dust grains, as the
maximum of the extinction profile of larger
amorphous grains shifts to longer wavelengths similar to the shift of the
extinction profile of crystalline grains.
|
Figure 6:
Optical depth
|
| Open with DEXTER | |
In Fig. 7, the spectra 1 to 7 correspond to
different regions within the source that could be spatially resolved by our
observations with NAOS-CONICA for the orthogonal slit orientation
(Sect. 3). Because
of the too noisy data, we do not consider the optical depth derived from the
observation where the spectroscopic slit was orientated parallel to the
rotational axis. As we obtain tighter fits to the derived optical
depth, i.e., smaller ![]() ,
we focus only on the results
obtained from fits where the continuum's line is rotated around
,
we focus only on the results
obtained from fits where the continuum's line is rotated around
![]() but without forgetting the corresponding results
obtained for a rotational center at
but without forgetting the corresponding results
obtained for a rotational center at
![]() .
.
The spectra 3, 4, and 5 that were derived from the most central region
of the source around the photocenter appear to contain the largest
contribution of non-evolved, i.e., amorphous, small grains, while the
spectra from the outer source regions exhibit a greater contribution
from crystallized water ice. These crystalline, peripheral grains also
contributes to the spectrum where the counting rates of
![]() were summarized (3rd line in the Table 2).
were summarized (3rd line in the Table 2).
Considering Fig. 3 and the flux scales used, it is conspicuous that different gradients are found for fitting the continua of spectra that originate in different source regions. However, if steeper gradients were used to fit continua of spectra originating in outer source regions, even a larger contribution of crystallized grains would be found. On the other hand, a shallower gradient for the continua derived in the more central source regions would favor a larger contribution of small amorphous grains. In any case, the fit is poorer when gradients other than those are used.
The fit results obtained for spectra in which a rotational center at
![]() is used, have qualitatively the same increasing
contribution of crystalline grains towards the outer regions
(
is used, have qualitatively the same increasing
contribution of crystalline grains towards the outer regions
(
![]() ,
0.25%, 98% at the regions 1, 3, and 7,
respectively). However, as already mentioned in
Sect. 5.1, the contribution of amorphous, large (i.e.,
,
0.25%, 98% at the regions 1, 3, and 7,
respectively). However, as already mentioned in
Sect. 5.1, the contribution of amorphous, large (i.e.,
![]() -sized) grains has increased at the expense of
amorphous, small grains, in particular in the more
central regions 4, and 5, where on average
-sized) grains has increased at the expense of
amorphous, small grains, in particular in the more
central regions 4, and 5, where on average
![]() .
.
The column density ![]() of the absorbing ice material can be
determined by an integrating of the extinction profiles of amorphous
water ice that are fitted to the optical depth
of the absorbing ice material can be
determined by an integrating of the extinction profiles of amorphous
water ice that are fitted to the optical depth
![]() .
According
to Whittet (2002), we obtain
.
According
to Whittet (2002), we obtain
![$\displaystyle N_{\rm A}({\rm H}_{{\rm 2}}{\rm O [ice]}) =
\int^{3.8~{\rm\mu m}}_{2.8~{\rm\mu m}}
\frac{\tau(\lambda)}{A} \frac{{\rm d}\lambda}{\lambda^2}\cdot$](/articles/aa/full_html/2010/09/aa11849-09/img124.png)
The integral extinction cross-section A of amorphous water ice at a temperature of
When considering spectra obtained from different source regions, the quantities
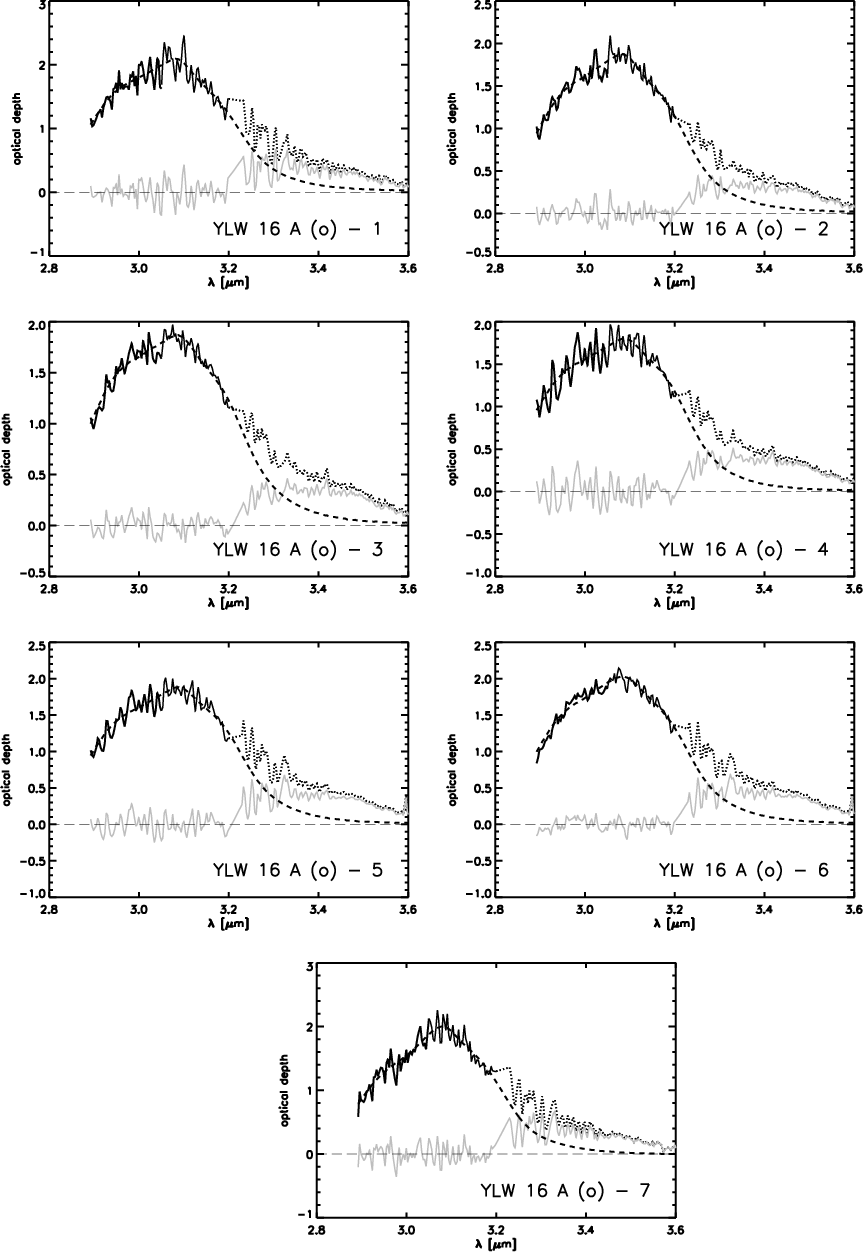
|
Figure 7: Continuation of Fig. 6 but the spectra 1 to 7 correspond to different regions within the source that could be spatially resolved by our observations with NAOS-CONICA (Sect. 3). |
| Open with DEXTER | |
5.3 Water ice growth in the disks around T Tauri stars?
The spectra of central source regions derived from a rotational
center of the continuum's line at
![]() show profiles of
amorphous water ice grains that exhibit only weak hints of grain growth
(Table 2). However, when considering the same results for a rotational center at
show profiles of
amorphous water ice grains that exhibit only weak hints of grain growth
(Table 2). However, when considering the same results for a rotational center at
![]() ,
the contribution of the absorption profiles of
,
the contribution of the absorption profiles of
![]() -sized grains is significantly higher although the fit worsens by 24% up to 32%.
From Eq. (2), we find that scattered radiation is
present only for grain sizes of up
-sized grains is significantly higher although the fit worsens by 24% up to 32%.
From Eq. (2), we find that scattered radiation is
present only for grain sizes of up ![]()
![]() .
If we replace the extinction profiles of large
grains (
.
If we replace the extinction profiles of large
grains (
![]() )
with the corresponding
absorption profiles, the spectroscopic contribution of large grains
increases by only a few percent.
)
with the corresponding
absorption profiles, the spectroscopic contribution of large grains
increases by only a few percent.
In previous studies, water ice grains larger than
![]() were not detected in YSOs. Thi et al. (2006) point
to broadened water ice profiles in the spectra of several YSOs in the molecular
cloud Vela indicating ice grain growth. There is at least one among
five objects in their sample where the absorption profile of
were not detected in YSOs. Thi et al. (2006) point
to broadened water ice profiles in the spectra of several YSOs in the molecular
cloud Vela indicating ice grain growth. There is at least one among
five objects in their sample where the absorption profile of
![]() -sized, amorphous ice grains can be used for
modeling. Whether this result and the other evidence we have found indicate ice
grain growth remains to be discussed in the context of the
following issues. As shown in Schegerer et al. (2006), increasing the porosity
of grains with constant radii broadens the
-sized, amorphous ice grains can be used for
modeling. Whether this result and the other evidence we have found indicate ice
grain growth remains to be discussed in the context of the
following issues. As shown in Schegerer et al. (2006), increasing the porosity
of grains with constant radii broadens the
![]() -silicate feature. We assume that porous water ice
grains show similar behavior but this assumption can only be confirmed by
future, theoretical
studies. Furthermore, it is often assumed that ice grains have cores,
such as those of
-silicate feature. We assume that porous water ice
grains show similar behavior but this assumption can only be confirmed by
future, theoretical
studies. Furthermore, it is often assumed that ice grains have cores,
such as those of
![]() -sized, amorphous silicate (e.g., Jones &
Merrill 1976). The core serves as a seed where water
is adsorbed. As shown in Fig. 8,
a growth in the
silicate core also results in a broadening of the
-sized, amorphous silicate (e.g., Jones &
Merrill 1976). The core serves as a seed where water
is adsorbed. As shown in Fig. 8,
a growth in the
silicate core also results in a broadening of the
![]() -absorption band (e.g., Smith et al. 1988). A broadening of the
extinction profile can also be evoked by the shape of the continuum curve
derived. In our study,
the continuum is represented by a straight line, while the Planck
function or spline functions are
used in other studies. The Planck function, which is concave down,
implies that there has been a
broadening of the water ice band at long wavelengths, which automatically
indicates ice grain growth. Finally, it is not clear to us why only
-absorption band (e.g., Smith et al. 1988). A broadening of the
extinction profile can also be evoked by the shape of the continuum curve
derived. In our study,
the continuum is represented by a straight line, while the Planck
function or spline functions are
used in other studies. The Planck function, which is concave down,
implies that there has been a
broadening of the water ice band at long wavelengths, which automatically
indicates ice grain growth. Finally, it is not clear to us why only
![]() -sized grains are found when large dust grains are
used in the fit. It has to be clarified whether the ice grain growth to sizes
-sized grains are found when large dust grains are
used in the fit. It has to be clarified whether the ice grain growth to sizes
![]() is physically prevented in YSOs or if this finding
can be ascribed to the fitting approach used.
is physically prevented in YSOs or if this finding
can be ascribed to the fitting approach used.
We conclude that an unambiguous identification of grain growth is difficult to make. In contrast, the discrimination between crystallized and amorphous grains should be easier as argued by Dartois & d'Hendecourt (2001), as the extinction profile of crystallized ice narrows.
5.4 Crystallized water ice in the disks around T Tauri stars?
Because of the low temperatures and weak shielding of the interstellar media against hard irradiation, we assume that there is a negligible contribution of crystallized water ice when YSOs start to form from molecular clouds. The finding of crystallized water ice in YLW 16 A is now discussed.
|
Figure 8:
Relation between extinction profile and the radius of the
grain core. The core consists of amorphous silicate, while
water ice forms a compact shell. The particles shown here have
a water ice core with a radius of
|
| Open with DEXTER | |
As described in Sect. 3, information about
the spatial
ice distribution within the circumstellar environment can be extracted
from the spectra measured with NAOS-CONICA. Instead of summarizing
the intensities of the aperture, the
Gaussian function that is fitted to the intensity distribution in each row
of the image is symmetrically divided in steps of
![]() ,
,
![]() ,
,
![]() ,
and
,
and
![]() starting at the
photocenter of the source. Independently of the rotational center used,
we mainly find amorphous water ice close to the photocenter
(
starting at the
photocenter of the source. Independently of the rotational center used,
we mainly find amorphous water ice close to the photocenter
(
![]() ). However, for increasing distance from the photocenter, the mass contribution of
crystallized ice strongly increases (Table 2,
Fig. 7).
). However, for increasing distance from the photocenter, the mass contribution of
crystallized ice strongly increases (Table 2,
Fig. 7).
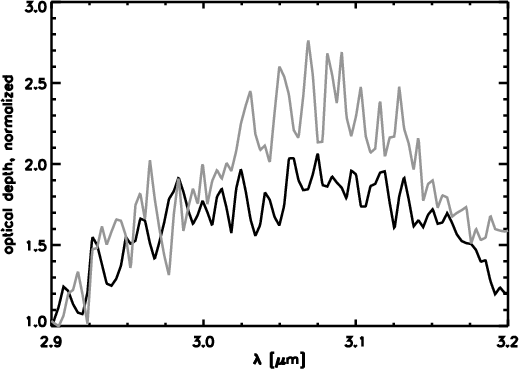
Figure 9 shows the normalized optical
depths derived from the depth of the peripheral
region 7 (gray
curve) that is overlaid on the mean of the depths of more central
regions. The optical depths of the more central regions are lower than
those of the peripheral regions. We note that if only amorphous grains
are used in our deconvolution approach, the fitting worsens by up to
14% according to the parameter ![]() (Eq. (3);
Table 2) derived.
(Eq. (3);
Table 2) derived.
The sketch in Fig. 10 shows a
circumstellar disk where the
location of amorphous and crystallized water ice grains are plotted
considering our fitting results. We
assume that the crystallized water ice component has its origin in
the
upper disk layers at large disk radii, where water ice does not evaporate
and is protected by the surrounding material of the circumstellar envelope
from irradiation. Because of the higher temperatures, water ice at
smaller radii close to the snowline is assumed to be crystallized
inside the
more embeded disk layers.
The observation of the outer parts of the optically thick disk also
explains the higher
column density ![]() inferred from spectra that
originates in the outer regions (Table 2). Again,
this finding
does not depend on the rotational center used. The
photocenter of the spectra is assumed to represent the optically
thin bipolar envelope of the source observed with NICMOS/HST (Allen et al. 2002). Because of the low effective shielding in this central region,
crystallized water ice is assumed to be destroyed by irradiation.
inferred from spectra that
originates in the outer regions (Table 2). Again,
this finding
does not depend on the rotational center used. The
photocenter of the spectra is assumed to represent the optically
thin bipolar envelope of the source observed with NICMOS/HST (Allen et al. 2002). Because of the low effective shielding in this central region,
crystallized water ice is assumed to be destroyed by irradiation.
|
Figure 9:
Optical depths derived from the central ( black curve) and peripheral
( gray
curve) regions of the YSO observed. The optical depths of the
region 3, 4, and 5 were averaged to obtain the black curve while
the depth from the region 7 was used to obtain the gray curve. For
comparison, the curves are normalized at the optical depth at |
| Open with DEXTER | |
![\begin{figure}
\par\includegraphics[origin=rb,angle=-90,width=12cm,clip]{004fig44.ps}
\end{figure}](/articles/aa/full_html/2010/09/aa11849-09/img135.png)
|
Figure 10: Sketch for a strongly inclined circumstellar disk such as YLW 16 A. We assume that amorphous, non-evolved water ice is located in the circumstellar disk and in the bipolar envelope. The assumed location of crystallized water ice in the disk is close to upper disk layers, at disk radii that are larger than that of the snowline. The observer and the spectroscopic slit are also sketched. The orthogonal slit orientation is shown. Radiation from amorphous and crystallized ice grains are represented by dashed and solid arrows, respectively. |
| Open with DEXTER | |
The YSOs that were additionally observed with NAOS-CONICA and whose observations are presented in the Appendix of this publication, do not show any evidence of crystallization. However, the spectra of these objects contain the water ice absorption feature. The question of whether these features originate in the circumstellar environment of these objects cannot unequivocally be answered here.
6 Summary
We have presented an L band spectroscopic observation performed with
NAOS-CONICA of a YSO that is strongly inclined. These
systems allow the study of optical thick circumstellar regions that shield
water ice from hard irradiation and evaporation. The absorption feature of water ice at
![]() was identified in the spectra with
optical depths of between 1.8 and 2.5, depending on the region observed.
The optical depth, the water-ice column density, and the visual
extinction are higher in the more peripheral regions at greater
distance from the photocenter of our observations. The
optical depths were derived from the spectra by assuming that a
straight line represents the continuum flux.
was identified in the spectra with
optical depths of between 1.8 and 2.5, depending on the region observed.
The optical depth, the water-ice column density, and the visual
extinction are higher in the more peripheral regions at greater
distance from the photocenter of our observations. The
optical depths were derived from the spectra by assuming that a
straight line represents the continuum flux.
Considering the extinction profiles of amorphous and crystallized water ice grains with sizes ranging from
![]() up to
up to
![]() ,
the derived optical depths were deconvolved using a fitting routine
that was already presented in Schegerer et al. (2006).
The optical depths of the spatially unresolved spectra were found to be
dominated by the extinction profile of small, amorphous (i.e.,
non-evolved) water ice grains. However, in spectra for which the
T Tauri object YLW 16 A could be spatially resolved,
crystallized water ice could be found in possible outer disk regions,
i.e., in disk layers at radii >
,
the derived optical depths were deconvolved using a fitting routine
that was already presented in Schegerer et al. (2006).
The optical depths of the spatially unresolved spectra were found to be
dominated by the extinction profile of small, amorphous (i.e.,
non-evolved) water ice grains. However, in spectra for which the
T Tauri object YLW 16 A could be spatially resolved,
crystallized water ice could be found in possible outer disk regions,
i.e., in disk layers at radii >
![]() in
projection. The putative
bipolar envelope of this source was not found to exhibit any evidence of crystallized
material (Fig. 10). A growth in the
size of the water ice grains
cannot unambiguously be determined because the corresponding modification of the
water ice feature may also be either caused by an increase in the
porosity and/or a growth of the particle core.
in
projection. The putative
bipolar envelope of this source was not found to exhibit any evidence of crystallized
material (Fig. 10). A growth in the
size of the water ice grains
cannot unambiguously be determined because the corresponding modification of the
water ice feature may also be either caused by an increase in the
porosity and/or a growth of the particle core.
We thank D. Semenov and M. Goto, in particular, for fruitfull discussions and their further support. Thanks are also due to J. Bouwman for his valuable assistance during the proposal preparation phase.
References
- Allen, C. W. 2000, in Astrophysical Quantities, ed. A. N. Cox (Springer) [Google Scholar]
- Allen, L. E., Myers, P. C., Di Francesco, J., et al. 2002, ApJ, 566, 993 [NASA ADS] [CrossRef] [Google Scholar]
- Bernstein, M. P., Elsila, J. E., Dworkin, J. P., et al. 2002, ApJ, 576, 1115 [NASA ADS] [CrossRef] [Google Scholar]
- Boogert, A. C. A., Pontoppidan, K. M., Lahuis, F., et al. 2004, ApJS, 154, 359 [NASA ADS] [CrossRef] [Google Scholar]
- Boogert, A. C. A., Pontoppidan, K. M., Knez, C., et al. 2008, ApJ, 678, 985 [NASA ADS] [CrossRef] [Google Scholar]
- Bouwman, J., Meeus, G., de Koter, A., et al. 2001, A&A, 375, 950 [NASA ADS] [CrossRef] [EDP Sciences] [Google Scholar]
- Chen, W. P., & Graham, J. A. 1993, ApJ, 409, 319 [NASA ADS] [CrossRef] [Google Scholar]
- Chiang, E. I., Joung, M. K., Creech-Eakman, M. J., Qi, C., Kessler, J. E., et al. 2001, ApJ, 547, 1077 [NASA ADS] [CrossRef] [Google Scholar]
- Chiar, J. E., Adamson, A. J., Pendleton, Y. J., et al. 2002, ApJ, 570, 198 [NASA ADS] [CrossRef] [Google Scholar]
- Creech-Eakman, M. J., Chiang, E. I., Joung, R. M. K., Blake, G. A., & van Dishoeck, E. F. 2002, A&A, 385, 546 [NASA ADS] [CrossRef] [EDP Sciences] [Google Scholar]
- Cutri, R. M., Skrutskie, M. F., van Dyk, S., et al. 2003, 2MASS All Sky Catalog of point sources [Google Scholar]
- Dartois, E., & d'Hendecourt, L. 2001, A&A, 365, 144 [NASA ADS] [CrossRef] [EDP Sciences] [Google Scholar]
- Dartois, E., d'Hendecourt, L., Thi, W., Pontoppidan, K. M., & van Dishoeck, E. F. 2002, A&A, 394, 1057 [NASA ADS] [CrossRef] [EDP Sciences] [Google Scholar]
- Davis, S. S. 2007, ApJ, 660, 1580 [NASA ADS] [CrossRef] [Google Scholar]
- d'Hendecourt, L. B., Allamandola, L. J., & Greenberg, J. M. 1985, A&A, 152, 130 [NASA ADS] [Google Scholar]
- Duley, W. W., & Williams, D. A. 1984, Nature, 311, 685 [NASA ADS] [CrossRef] [Google Scholar]
- Ehrenfreund, P., Gerakines, P. A., Schutte, W. A., van Hemert, M. C., & van Dishoeck, E. F. 1996, A&A, 312, 263 [NASA ADS] [Google Scholar]
- Gezari, D. Y., Pitts, P. S., & Schmitt, M. 1999, 5 [Google Scholar]
- Gillett, F. C., & Forrest, W. J. 1973, ApJ, 179, 483 [NASA ADS] [CrossRef] [Google Scholar]
- Gillett, F. C., Jones, T. W., Merrill, K. M., & Stein, W. A. 1975, A&A, 45, 77 [NASA ADS] [Google Scholar]
- Graham, J. A. 1992, PASP, 104, 479 [NASA ADS] [CrossRef] [Google Scholar]
- Hagen, W., Tielens, A. G. G. M., & Greenberg, J. M. 1981a, Chem. Phys., 56, 367 [NASA ADS] [CrossRef] [Google Scholar]
- Hagen, W., & Tielens, A. G. G. M. 1981b, Chem. Phys., 75, 4198 [Google Scholar]
- Haisch, K. E., Jr., Barsony, M., Greene, T. P., & Ressler, M. E. 2002, ApJ, 124, 2841 [Google Scholar]
- Haisch, K. E., Barsony, M., Ressler, M. E., & Greene, T. P. 2006, AJ, 132, 2675 [NASA ADS] [CrossRef] [Google Scholar]
- Hartquist, T. W., & Wolf, M. 1990, MNRAS, 247, 343 [NASA ADS] [Google Scholar]
- Jones, T. W., & Merrill, K. M. 1976, ApJ, 209, 509 [NASA ADS] [CrossRef] [Google Scholar]
- Koresko, C. D., Herbst, T. M., & Leinert, Ch. 1997, ApJ, 480, 741 [NASA ADS] [CrossRef] [Google Scholar]
- Kouchi, A., & Kuroda, T. 1990, Nature, 344, 134 [NASA ADS] [CrossRef] [Google Scholar]
- Léger, A., Jura, M., & Omont, A. 1985, A&A, 144, 147 [NASA ADS] [Google Scholar]
- Leggett, S. K., Hawarden, T. G., Currie, M. J., et al. 2003, MNRAS, 345, 144 [NASA ADS] [CrossRef] [Google Scholar]
- Leinert, Ch., Beck, T. L., Ligori, S., et al. 2001, A&A, 369, 215 [NASA ADS] [CrossRef] [EDP Sciences] [Google Scholar]
- Lenzen, R., Hartung, M., Brandner, W., et al. 2003, SPIE Proc., 4841, 944 [Google Scholar]
- Martin, P. G. 1978, in Cosmic Dust (Clarendon Press) [Google Scholar]
- Merrill, K. M., Russell, R. W., & Soifer, B. T. 1976, ApJ, 207, 763 [NASA ADS] [CrossRef] [Google Scholar]
- Mukai, T. 1986, A&A, 164, 397 [NASA ADS] [Google Scholar]
- Muñoz Caro, G. M., Meierhenrich, U. J., Schutte, W. A., et al. 2002, Nature, 416, 403 [NASA ADS] [CrossRef] [PubMed] [Google Scholar]
- Murakawa, K., Tamura, M., & Nagata, T. 2000, ApJS, 128, 603 [NASA ADS] [CrossRef] [Google Scholar]
- Pickles, A. J. 1998, PASP, 110, 863 [CrossRef] [Google Scholar]
- Pontoppidan, K., van Dishoeck, E. F., & Dartois, E. 2004, A&A, 426, 925 [NASA ADS] [CrossRef] [EDP Sciences] [Google Scholar]
- Pontoppidan, K. M., Dullemond, C. P., van Dishoeck, E. F., et al. 2005, ApJ, 622, 463 [NASA ADS] [CrossRef] [Google Scholar]
- Press, W. H., Teukolsky, S. A., Vetterling, W. T., & Flannery, B. P. 1986 (UK: Cambridge University Press) [Google Scholar]
- Przygodda, F. 2004, Ph.D. Thesis, Ruprecht-Karls-Universität, Heidelberg [Google Scholar]
- Querry, M. R., Curnutte, B., & Williams, D. 1969, J. Opt. Soc. Am., 59, 1299 [NASA ADS] [CrossRef] [Google Scholar]
- Rayner, J. T., Cushing, M. C., & Vacca, W. D. 2009, ApJS, 185, 289 [NASA ADS] [CrossRef] [Google Scholar]
- Rousset, G., Lacombe, F., Puget, P., et al. 2003, SPIE Proc., 4839, 140 [Google Scholar]
- Schegerer, A., Wolf, S., Voshchinnikov, N. V., Przygodda, F., & Kessler-Silacci, J. E. 2006, A&A, 456, 535 [NASA ADS] [CrossRef] [EDP Sciences] [Google Scholar]
- Schmitt, B., Quirico, E., Trotta, F., & Grundy, W. M. 1998, in Solar System Ices, ed. D. Kluwer (Academic Publishers), 199 [Google Scholar]
- Simon, M., Howell, R. R., Longmore, A. J., et al. 1987, ApJ, 320, 344 [NASA ADS] [CrossRef] [Google Scholar]
- Smith, R. G., Sellgren, K., & Tokunaga, A. T. 1988, ApJ, 334, 209 [NASA ADS] [CrossRef] [Google Scholar]
- Smith, R. G., Sellgren, K., & Tokunaga, A. T. 1989, ApJ, 344, 413 [NASA ADS] [CrossRef] [Google Scholar]
- Solc, M. 1980, Acta Math., 21, 19 [Google Scholar]
- Stevenson, D. J., & Lunine, J. I. 1988, Icarus, 75, 146 [NASA ADS] [CrossRef] [Google Scholar]
- Teixeira, T. C., & Emerson, J. P. 1999, A&A, 351, 292 [NASA ADS] [Google Scholar]
- Terada, H., Tokunaga, A. T., Kobayashi, N., et al. 2007, ApJ, in press [Google Scholar]
- Thi, W.-F., van Dishoeck, E. F., Dartois, E., et al. 2006, A&A, 449, 251 [NASA ADS] [CrossRef] [EDP Sciences] [Google Scholar]
- Tielens, A. G. G. M., & Hagen, W. 1982, A&A, 114, 245 [NASA ADS] [Google Scholar]
- Tielens, A. G. G. M., Allamandola, L. J., Bregman, J., et al. 1984, ApJ, 287, 697 [NASA ADS] [CrossRef] [Google Scholar]
- van der Bliek, N. S., Manfroid, J., & Bouchet, P. 1996, A&AS, 119, 547 [Google Scholar]
- van de Bult, C. E. P. M., Mayo Greenberg, J., & Whittet, D. C. B. 1985, 214, 289 [Google Scholar]
- Wallace, L., & Hinkle, K. 2002, AJ, 124, 3396 [Google Scholar]
- Whittet, D. C. B., in Dust In The Galactic Environment 2002, ed. M. Birkinshaw, M. Elvis, & J. Silk (The Institute of Physics) [Google Scholar]
- Wolf, S., & Voshchinnikov, N. V. 2004, CoPhC, 162, 113 [NASA ADS] [Google Scholar]
Online Material
Appendix A: Additional measurements
Table A.1: Overview of additional observations with NAOS-CONICA. Coordinates, L band magnitude, FWHM, date, observing time (UT), and the mean airmass (AM) during the observations are listed.
Table A.1 provides details of additional observations with
NAOS-CONICA. The quantity
![]() is
the total exposure time. The standard stars HR 6070 and
BS 7330 were observed directly before or after the
observation of each target.
The brightness of the standard star BS 7330 is known from the standard star catalog of Leggett et al. (2003).
The observation of the standard star BS 7330 helped to remove the
telluric absorption features from the spectrum of VV CrA and its
subsequent photometric calibration, while the object HR 6070 was
used as a standard star for all remaining objects. The L band brightness of the objects CRBR 2422.8-3423 and VV CrA A are found in the
Gezari-catalog (1999). The L band brightness of the infrared
companion VV CrA B is not known. The FWHM of the projected diameter of
CRBR 2422.8-3423 could be estimated using a K band image (Pontoppidan et al. 2005). The FWHM of the diameter of VV CrA A and
VV CrA B were derived using interferometric
measurements in N band (Przygodda 2004). The flux and the diameter of the object Elia 2-23 in the L band were taken from Haisch et al. (2002). The NICMOS/HST-image of GY92 244
in the H band (Allen et al. 2002) allows us to approximate the diameter of the corresponding disks in L band. The L band brightness of this object was estimated by considering known H band magnitudes and (H-K) and (K-N) colors of additional YSOs in the same star-forming region (Allen et al. 2002).
is
the total exposure time. The standard stars HR 6070 and
BS 7330 were observed directly before or after the
observation of each target.
The brightness of the standard star BS 7330 is known from the standard star catalog of Leggett et al. (2003).
The observation of the standard star BS 7330 helped to remove the
telluric absorption features from the spectrum of VV CrA and its
subsequent photometric calibration, while the object HR 6070 was
used as a standard star for all remaining objects. The L band brightness of the objects CRBR 2422.8-3423 and VV CrA A are found in the
Gezari-catalog (1999). The L band brightness of the infrared
companion VV CrA B is not known. The FWHM of the projected diameter of
CRBR 2422.8-3423 could be estimated using a K band image (Pontoppidan et al. 2005). The FWHM of the diameter of VV CrA A and
VV CrA B were derived using interferometric
measurements in N band (Przygodda 2004). The flux and the diameter of the object Elia 2-23 in the L band were taken from Haisch et al. (2002). The NICMOS/HST-image of GY92 244
in the H band (Allen et al. 2002) allows us to approximate the diameter of the corresponding disks in L band. The L band brightness of this object was estimated by considering known H band magnitudes and (H-K) and (K-N) colors of additional YSOs in the same star-forming region (Allen et al. 2002).
Analogous to YLW 16 A, all targets were observed twice, with two orthogonal
orientations of the slit: parallel (p) and
orthogonal (o) to a predefined direction. If the position angle
of the disk was not known, the orientation of possible
companions were considered in the subsequent selection of the slit orientation. A slit length of 28
![]() allowed us to observe the companions of VV CrA A (i.e., VV CrA B at an angular distance of 1.69
allowed us to observe the companions of VV CrA A (i.e., VV CrA B at an angular distance of 1.69
![]() ;
Przygodda 2004) and Elia 2-23 (Elia 2-21 at an angular
distance of 10
;
Przygodda 2004) and Elia 2-23 (Elia 2-21 at an angular
distance of 10
![]() ;
Haisch et al. 2002) in the parallel
orientation of the slit, simultaneously. The data reduction of these observations is described in Sect. 3.
;
Haisch et al. 2002) in the parallel
orientation of the slit, simultaneously. The data reduction of these observations is described in Sect. 3.
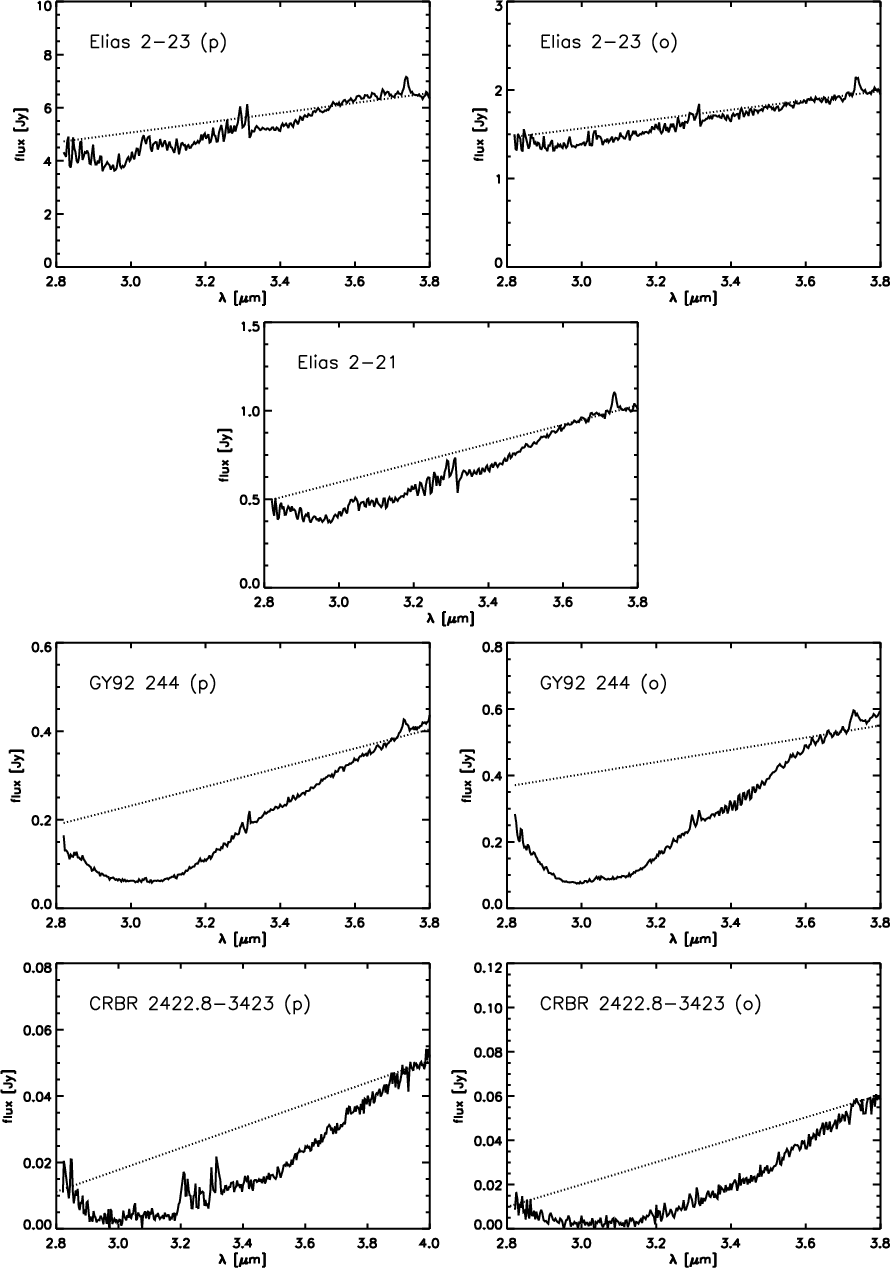
Figures A.1 and A.2 show the resulting L band spectra of these targets. Considering the derived flux, some sources exhibit an intrinsic variability in L band (Leinert et al. 2001). For instance, it is known that the NIR brightness of VV CrA ``conspicuously'' varies within a period of few years (Graham 1992; Chen & Graham 1993; Koresko et al. 1997; Przygodda 2004).
|
Figure A.1: Extracted and photometrically calibrated L band spectra of further targets. |
| Open with DEXTER | |
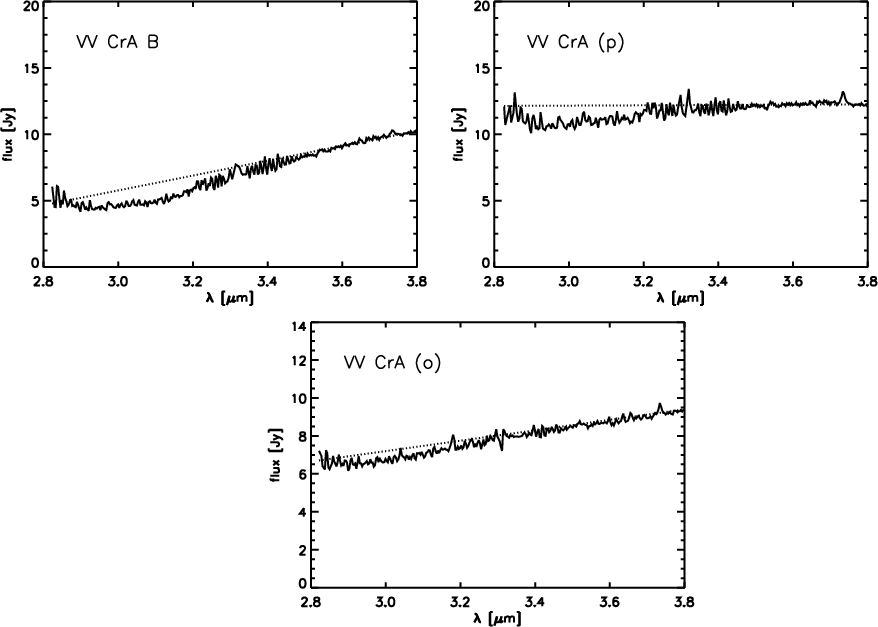
|
Figure A.2: Continuation of Fig. A.1. |
| Open with DEXTER | |
The result of our observations of VV CrA A![]() conflicts with a
spectroscopic measurement performed on data acquired using the 4m-telescope of the CTIO (Cerro
Tololo Inter-American Observatory; Chen & Graham 1993). The
absorption band of VV CrA A detected by our observation is weak, while
the observation of Chen & Graham (1993) does not show any
absorption ice band at all. This difference may be attributed to the factor-of-two higher spectral resolution
power of NAOS-CONICA and its higher spatial resolution
power by a factor of
conflicts with a
spectroscopic measurement performed on data acquired using the 4m-telescope of the CTIO (Cerro
Tololo Inter-American Observatory; Chen & Graham 1993). The
absorption band of VV CrA A detected by our observation is weak, while
the observation of Chen & Graham (1993) does not show any
absorption ice band at all. This difference may be attributed to the factor-of-two higher spectral resolution
power of NAOS-CONICA and its higher spatial resolution
power by a factor of ![]() 11. Therefore, observations with NAOS-CONICA
allow us to observe more central regions that are strongly influenced by both the star
and disk. The water ice absorption band of the infrared companion is
more pronounced. This companion, that is strongly variable in the infrared
wavelength range (Koresko et al. 1997), exhibits a broad
absorption band. Our analysis of the observations of this source
agree with previous measurements with the 4m-telescope at the CTIO.
11. Therefore, observations with NAOS-CONICA
allow us to observe more central regions that are strongly influenced by both the star
and disk. The water ice absorption band of the infrared companion is
more pronounced. This companion, that is strongly variable in the infrared
wavelength range (Koresko et al. 1997), exhibits a broad
absorption band. Our analysis of the observations of this source
agree with previous measurements with the 4m-telescope at the CTIO.
Owing to the noisy data from which only parts of the telluric features
could be removed, processed water ice, i.e., crystallized and/or grown
ice grains cannot unambiguously be found. Residual telluric features
also hamper the determination of the column densities
![]() .
Figure A.3 shows the
optical depths of the objects for which the determination of the column
density and a subsequent modelling were possible, given the residual
telluric features. Table A.2 lists the
corresponding results.
.
Figure A.3 shows the
optical depths of the objects for which the determination of the column
density and a subsequent modelling were possible, given the residual
telluric features. Table A.2 lists the
corresponding results.
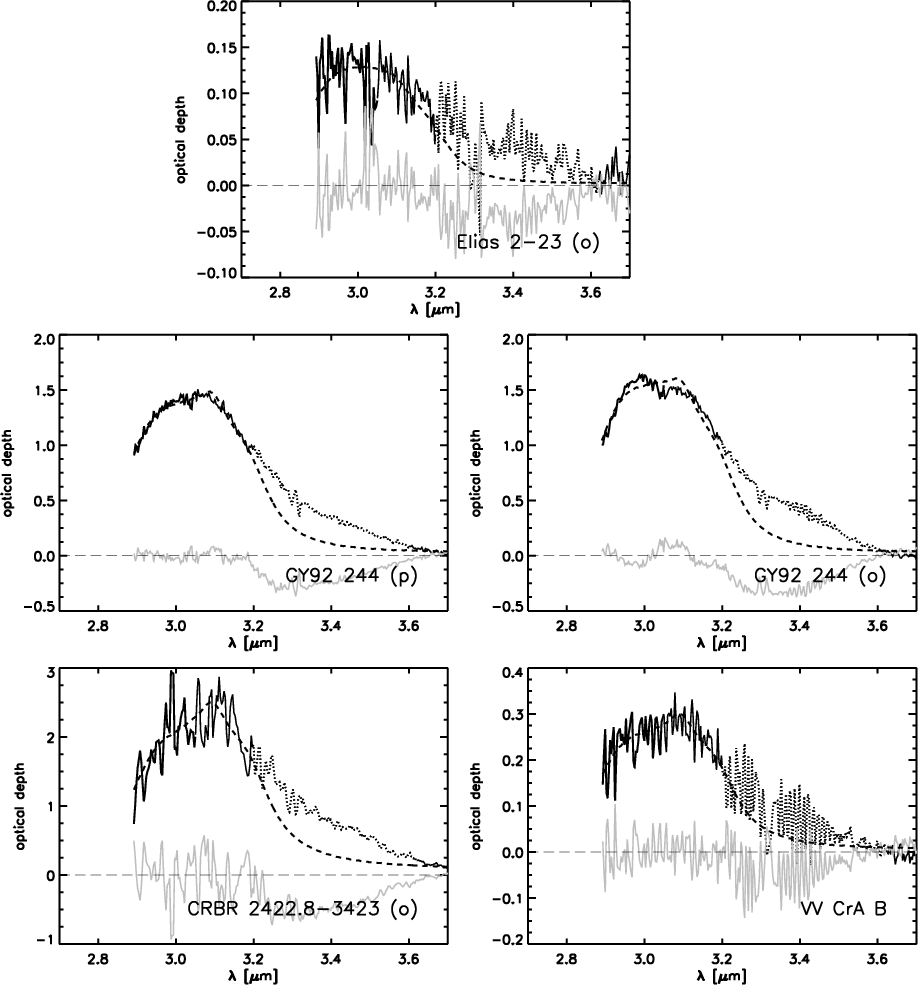
|
Figure A.3:
Optical depth
|
| Open with DEXTER | |
Table A.2:
Column density ![]() of water ice along the line of sight to the observer (Eq. (4)).
of water ice along the line of sight to the observer (Eq. (4)).
The detection of crystallized water ice in the spectra of
CRBR 2422.8-3423 cannot definitely be confirmed. Studying the
derived profiles in Smith et al. (1989) and Dartois &
d'Hendecourt (2001), a signal-to-noise ratio greater than
![]() 4 is required to prove crystallized water ice in the
spectra, i.e., to distinguish the extinction profiles of crystallized and
amorphous ice grains. Our measurement of CRBR 2422.8-3423 is
obtained from data with a
signal-to-noise ratio of
4 is required to prove crystallized water ice in the
spectra, i.e., to distinguish the extinction profiles of crystallized and
amorphous ice grains. Our measurement of CRBR 2422.8-3423 is
obtained from data with a
signal-to-noise ratio of ![]() 6. However, the profile of
CRBR 2422.8-3423 cannot be used because its absorption is saturated
(Fig. A.1).
6. However, the profile of
CRBR 2422.8-3423 cannot be used because its absorption is saturated
(Fig. A.1).
Footnotes
- ...
object
- Based on observations collected at the European Organisation for Astronomical Research in the Southern Hemisphere, Chile (proposal 077.C-0794(A)).
- ...
- Appendix is only available in electronic form at http://www.aanda.org
- ...1996)
- Fourteen different ice
compounds, such as CO, CO
 ,
or CH
,
or CH ice are known. Ice
molecules are weakly bounded just by van-der-Waals forces or by
hydrogen bonds. A chemical compound that can be found in metals,
minerals, and diamonds does not form.
ice are known. Ice
molecules are weakly bounded just by van-der-Waals forces or by
hydrogen bonds. A chemical compound that can be found in metals,
minerals, and diamonds does not form.
- ... band
- The L band covers a wavelength interval between
 and
and
 in the near-infrared range.
- ... NSF/NOAO
- The sky spectrum is available at http://www.eso.org/sci/facilities/paranal/instruments/.
- ... spectra
- The L' band covers the NIR range between
 and
.
and
.
- ... archive
- http://irsa.ipac.caltech.edu/Missions/spitzer.html
- ... VV CrA A
- The main component of the binary in N band is the south-west component in the binary system. The north-east component is brighter in L band.
All Tables
Table 1: Overview of our observations with NAOS-CONICA.
Table 2:
Relative mass contribution of amorphous-small (
![]() :
:
![]() and
and
![]() ), amorphous-large (
), amorphous-large (
![]() :
:
![]() ,
,
![]() ,
and
,
and
![]() )
and crystallized (
)
and crystallized (![]() :
all particle radii) water
ice grains derived from our modeling approach by using a
rotational center at
:
all particle radii) water
ice grains derived from our modeling approach by using a
rotational center at
![]() .
.
Table A.1: Overview of additional observations with NAOS-CONICA. Coordinates, L band magnitude, FWHM, date, observing time (UT), and the mean airmass (AM) during the observations are listed.
Table A.2:
Column density ![]() of water ice along the line of sight to the observer (Eq. (4)).
of water ice along the line of sight to the observer (Eq. (4)).
All Figures
|
|
Figure 1: Transmission of atmosphere and instrument derived from the spectrum of the standard star HR 6070. |
| Open with DEXTER | |
| In the text | |
|
|
Figure 2:
Extracted and photometrically calibrated L band spectra of the
source YLW 16 A for slit orientations parallel and orthogonal to
its rotational axis. The counting rates of
|
| Open with DEXTER | |
| In the text | |
|
|
Figure 3:
Extracted and photometrically calibrated L band spectra of YLW 16 A
derived from seven spatially adjacent stripes cut from the
acquired
spectra. The spectra 1 to 7 represent spectra derived from
source regions of widths
|
| Open with DEXTER | |
| In the text | |
| |
Figure 4:
Normalized extinction profiles
|
| Open with DEXTER | |
| In the text | |
|
|
Figure 5:
Left panel: L band spectrum of the object GL 989 measured with the ISO satellite. Because of the lower
transmission of the sky, the spectral interval at short wavelengths that
is indicated by gray color is difficult to observe using
NAOS-CONICA or any
other instrument on the ground because of the lower transmission of the sky. The
dotted line represents the likely
linear continuum. |
| Open with DEXTER | |
| In the text | |
|
|
Figure 6:
Optical depth
|
| Open with DEXTER | |
| In the text | |
|
|
Figure 7: Continuation of Fig. 6 but the spectra 1 to 7 correspond to different regions within the source that could be spatially resolved by our observations with NAOS-CONICA (Sect. 3). |
| Open with DEXTER | |
| In the text | |
|
|
Figure 8:
Relation between extinction profile and the radius of the
grain core. The core consists of amorphous silicate, while
water ice forms a compact shell. The particles shown here have
a water ice core with a radius of
|
| Open with DEXTER | |
| In the text | |
|
|
Figure 9:
Optical depths derived from the central ( black curve) and peripheral
( gray
curve) regions of the YSO observed. The optical depths of the
region 3, 4, and 5 were averaged to obtain the black curve while
the depth from the region 7 was used to obtain the gray curve. For
comparison, the curves are normalized at the optical depth at |
| Open with DEXTER | |
| In the text | |
|
|
Figure 10: Sketch for a strongly inclined circumstellar disk such as YLW 16 A. We assume that amorphous, non-evolved water ice is located in the circumstellar disk and in the bipolar envelope. The assumed location of crystallized water ice in the disk is close to upper disk layers, at disk radii that are larger than that of the snowline. The observer and the spectroscopic slit are also sketched. The orthogonal slit orientation is shown. Radiation from amorphous and crystallized ice grains are represented by dashed and solid arrows, respectively. |
| Open with DEXTER | |
| In the text | |
|
|
Figure A.1: Extracted and photometrically calibrated L band spectra of further targets. |
| Open with DEXTER | |
| In the text | |
|
|
Figure A.2: Continuation of Fig. A.1. |
| Open with DEXTER | |
| In the text | |
|
|
Figure A.3:
Optical depth
|
| Open with DEXTER | |
| In the text | |
Copyright ESO 2010
Current usage metrics show cumulative count of Article Views (full-text article views including HTML views, PDF and ePub downloads, according to the available data) and Abstracts Views on Vision4Press platform.
Data correspond to usage on the plateform after 2015. The current usage metrics is available 48-96 hours after online publication and is updated daily on week days.
Initial download of the metrics may take a while.