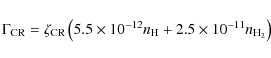
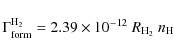
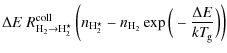
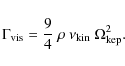
| Issue |
A&A
Volume 501, Number 1, July I 2009
|
|
|---|---|---|
| Page(s) | 383 - 406 | |
| Section | Numerical methods and codes | |
| DOI | https://doi.org/10.1051/0004-6361/200911821 | |
| Published online | 29 April 2009 | |
Radiation thermo-chemical models of protoplanetary disks
I. Hydrostatic disk structure and inner rim
P. Woitke1,2 - I. Kamp3 - W.-F. Thi4
1 - UK Astronomy Technology Centre, Royal Observatory, Edinburgh,
Blackford Hill, Edinburgh EH9 3HJ, UK
2 -
School of Physics & Astronomy, University of St. Andrews,
North Haugh, St. Andrews KY16 9SS, UK
3 -
Kapteyn Astronomical Institute, Postbus 800,
9700 AV Groningen, The Netherlands
4 -
SUPA![]() ,
Institute for Astronomy, University of Edinburgh,
Royal Observatory, Blackford Hill, Edinburgh EH9 3HJ, UK
,
Institute for Astronomy, University of Edinburgh,
Royal Observatory, Blackford Hill, Edinburgh EH9 3HJ, UK
Received 10 February 2009 / Accepted 1 April 2009
Abstract
Context. Emission lines from protoplanetary disks originate mainly in the irradiated surface layers, where the gas is generally warmer than the dust. Therefore, interpreting emission lines requires detailed thermo-chemical models, which are essential to converting line observations into understanding disk physics.
Aims. We aim at hydrostatic disk models that are valid from 0.1 AU to 1000 AU to interpret gas emission lines from UV to sub-mm. In particular, our interest lies in interpreting far IR gas emission lines, such as will be observed by the Herschel observatory, related to the G ASPS open time key program. This paper introduces a new disk code called P ROD IM O.
Methods. We combine frequency-dependent 2D dust continuum radiative transfer, kinetic gas-phase and UV photo-chemistry, ice formation, and detailed non-LTE heating & cooling with the consistent calculation of the hydrostatic disk structure. We include Fe II and CO ro-vibrational line heating/cooling relevant to the high-density gas close to the star, and apply a modified escape-probability treatment. The models are characterised by a high degree of consistency between the various physical, chemical, and radiative processes, where the mutual feedbacks are solved iteratively.
Results. In application to a T Tauri disk extending from 0.5 AU to 500 AU, the models show that the dense, shielded and cold midplane (
![]() ,
,
![]() )
is surrounded by a layer of hot (
)
is surrounded by a layer of hot (
![]() K) and thin (
K) and thin (
![]() to
to
![]() )
atomic gas that extends radially to about 10 AU and vertically up to
)
atomic gas that extends radially to about 10 AU and vertically up to
![]() .
This layer is predominantly heated by the stellar UV (e.g. PAH-heating) and cools via Fe II semi-forbidden and O I 630 nm optical line emission. The dust grains in this ``halo'' scatter the starlight back onto the disk, which affects the photochemistry. The more distant regions are characterised by a cooler flaring structure. Beyond
.
This layer is predominantly heated by the stellar UV (e.g. PAH-heating) and cools via Fe II semi-forbidden and O I 630 nm optical line emission. The dust grains in this ``halo'' scatter the starlight back onto the disk, which affects the photochemistry. The more distant regions are characterised by a cooler flaring structure. Beyond
![]() AU,
AU,
![]() decouples from
decouples from
![]() even in the midplane and reaches values of about
even in the midplane and reaches values of about
![]() .
.
Conclusions. Our models show that the gas energy balance is the key to understanding the vertical disk structure. Models calculated with the assumption
![]() show a much flatter disk structure. The conditions in the close regions (<10 AU) with densities
show a much flatter disk structure. The conditions in the close regions (<10 AU) with densities
![]() to
to
![]() resemble those of cool stellar atmospheres and, thus, the heating and cooling is more like in stellar atmospheres. The application of heating and cooling rates known from PDR and interstellar cloud research alone can be misleading here, so more work needs to be invested to identify the leading heating and cooling processes.
resemble those of cool stellar atmospheres and, thus, the heating and cooling is more like in stellar atmospheres. The application of heating and cooling rates known from PDR and interstellar cloud research alone can be misleading here, so more work needs to be invested to identify the leading heating and cooling processes.
Key words: astrochemistry - radiative transfer - methods: numerical - stars: formation - stars: circumstellar matter
1 Introduction
The structure and composition of protoplanetary disks play a key role in understanding the process of planet formation. From thermal and scattered light observations, we know that protoplanetary disks are ubiquitous in star-forming regions and that the dust in these disks evolves on timescales of 106 yr (Watson et al. 2007; Haisch et al. 2006). However, dust grains represent only about 1% of the mass in these disks - 99% of their mass is gas.
While observations of the dust in these systems have a long history
(e.g. Beckwith et al. 1990), gas observations are intrinsically more
difficult and until recently have focused on rotational lines of
abundant molecules such as CO, HCN, HCO+(e.g. Thi et al. 2004; Beckwith et al. 1986; Dutrey et al. 1997; van Zadelhoff et al. 2001; Koerner et al. 1993).
These lines generally trace the outer cooler regions of protoplanetary
disks and probe a layer at intermediate heights, where the stellar UV
radiation is sufficiently shielded to suppress photodissociation, but
still provides enough ionisation to drive a rich ion-molecule
chemistry (Bergin et al. 2007). However, the sensitivity of current
radio telescopes only allows observations of small samples
(Dent et al. 2005) and, in a few cases, detailed studies of individual
objects (e.g. Qi et al. 2003; Semenov et al. 2005; Qi et al. 2008). The gas temperature
in the disk surface down to continuum optical depth of ![]() 1decouples from the dust temperature and ranges from a few thousand to
a few hundred Kelvin (Jonkheid et al. 2004; Kamp & Dullemond 2004; Dullemond et al. 2007). The
hot inner disk can show ro-vibrational line emission in the near-IR
either due to fluorescence (at the disk surface) and/or thermal
excitation (e.g. Bitner et al. 2007; Bary et al. 2003; Brittain et al. 2007). More
recently, near-IR gas lines have also been detected in Spitzer IRS
spectra, revealing the presence of water, H2 and the importance of
X-rays (Lahuis et al. 2007; Salyk et al. 2008; Pascucci et al. 2007). The launch of the
Herschel satellite in 2009, opens yet another window to study the gas
component of protoplanetary disks through the dominant cooling lines
[O I], [C II] at the disk surface, as well as many
additional molecular tracers of the warmer inner disk such as water
and CO. The study of the gas in protoplanetary disks is the main topic
of the Herschel open time Key Program ``Gas in Protoplanetary
Systems'' (G ASPS, PI: Dent). Other guaranteed and open time Key
Programs, such as ``Water in Star Forming Regions with Herschel''
(W ISH, PI: van Dishoeck) and ``HIFI Spectral Surveys of Star
Forming Regions'' (PI: Ceccarelli), will also observe gas lines in a
few disks.
1decouples from the dust temperature and ranges from a few thousand to
a few hundred Kelvin (Jonkheid et al. 2004; Kamp & Dullemond 2004; Dullemond et al. 2007). The
hot inner disk can show ro-vibrational line emission in the near-IR
either due to fluorescence (at the disk surface) and/or thermal
excitation (e.g. Bitner et al. 2007; Bary et al. 2003; Brittain et al. 2007). More
recently, near-IR gas lines have also been detected in Spitzer IRS
spectra, revealing the presence of water, H2 and the importance of
X-rays (Lahuis et al. 2007; Salyk et al. 2008; Pascucci et al. 2007). The launch of the
Herschel satellite in 2009, opens yet another window to study the gas
component of protoplanetary disks through the dominant cooling lines
[O I], [C II] at the disk surface, as well as many
additional molecular tracers of the warmer inner disk such as water
and CO. The study of the gas in protoplanetary disks is the main topic
of the Herschel open time Key Program ``Gas in Protoplanetary
Systems'' (G ASPS, PI: Dent). Other guaranteed and open time Key
Programs, such as ``Water in Star Forming Regions with Herschel''
(W ISH, PI: van Dishoeck) and ``HIFI Spectral Surveys of Star
Forming Regions'' (PI: Ceccarelli), will also observe gas lines in a
few disks.
Disk structure modelling was initially driven by dust observations and
developed from a simple two-layer disk model
(e.g. Chiang & Goldreich 1997) into detailed dust continuum radiative
transfer models that are coupled with hydrostatic equilibrium
(e.g. Pinte et al. 2006; Dullemond et al. 2002; D'Alessio et al. 1998; Dullemond & Dominik 2004). The
assumption in all these models is that gas and dust are well coupled
and the hydrostatic scale height then follows from the dust
temperature. However, the gas temperature decouples from the dust
temperature and the vertical disk structure will adjust to the gas
scale height, forcing the dust to follow if it is dynamically
coupled. This approach has been followed by Nomura & Millar (2005) and
Gorti & Hollenbach (2008,2004). Nomura & Millar use a small chemical
network (only CO, C+ and O) and a limited number of heating/cooling
processes namely photoelectric heating, gas-grain collisions and line
cooling from [O I], [C II] and CO. Gorti & Hollenbach use
an extended set of reactions (84 species, ![]() 600 reactions) and
the relevant low-density heating/cooling processes drawn from photo
dissociation region (PDR) physics. Other models do not solve for the
vertical hydrostatic disk structure (e.g. Woods & Willacy 2008; Kamp & Dullemond 2004; Meijerink et al. 2008). Kamp & Dullemond use a chemical reaction
network of
600 reactions) and
the relevant low-density heating/cooling processes drawn from photo
dissociation region (PDR) physics. Other models do not solve for the
vertical hydrostatic disk structure (e.g. Woods & Willacy 2008; Kamp & Dullemond 2004; Meijerink et al. 2008). Kamp & Dullemond use a chemical reaction
network of ![]() 250 reactions among 48 species and a set of
heating/cooling processes comparable to Gorti & Hollenbach (2004). The models
of Meijerink
250 reactions among 48 species and a set of
heating/cooling processes comparable to Gorti & Hollenbach (2004). The models
of Meijerink
![]() focus entirely on the X-ray irradiation of the disk,
thus excluding UV processes; the chemical reaction network is limited
to 25 species and 125 reactions. Woods
focus entirely on the X-ray irradiation of the disk,
thus excluding UV processes; the chemical reaction network is limited
to 25 species and 125 reactions. Woods
![]() Willacy use again a
standard set of PDR heating/cooling processes, but also account for
X-rays. Their chemical network includes 475 gas and ice species
connected through
Willacy use again a
standard set of PDR heating/cooling processes, but also account for
X-rays. Their chemical network includes 475 gas and ice species
connected through ![]() 8000 gas phase and surface reactions.
8000 gas phase and surface reactions.
This paper presents a new disk code that includes additional heating/cooling processes relevant for the high densities and high temperatures present in the inner parts of the disk, resembling the conditions in tenuous atmospheres of cool stars. The models are characterised by a high degree of consistency between the various physical, chemical and radiative processes. In particular, the results of a full 2D dust continuum radiative transfer are used as input for the UV photo-processes and as radiation background for the non-LTE modelling of atoms and molecules to calculate the line heating and cooling rates. This allows the models to extend closer to the star and include modelling of the so-called inner rim.
The paper is structured as follows. Section 2 introduces the new code
P ROD IM O and presents the concept of global iterations. Section 3
describes the assumptions used to calculate the hydrostatic disk
structure including ``soft edges''. In Sect. 4, we present the 2D dust
continuum radiative transfer with scattering and band-mean
opacities. Section 5 summarises the gas-phase and photo-chemistry
dependent on the UV continuum transfer results. In Sect. 6, we outline
the heating and cooling rates included in our model and present a
modified escape-probability method. Section 7 closes the theory part
of the paper with the calculation of the sound speeds as preparation
of the next calculation the the disk structure.
We apply P ROD IM O to a standard T Tauri-type protoplanetary disk with
disk mass
![]() which extends from 0.5 AU to 500 AU in
Sect. 8. The resulting physical and chemical structure of the disk is
shown and compared to a model where we assume
which extends from 0.5 AU to 500 AU in
Sect. 8. The resulting physical and chemical structure of the disk is
shown and compared to a model where we assume
![]() .
We
conclude the paper in Sect. 9 with an outlook to future applications.
.
We
conclude the paper in Sect. 9 with an outlook to future applications.
2 ProDiMo
P ROD IM O is an acronym for Protoplanetary Disk Model. It is based on the thermo-chemical models of Inga Kamp (Kamp & Bertoldi 2000; Kamp & Dullemond 2004; Kamp & van Zadelhoff 2001), but completely re-written to be more flexible and to include more physical processes.
P ROD IM O uses global iterations to consistently calculate the physical, thermal and chemical structure of protoplanetary disks. The iterations involve 2D dust continuum radiative transfer, gas-phase and photo-chemistry, thermal energy balance of the gas, and the calculation of the hydrostatic disk structure in axial symmetry (see Fig. 1). The different components will be explained separately in the forthcoming sections.
Physical processes not yet included are X-ray heating, X-ray chemistry, spatially dependent dust properties, and PAH-chemistry. These processes will be addressed in future papers. P ROD IM O is under current development. The code can be downloaded from https://forge.roe.ac.uk/trac/ProDiMo, start at http://forge.roe.ac.uk/trac/ROEforge/wiki/NewUserForm to get a P ROD IM O user account.
| |
Figure 1: Concept of global iterations in P ROD IM O. The circular arrows on the r.h.s. indicate sub-iterations. For example, the dust temperature structure needs to be iterated in the continuum radiative transfer. |
| Open with DEXTER | |
3 Hydrostatic disk structure
We consider the hydrostatic equation of motion in axial symmetry with
rotation around the z-axis, but ![]() and
and ![]()
where vr, vz and
 |
(3) |
where
leaving the radial distribution of matter undetermined, as it is in fact mostly determined by the actual distribution of angular momentum in the disk. Consequently, the vertical component of the equation of motion (Eq. (2)) can be solved independently for every vertical column in the disk
Equation (5) is integrated from the midplane upwards by substituting the density for the pressure via
 |
(6) |
where the factor 2 is because of the lower half of the disk, which is assumed to be symmetric. In this paper, we assume a powerlaw distribution of the column density
in the main part of the disk, except for the ``soft edges'' (see Sect. 3.1), and determine
 |
(8) |
where
3.1 Soft edges
The application of a radial surface density powerlaw
(Eq. (7)) in the disk between
![]() and
and
![]() is,
although widely used, obviously quite artificial and even
unphysical. Equation (1) demonstrates that an abrupt
radial cutoff would produce an infinite force because of the radial
pressure gradient
is,
although widely used, obviously quite artificial and even
unphysical. Equation (1) demonstrates that an abrupt
radial cutoff would produce an infinite force because of the radial
pressure gradient
![]() ,
which would push gas inward
at
,
which would push gas inward
at
![]() ,
and outward at
,
and outward at
![]() ,
respectively, causing a smoothing
of the radial density structure at the boundaries.
,
respectively, causing a smoothing
of the radial density structure at the boundaries.
Let us consider an abrupt cutoff in the beginning and study the motion
of the gas as it is pushed inward due to the radial pressure gradient
at the inner boundary. Since the specific angular momentum
![]() is conserved
during this motion, the gas will spin up as it is pushed inward, until
the increased centrifugal force balances the radial pressure gradient
(+ gravity). According to Eq. (1) the force
equilibrium in this relaxed state is given by
is conserved
during this motion, the gas will spin up as it is pushed inward, until
the increased centrifugal force balances the radial pressure gradient
(+ gravity). According to Eq. (1) the force
equilibrium in this relaxed state is given by
 |
(9) |
which provides an equation for the desired density structure
![\begin{displaymath}\ln\frac{\rho(r_0)}{\rho(R_{\rm in})} ~=~
-\frac{1}{c_T^2}\...
...L_3(R_{\rm in})^2}{2r^2}
+\Phi(r)\right]^{~r_0}_{~R_{\rm in}}
\end{displaymath}](/articles/aa/full_html/2009/25/aa11821-09/img81.png)
where r0 is an arbitrary point inside
![\begin{displaymath}\Sigma(r_0) ~\approx~ \Sigma(R_{\rm in})~\exp\left(-\frac{1}{...
...^2}
+\frac{G
M_\star}{r}\right]^{~r_0}_{~R_{\rm in}}\right).
\end{displaymath}](/articles/aa/full_html/2009/25/aa11821-09/img82.png)
A similar expression can be found for the column density outside of the outer boundary. The CO observations of Hughes et al. (2008) show that such treatments can improve model fits. However, we have chosen to apply our approach for soft edges only to the inner boundary in this paper.
To summarise, if angular momentum is transported inside-out in the disk, the density structure may decrease more gradually or even increase further inward (Hartmann et al. 1998). However, it is hard to figure out any circumstances where the column density could decrease more rapidly at the inner rim as compared to Eq. (11).
4 Continuum radiative transfer
The chemistry and the heating & cooling balance of the gas in the
disk (see Sects. 5 and 6) depend on the
local continuous radiation field
![]() and the local dust
temperature
and the local dust
temperature
![]() which is a result thereof. These dependencies
include
which is a result thereof. These dependencies
include
- 1.
- thermal accommodation between gas and dust, which is usually
the dominant heating/cooling process for the gas in the midplane
(
 );
);
- 2.
- photo-ionisation and photo-dissociation of molecules, as
well as heating by absorption of UV photons, e.g. photo-electric
heating (
 );
);
- 3.
- radiative pumping of atoms and molecules by continuum
radiation which alters the non-LTE population and cooling rates,
sometimes turning cooling into heating (
 );
);
- 4.
- surface chemistry on grains, in particular the H2-formation,
and ice formation and desorption (
 ).
).
P ROD IM O solves the 2D dust continuum radiative transfer of irradiated
disks by means of a simple, ray-based, long-characteristic,
accelerated ![]() -iteration method. From each grid point in the
disk, a number of rays (typically about 100) are traced backward along
the photon propagation direction, while solving the radiative transfer
equation
-iteration method. From each grid point in the
disk, a number of rays (typically about 100) are traced backward along
the photon propagation direction, while solving the radiative transfer
equation

assuming LTE and coherent isotropic scattering
The dust grains of various sizes at a certain location in the disk are
assumed to have a unique temperature
![]() in modified radiative
equilibrium
in modified radiative
equilibrium
where the additional heating rate
4.1 Geometry of rays
Let
![]() denote a point in the disk where the mean
intensities
denote a point in the disk where the mean
intensities
![]() are to be calculated. The direction of a ray
starting from
are to be calculated. The direction of a ray
starting from ![]() is specified by a unit vector which points
in the reverse direction of the photon propagation
is specified by a unit vector which points
in the reverse direction of the photon propagation
as specified in a local coordinate system where (0,0,1) points toward the star. One ray is reserved for the solid angle occupied by the star
| |
= |  |
(16) |
| = | (17) |
where
| |
= |  |
(18) |
| = | (19) | ||
| = | (20) |
The central direction of solid angle interval d
 |
(21) |
where
4.2 Solution of the radiative transfer equation
From every grid point ![]() along each ray in direction
along each ray in direction
![]() we solve the radiative transfer equation
(Eq. (12)) backward to the photon propagation direction. The
optical depth along the ray is given by
we solve the radiative transfer equation
(Eq. (12)) backward to the photon propagation direction. The
optical depth along the ray is given by
The formal solution of the transfer equation Eq. (12) is
where
| |
= |  |
(24) |
| = |  |
(25) |
The numerical integration is carried out with analytic expressions for these integrals. The procedure is repeated for two half steps of size
At the end of each ray, the attenuated incident intensities
![]() are added according to
Eq. (23), where for the core ray the stellar intensity
are added according to
Eq. (23), where for the core ray the stellar intensity
![]() is used, and for all other rays the
interstellar intensity
is used, and for all other rays the
interstellar intensity
![]() is
applied. Non-core rays may temporarily leave the disk, but
re-enter the disk after some large distance. These ``passages'' are
treated with large, exactly calculated
is
applied. Non-core rays may temporarily leave the disk, but
re-enter the disk after some large distance. These ``passages'' are
treated with large, exactly calculated ![]() and zero opacities.
and zero opacities.
For the 2D-interpolation, it turned out to be important to use a
log-interpolation for the source function
![]() which can
change by orders of magnitude, e.g. across a shadow, within one
step. In case of linear interpolation, the numerical radiative
transfer shows much more numerical diffusion.
which can
change by orders of magnitude, e.g. across a shadow, within one
step. In case of linear interpolation, the numerical radiative
transfer shows much more numerical diffusion.
4.3 Irradiation
The radiation field in (and around) passive disks is completely determined by the stellar and interstellar irradiation, and the geometry of the dust opacity structure. Therefore, setting the irradiation as realistic as possible is of prime importance.
![\begin{figure}
\par\includegraphics[width=8.5cm,height=6cm]{1821fg02.eps}
\end{figure}](/articles/aa/full_html/2009/25/aa11821-09/img163.png) |
Figure 2:
Incident stellar intensity compiled from
two sources: a P HOENIX solar model spectrum with
|
| Open with DEXTER | |
Stellar irradiation
For the incident stellar irradiation, a model spectrum from stellar
atmosphere codes is used, e.g. a P HOENIX-model![]() . Neglecting
limb-darkening, the incident stellar intensities are related to the
surface flux at the stellar radius via
. Neglecting
limb-darkening, the incident stellar intensities are related to the
surface flux at the stellar radius via
 |
(26) |
where
Interstellar irradiation
Assuming an isotropic interstellar radiation field, all incident
intensities for non-core rays are approximated by a highly diluted
20 000 K-black-body field plus the 2.7 K-cosmic background.
| (27) |
The applied dilution factor
4.4 Iteration and dust temperature determination
In order to solve the condition of the dust radiative equilibrium
(Eq. (14) and the scattering problem, a simple ![]() -type
iteration is applied. The source functions are pre-calculated on the
grid points according to Eq. (13), with
-type
iteration is applied. The source functions are pre-calculated on the
grid points according to Eq. (13), with
![]() and
and
![]() ,
and fixed
during one iteration step. After having solved all rays from all
points for all frequencies, the mean intensities are updated as
,
and fixed
during one iteration step. After having solved all rays from all
points for all frequencies, the mean intensities are updated as
 |
(28) |
and the dust temperatures are renewed according to Eq. (14). If the maximum relative change
![\begin{figure}
\par\includegraphics[width=9.5cm]{1821fg03.eps}
\end{figure}](/articles/aa/full_html/2009/25/aa11821-09/img179.png) |
Figure 3:
Benchmark for the dust continuum radiative transfer
part. Vertical cuts of the calculated dust temperature structure
|
| Open with DEXTER | |
4.5 Spectral bands and band-mean quantities
The main purpose of the continuum radiative transfer in P ROD IM O is to
calculate certain frequency integrals, e.g. solving the
condition of radiative equilibrium for the dust grains
(Eq. (12)) or calculating the local strength of the UV
radiation field ![]() (Eq. (41)). The incident stellar
spectrum is strongly varying in frequency space, especially in the
blue and UV (see Fig. 2) and the evaluation of these
integrals, in principle, requires a large number of frequency grid
points
(Eq. (41)). The incident stellar
spectrum is strongly varying in frequency space, especially in the
blue and UV (see Fig. 2) and the evaluation of these
integrals, in principle, requires a large number of frequency grid
points ![]() ,
which is computationally expensive.
,
which is computationally expensive.
However, the incident radiation interacts with quite smooth and often completely flat dust opacities in the disk. Thus, it makes sense to ``interchange'' the order of radiative transfer and frequency integration, and to switch from a monochromatic treatment to a treatment with spectral bands.
We consider a coarse grid of frequency points
![]() (e.g.
(e.g. ![]() )
which covers the whole SED, ranging from
100 nm to
)
which covers the whole SED, ranging from
100 nm to ![]() m. Instead of
m. Instead of ![]() we consider band
means as
we consider band
means as
 |
(29) |
where
Henceforth, we exchange the index
4.6 Dust kind, abundance, size distribution, and opacities
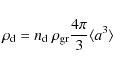
We assume a uniform dust abundance and size distribution throughout the disk.
The dust particle density is given by
 |
(33) |
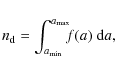
where a is the particle radius and f(a) is the dust size distribution function
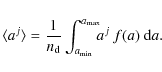 |
(34) |
The constant in the powerlaw size distribution
 |
(35) |
is given by a specified fraction of the gas mas density
The dust opacities are calculated from effective medium theory
(Bruggeman 1935) and Mie theory (M IEX from
Wolf, according to Voshchinnikov 2002). Any uniform volume
mix of solid materials with known optical constants can be used.
The dust opacities are calculated as
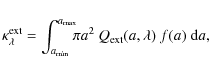
where
Table 1: Elements and chemical species.
5 Chemistry
The chemistry part of P ROD IM O is written in a modular form that makes
it possible to consider any selection of elements and chemical
species. In the models presented in this paper, we consider chemical
reactions involving
![]() elements among
elements among
![]() atomic,
ionic, molecular and ice species as listed to Table 1.
atomic,
ionic, molecular and ice species as listed to Table 1.
The rate coefficients R are mostly taken from the U MIST 2006 data compilation (Woodall et al. 2007). Among the
species listed in Table 1 we find 911 U MIST
chemical reactions, 21 of them have multiple
![]() -fits. We add
39 further reactions which
are either not included in U MIST or are treated in a more
sophisticated way, as explained in Sects. 5.2
to 5.5. Among the altogether 950 reactions, there are
74 photo reactions, 177 neutral-neutral and 299 ion-neutral reactions,
209 charge-exchange reactions, 46 cosmic ray and cosmic ray particle
induced photo reactions, and 26 three-body reactions.
The net formation rate of a chemical species i is calculated as
-fits. We add
39 further reactions which
are either not included in U MIST or are treated in a more
sophisticated way, as explained in Sects. 5.2
to 5.5. Among the altogether 950 reactions, there are
74 photo reactions, 177 neutral-neutral and 299 ion-neutral reactions,
209 charge-exchange reactions, 46 cosmic ray and cosmic ray particle
induced photo reactions, and 26 three-body reactions.
The net formation rate of a chemical species i is calculated as
where
5.1 Photo-reactions
Photon induced reaction rates can generally be written as
where
In this paper, we will apply the U MIST 2006 photo reaction rates in combination with molecular self-shielding factors from the literature instead. The application of detailed molecular UV cross sections in the calculated UV radiation field will be addressed in a future paper.
In the U MIST database, photo-rates are given as
where
Röllig et al. (2007) relate
![]() to a ``unit Draine
field'' and we will follow this idea in P ROD IM O. From the original
work by Draine (1978), Draine & Bertoldi (1996) deduced
to a ``unit Draine
field'' and we will follow this idea in P ROD IM O. From the original
work by Draine (1978), Draine & Bertoldi (1996) deduced
 |
(40) |
for the standard ISM UV radiation field
The wavelength interval boundaries have been chosen to ensure coverage of the most important photo-ionisation and photo-dissociation processes (van Dishoeck et al. 2006). Numerical integration yields
where we put
and the coefficient

where
However, in Eq. (39) we must not use AV as calculated from our choice of dust properties! Instead, we have to use the
whereas for larger disk dust, a value around 1 is more typical.
![\begin{figure}
\par\begin{tabular}{ccc}
\hspace*{-5mm}\includegraphics[width=6....
...ludegraphics[width=6.4cm]{1821fg06.eps} \end{tabular}\\ *[-3mm]
\end{figure}](/articles/aa/full_html/2009/25/aa11821-09/img248.png) |
Figure 4:
Comparison of the UV radiation field strengths |
| Open with DEXTER | |
Another complicated problem is how to apply Eq. (39) in
disk geometry. For this purpose we introduce a geometric mean
intensity as it would be present, at least approximately, if only
extinction but no scattering would occur
 |
(48) |
where
This approach to calculate the photo-rates according to Eq. (49) can be extended for molecular self-shielding factors (see Sect. 5.2) and states a compromise between the usual two-stream approximation and a proper treatment of UV line-resolved radiative transfer according to Eq. (38). The factor
5.2 Special UV photo reactions
For the photo-ionisation of neutral carbon,| |
= | (50) | |
| = |  |
(51) |
i.e. we refrain from an indirect formulation with AV in cases we have the cross sections at hand. The approximation of H2 shielding for the C ionisation is strictly valid at low temperatures only (
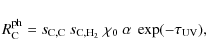
For the photo-dissociation rate of molecular hydrogen, the same
procedure applies with a H2 self-shielding factor taken from
Draine & Bertoldi (1996, see their Eq. 37). We assume
![]() (Draine & Bertoldi 1996).
(Draine & Bertoldi 1996).
 |
(53) |
with
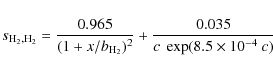
The CO photo-dissociation rate is calculated from detailed band
opacities in a similar fashion, taking into account the shielding by
molecular hydrogen and the self-shielding.
 |
(54) |
with
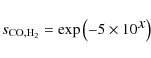
5.3 H2 formation on grains
The formation of H2 on grain surfaces
![]() is taken into account according to (Cazaux & Tielens 2002)
is taken into account according to (Cazaux & Tielens 2002)
with latest updates for the temperature-dependent efficiency
5.4 Chemistry of excited H2
13 reactions for vibrationally excited molecular hydrogen H![]() are taken into account as described in Tielens & Hollenbach (1985).
The FUV pumping rate
are taken into account as described in Tielens & Hollenbach (1985).
The FUV pumping rate
![]() is
assumed to be 10 times the H2 photo-dissociation rate. Two additional
reactions are added for the collisional excitation by
H and H2 as inverse of the de-excitation reactions
is
assumed to be 10 times the H2 photo-dissociation rate. Two additional
reactions are added for the collisional excitation by
H and H2 as inverse of the de-excitation reactions
| (56) | ||
| (57) |
where the energy of the pseudo vibrational level
5.5 Ice formation and evaporation
The formation of ice mantles on dust grains plays an important role for the chemistry in the dark and shielded midplane. At the moment, five ices are considered: CO#, CO2#, H2O#, CH4# and NH3# which are treated as additional species in the chemistry (Sects. 5 and 5.6). Apart from the adsorption and desorption reactions of these species and the H2formation on grains (Sect. 5.3) no other surface reactions are currently taken into account. In particular, we do not form water on grain surfaces.
Considering collisional adsorption, and thermal, cosmic-ray and
photo-desorption, the total formation rate of ice species i is
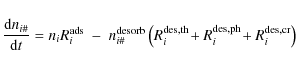 |
(58) |
where
5.5.1 Adsorption
A gas species will adsorb on grain surfaces upon collision. The
adsorption rate [s-1] is the product of the sticking coefficient
![]() ,
the total grain surface area per volume
,
the total grain surface area per volume
![]() and the thermal velocity
and the thermal velocity
![]()
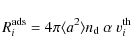 |
(59) |
where mi is the mass of gas species i. We assume unit sticking coefficient (
5.5.2 Desorption
A chemical species with internal energy greater than the energy that binds it to a grain surface will desorb. Desorption mechanisms depend on the source of the internal energy.
1. Thermal desorption: An ice species i at the surface of a grain at temperature
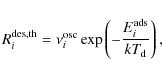
where
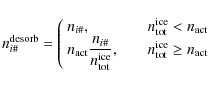 |
(61) |
where
2. Photo-desorption: Absorption of a UV photon by a surface species can increase the species internal energy enough to induce desorption. The photo-desorption rate of species i is given by
 |
(62) |
where Yi is the photo-desorption yield (see Table 2),
Table 2: Adsorption energies and photo-desorption yields.
3. Cosmic-ray induced desorption: Cosmic-rays hitting a grain can locally heat the surface and trigger desorption. Cosmic-rays can penetrate deep into obscured regions, maintaining a minimum amount of species in the gas-phase. Cosmic-ray fluxes in disks may be higher than in molecular clouds because of the stellar energetic particles in addition to the galactic component. X-ray photons can also penetrate deep inside the disk and locally heat a dust grain but X-ray induced desorption is not included in the code yet. We adopt for the cosmic-ray desorption the formalism of Hasegawa & Herbst (1993).
 |
(63) |
where
5.6 Kinetic chemical equilibrium
Assuming kinetic chemical equilibrium in the gas phase, and between gas
and ice species, we have
![]() in
Eq. (37) and obtain
in
Eq. (37) and obtain
![]() non-linear equations
for the unknown particle densities nj
non-linear equations
for the unknown particle densities nj
![]()
It is noteworthy that the electron density
 |
(65) |
where zj is the charge of species j in units of the elementary charge. The explicit dependency of
5.7 Element conservation
The system of Eqs. (37) is degenerate because every
individual chemical reaction obeys several element conservation
constraints, and therefore, certain linear combinations of ![]() can be found which cancel out, making the equation system
under-determined. Only if the element conservation is implemented in
addition, the system (Eqs. (37)) becomes well-defined.
can be found which cancel out, making the equation system
under-determined. Only if the element conservation is implemented in
addition, the system (Eqs. (37)) becomes well-defined.
Considering the total hydrogen nuclei density
![]() as given, the
conservation of element k can be written as
as given, the
conservation of element k can be written as
resulting in
Alternatively, the gas pressure p may be considered as the given
quantity and the relative element conservation can be expressed by
where
where k the Boltzmann constant. The element conservation is implemented by replacing
The global iteration, which solves the hydrostatic disk structure
consistently with the chemistry and heating & cooling balance (see
Fig. 1), is found to converge only if the chemistry
is solved for constant pressure p. Since the vertical hydrostatic
condition (Eq. (2)) is a pressure constraint, it is
essential to ensure that the chemistry solver, coupled to the
![]() -determination via heating
-determination via heating
![]() cooling balance, is not allowed
to change p as it would be the case if
cooling balance, is not allowed
to change p as it would be the case if
![]() was fixed. At given
pressure p,
was fixed. At given
pressure p,
![]() may be found to increase during the course of the
iteration, but only if simultaneously
may be found to increase during the course of the
iteration, but only if simultaneously
![]() drops, thereby conserving
the p-structure within one global iteration step.
drops, thereby conserving
the p-structure within one global iteration step.
5.8 Numerical solution of chemistry
The non-linear equation system (64), expressing the kinetic chemical equilibrium including element conservation, is usually solved by means of a self-developed, globally convergent Newton-Raphson method. A quick and reliable numerical solution of Eqs. (64) is crucial for the computational time consumption, stability, and global convergence of our model. Our numerical experience shows that a careful storage of converged results (particle densities) is the key to increase stability and performance. These particle densities are used as initial guesses for the next time the Newton-Raphson method is invoked, either in form of a downward-outward sweep through the grid (first iteration), or from the last results of the same point (following iterations).
In cases, where the solution by the Newton-Raphson method fails, we fall back to the time-dependent case and solve Eqs. (37) by means of the ODE solver L IMEX (Deuflhard & Nowak 1987) for 107 yr, which is much slower but in practice gives the same results as the Newton-Raphson method.
6 Gas thermal balance
The net gain of thermal kinetic energy is written as
where
6.1 Non-LTE treatment of atoms, ions and molecules
The most basic interaction between matter and radiation is the
absorption and emission of line photons by a gas
particle, which can be an atom, ion or molecule. We consider a
N-level system with bound-bound transitions only and calculate the
level populations
![]() by means of the statistical
equations
by means of the statistical
equations
which are solved together with the equation for the conservation of the total particle density of the considered species
where u and l label an upper and lower level, respectively.
where
6.1.1 Escape-probability treatment
| |
Figure 5: Different pumping and escape probabilities according to the predominantly radial irradiation and the predominantly vertical escape. |
| Open with DEXTER | |
The spectral intensity ![]() in Eq. (72) is
affected by line absorption and emission. Assuming that the line
source function (Eq. (74)) varies slowly in a local
environment where the line optical depths (Eq. (75))
build up rapidly, we can approximate for a static, plane-parallel medium
in Eq. (72) is
affected by line absorption and emission. Assuming that the line
source function (Eq. (74)) varies slowly in a local
environment where the line optical depths (Eq. (75))
build up rapidly, we can approximate for a static, plane-parallel medium
where
where
where the direction-dependent and the mean escape probabilities are found to be
| v |
= | 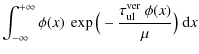 |
(78) |
| = |  |
(79) |
with dimensionless line profile function
which is known as escape-probability formalism (Avrett & Hummer 1965; Mihalas 1978).
This function is numerically fitted as
Considering the pumping probability as defined by
Eq. (77), it is noteworthy that
![]() is only valid in an almost isotropic
background radiation field. In disk symmetry, much of the pumping is
due to direct star light (see Fig. 4) which has a very
pointed character. In the optically thick midplane, the continuous
radiation field is almost isotropic, but here the pumping is
pointless, because the radiation is thermalised and the collisional
processes dominate. Considering near to far IR wavelengths at a
certain height above the midplane, the irradiation from underneath
plays a role, but these directions are just the opposite of what is
considered in Eq. (82), and so using
is only valid in an almost isotropic
background radiation field. In disk symmetry, much of the pumping is
due to direct star light (see Fig. 4) which has a very
pointed character. In the optically thick midplane, the continuous
radiation field is almost isotropic, but here the pumping is
pointless, because the radiation is thermalised and the collisional
processes dominate. Considering near to far IR wavelengths at a
certain height above the midplane, the irradiation from underneath
plays a role, but these directions are just the opposite of what is
considered in Eq. (82), and so using
![]() would be strongly misleading. Thus, we
approximate
would be strongly misleading. Thus, we
approximate
with
![\begin{figure}
\par\includegraphics[height=6.5cm,width=8cm]{1821fg08.eps}
\end{figure}](/articles/aa/full_html/2009/25/aa11821-09/img413.png) |
Figure 6:
Continuum mean intensities as input for non-LTE modelling.
The calculated band-mean mean intensities are shown for one
particular point (r,z) in a model (12 black dots) and a
cubic spline interpolation through these points (black
line). The vertical lines indicate the interval boundaries of
the 12 spectral bands. The red line shows the band-mean
incident stellar intensities
|
| Open with DEXTER | |
6.1.2 Background radiation field
The continuum background mean intensities
![]() have an
important impact on the gas energy balance. For example, in strong
continuum radiation fields, the reverse process to line cooling,
namely line absorption followed by collisional de-excitation,
dominates.
have an
important impact on the gas energy balance. For example, in strong
continuum radiation fields, the reverse process to line cooling,
namely line absorption followed by collisional de-excitation,
dominates.
![]() is identified to be just given by the
mean intensities calculated from the dust continuum radiative transfer
(see Sect. 4). In order to obtain the required
monochromatic mean continuum intensities at the line centre positions,
we apply a cubic spline interpolation to the calculated local
continuum
is identified to be just given by the
mean intensities calculated from the dust continuum radiative transfer
(see Sect. 4). In order to obtain the required
monochromatic mean continuum intensities at the line centre positions,
we apply a cubic spline interpolation to the calculated local
continuum
![]() in frequency space as depicted in
Fig. 6.
in frequency space as depicted in
Fig. 6.
6.1.3 Solving the statistical equations
Equations ((70), (75), (80)) form a system
of coupled equations for the unknown population numbers ni. Since
the line optical depths (Eq. (75)) depend partly on the
local ni, these equations must be solved iteratively. We apply a
fully implicit integration scheme for the numerical solution of
(Eq. (75)) where the line optical depth increment along the
last downward integration step, between the previous and the current
grid point, is given by the local populations, i.e.
 |
(84) |
where
6.1.4 Calculation of the heating/cooling rate
Once the statistical equations (Eqs. (70)) have been solved,
the radiative heating and cooling rates can be determined. There are
two valid approaches. For the net cooling rate, one can either
calculate the net creation rate of photon energy (radiative approach),
or one can calculate the total destruction rate of thermal energy
(collisional approach).
| |
= | (85) | |
| = | (86) | ||
| = | (87) | ||
| = | (88) |
Both approaches must yield the same net result
 |
(89) | ||
 |
(90) |
Table 3: Assumed element abundances in (gas + ice)
Table 4: Non-LTE model atoms, ions and molecules.
6.1.5 Atomic and molecular data
The atomic and molecular data for O I, C I, C II and
H2O (energy levels Ei, statistical weights gi, Einstein
coefficients
![]() ,
and collision rates
,
and collision rates
![]() are taken from
Leiden's LAMBDA-database (Schöier et al. 2005), see
Table 4. In addition to these low-temperature coolants,
we have included several ions as high-temperature coolants from the
CHIANTI-database (Dere et al. 1997): Mg II, Fe
II, Si II and S II, taking into account all energy
levels up to about 60 000 cm-1. This database has collisional
data for free electrons only, but since we consider only ions of
abundant elements here, the electron concentration is always rather
high wherever these ions are abundant. Since the electron collisional rates
are typically 104 times larger than
those of heavy particles, the thereby introduced error seems
acceptable.
are taken from
Leiden's LAMBDA-database (Schöier et al. 2005), see
Table 4. In addition to these low-temperature coolants,
we have included several ions as high-temperature coolants from the
CHIANTI-database (Dere et al. 1997): Mg II, Fe
II, Si II and S II, taking into account all energy
levels up to about 60 000 cm-1. This database has collisional
data for free electrons only, but since we consider only ions of
abundant elements here, the electron concentration is always rather
high wherever these ions are abundant. Since the electron collisional rates
are typically 104 times larger than
those of heavy particles, the thereby introduced error seems
acceptable.
For CO, we have merged level and radiative data (Ei, gi and
![]() )
of the rotational and ro-vibrational states
(
)
of the rotational and ro-vibrational states
(
![]() )
from the H ITRAN database (Rothman et al. 2005)
with collisional data among the rotational levels from the
LAMBDA database. For the vibrational collisions we use the
)
from the H ITRAN database (Rothman et al. 2005)
with collisional data among the rotational levels from the
LAMBDA database. For the vibrational collisions we use the
![]() data for H and H2 de-exciting collisions from
Neufeld & Hollenbach (1994) and for He collisions from Millikan & White (1964).
The de-exciting rate coefficients for other than
data for H and H2 de-exciting collisions from
Neufeld & Hollenbach (1994) and for He collisions from Millikan & White (1964).
The de-exciting rate coefficients for other than ![]() vibrational transitions are estimated according to the formula
provided by Elitzur (1983)
vibrational transitions are estimated according to the formula
provided by Elitzur (1983)
 |
(91) |
where
For H2, the level and radiative data (quadrupole transitions) are taken from Wolniewicz et al. (1998). We include calculated collisional excitations by H (Wrathmall et al. 2007), ortho- and para-H2, and Helium (Le Bourlot et al. 1999). The H2 and H2O ortho to para abundance ratios are assumed to be at thermal equilibrium according to the gas temperature.
6.2 Specific heating processes
Below, we list further heating processes that are not covered by Sect. 6.1. Photoelectric heating, cosmic ray ionisation, carbon photo-ionisation and H2 photo-dissociation are still radiative processes, while other heating mechanisms are of chemical nature, such as H2formation heating, or of dynamical nature, such as viscous heating.
6.2.1 Photo-electric heating
UV photons impinging on dust grains can eject electrons with
super-thermal velocities which then thermalise through collisions with
the gas. The efficiency of this process decreases strongly with grain
charge (positively charged grains are less efficient heaters). The
grain charge is set by the balance of incoming UV flux that ejects
electrons and collisional recombination. The collision rate for
recombination scales with electron density, thermal velocity and the
ratio between potential and thermal energy (
![]() ,
with
U being the grain potential). Thus the grain charge can be
parameterised by a 'so-called' grain charge parameter (Bakes & Tielens 1994)
,
with
U being the grain potential). Thus the grain charge can be
parameterised by a 'so-called' grain charge parameter (Bakes & Tielens 1994)
 |
(92) |
The probability of electron ejection after photon absorption (yield), is generally taken from experimental data on bulk material with large flat surfaces, and then applied to (smaller) astrophysical dust grains to compute the photoelectric heating rates. The heating process is thought to be less effective for micron-sized grains compared to small ISM dust grains. The reason is that a photo-electron can more easily be trapped within the matrix of a large grain, thus lowering the photoelectric yield. Experimental data on realistic astrophysical dust grains is sparse and only recently (Abbas et al. 2006) carried out experiments with sub-micron to micron sized individual dust grains. They measure yields that are larger than those of bulk flat surfaces and they find an increasing yield with increasing grain size. However, the underlying physics of these experiments are not yet well understood.
Kamp & Bertoldi (2000) provide a formula to approximate the photoelectric
heating rate for large graphite and silicate grains using the
photoelectric yields of bulk material from Feuerbacher & Fitton (1972).
For silicate grains, the photoelectric heating rate
![]() and the efficiency
and the efficiency ![]() are
are
| |
= | (93) | |
| = |  |
(94) | |
| y | = | ![$\displaystyle \left\{ \begin{array}{ll}
0.7 \hspace*{3mm} & , x \leq 10^{-4}\\ [1mm]
0.36 & , 10^{-4} < x \leq 1\\ [1mm]
0.15 & , x > 1
\end{array}\right.$](/articles/aa/full_html/2009/25/aa11821-09/img456.png) |
(95) |
valid for electron particle densities
6.2.2 PAH heating
Very small dust grains such as polycyclic aromatic hydrocarbons (PAHs)
are an extremely efficient heating source for the gas. The
photoelectric heating rate can be written separately from the rest of
the grain size distribution using only the first term of the (Bakes & Tielens 1994)
efficiency formulation
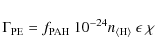 |
(96) |
where the efficiency
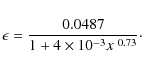 |
(97) |
In the ISM, the abundance of PAHs is
6.2.3 Carbon photo-ionisation
Ionisation of carbon releases electrons with energies around 1 eV
(Black 1987). Subsequent collisions heat the gas as
 |
(98) |
where the photo-ionisation rate
6.2.4 H2 photo-dissociation heating
Photo-dissociation of molecular hydrogen occurs via UV line
absorption into an electronically excited state followed by
spontaneous decay into an unbound state of the two hydrogen atoms. The
kinetic energy of such H-atoms is typically 0.4 eV
(Stephens & Dalgarno 1973), leading to an approximate heating rate of
 |
(99) |
Here,
6.2.5 cosmic ray heating
Cosmic rays have a typical attenuation depth of 96 g cm-2 and
thus reach much deeper than stellar FUV photons
(![]() 10-3 g cm-2, see Bergin et al. 2007, for an overview). They
ionise atomic and molecular hydrogen and this inputs approximately 3.5
and 8 eV into the gas for H and H2, respectively
(Jonkheid et al. 2004). The heating rate can then be written as
10-3 g cm-2, see Bergin et al. 2007, for an overview). They
ionise atomic and molecular hydrogen and this inputs approximately 3.5
and 8 eV into the gas for H and H2, respectively
(Jonkheid et al. 2004). The heating rate can then be written as
 |
(100) |
where
6.2.6 H2 formation heating
The formation of H2 on dust surfaces releases the
binding energy of 4.48 eV. Due to the lack of laboratory data, we
follow the approach by Black & Dalgarno (1976) and assume that this
energy is equally distributed over translation, vibration and
rotation. Hence, about 1.5 eV per reaction is liberated as heat
 |
(101) |
where the H2 formation rate
6.2.7 Heating by collisional de-excitation of H
The fluorescent excitation of H2 by UV photons
![]() produces vibrationally
excited molecular hydrogen H
produces vibrationally
excited molecular hydrogen H![]() (Tielens & Hollenbach 1985), and the
vibrational excitation energy can be converted into thermal energy by
collisions. The heating rate is
(Tielens & Hollenbach 1985), and the
vibrational excitation energy can be converted into thermal energy by
collisions. The heating rate is
where the excitation energy of the pseudo vibration level
6.2.8 Viscous heating
Due to high optical thickness, radiative heating cannot penetrate
efficiently to the midplane. These dense layers can instead also be
heated by local viscous dissipation (Frank et al. 1992)
In the absence of a well-understood mechanism, angular momentum transport is conceptualised using the kinematic - or turbulent - viscosity
| (105) |
where
6.3 Specific cooling processes
Most cooling processes are radiative in nature and covered in
Sect. 6.1. However, two prominent high temperature cooling
processes are treated in a simpler approximative fashion:
Lyman-![]() and O I-630 nm cooling.
and O I-630 nm cooling.
6.3.1 Ly- cooling
Cooling through the Lyman-![]() line becomes efficient at
temperatures of a few 1000 K (Sternberg & Dalgarno 1989). Given the
densities of atomic hydrogen
line becomes efficient at
temperatures of a few 1000 K (Sternberg & Dalgarno 1989). Given the
densities of atomic hydrogen ![]() and electrons
and electrons ![]() ,
the cooling rate can be written as
,
the cooling rate can be written as
 |
(106) |
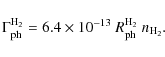
6.3.2 O I-630nm cooling
Line emission from the meta-stable 1D level of neutral oxygen
efficiently cools the gas at temperatures in excess of a few
1000 K. With ![]() denoting the neutral oxygen particle density
the cooling rate is (Sternberg & Dalgarno 1989)
denoting the neutral oxygen particle density
the cooling rate is (Sternberg & Dalgarno 1989)
 |
(107) |
6.4 Miscellaneous heating/cooling processes
We list below two additional processes that can cause either heating or cooling of the gas.
6.4.1 Thermal accommodation
Following Burke & Hollenbach (1983), the energy exchange rate by
inelastic collisions between grains and gas particles is
 |
(108) |
For gas temperatures
6.4.2 free-free heating/cooling
Free-free transitions directly convert photon energy into thermal energy (ff-heating) or vice versa (ff-cooling) during electron encounters. The heating rate| |
= | (109) | |
| = | (110) | ||
| = | (111) |
where
7 Sound speeds
After the chemistry (see Sect. 5) and the thermal gas
energy balance (see Sect. 6) have been solved
throughout the disk volume, all particle densities ni and the
kinetic temperature of the gas
![]() are known, and P ROD IM O can update
the isothermal sound speeds on the numerical grid
cT2(rj,zk)as preparation for the next iteration of the hydrostatic disk
structure (see Sect. 3).
are known, and P ROD IM O can update
the isothermal sound speeds on the numerical grid
cT2(rj,zk)as preparation for the next iteration of the hydrostatic disk
structure (see Sect. 3).
| |
= | (112) | |
| p | = | (113) | |
| cT2 | = | (114) |
![\begin{figure}
\par\begin{tabular}{cc}
gas in thermal balance & $T_{\hspace*{-0...
...ludegraphics[height=7.5cm,width=8.8cm]{1821fg10.eps} \end{tabular}
\end{figure}](/articles/aa/full_html/2009/25/aa11821-09/img507.png) |
Figure 7:
Gas temperature structure
|
| Open with DEXTER | |
![\begin{figure}
\par\begin{tabular}{cc}
gas in thermal balance & $T_{\hspace*{-0...
...height=7.5cm,width=8.8cm]{1821fg12.eps} \end{tabular}\\ *[-3mm]
\end{figure}](/articles/aa/full_html/2009/25/aa11821-09/img508.png) |
Figure 8:
Dust temperature structure
|
| Open with DEXTER | |
8 Results
We apply our P ROD IM O model to a typical passive protoplanetary disk
of mass
![]() which extends from 0.5 AU to
500 AU. The central star is assumed to be a T Tauri-type ``young
sun'' with parameters
which extends from 0.5 AU to
500 AU. The central star is assumed to be a T Tauri-type ``young
sun'' with parameters
![]() K and
K and
![]() ,
and to emit excess UV of predominantly
chromospheric origin as shown in Fig. 2. The stellar UV
excess creates an unshielded UV radiation strength of about
,
and to emit excess UV of predominantly
chromospheric origin as shown in Fig. 2. The stellar UV
excess creates an unshielded UV radiation strength of about
![]() at 1 AU (see Eq. (41)). Further
parameter of our model are summarised in
Table 5. Our selection of elements and chemical
species is outlined in Table 1, and the applied
element abundances are listed in Table 3.
at 1 AU (see Eq. (41)). Further
parameter of our model are summarised in
Table 5. Our selection of elements and chemical
species is outlined in Table 1, and the applied
element abundances are listed in Table 3.
The model uses a
![]() grid of points which are arranged
along radial and vertical rays which enables us to calculate the
respective column densities and line optical depths in a simple
way. The spatial resolution is much higher in the inner regions and
the grid points are also somewhat concentrated toward the
midplane. About half of the grid points are located inside of
2.25 AU in this model to resolve the strong gradients in the
radiation field and in the thermal and chemical structure occurring
just inside of the inner rim.
grid of points which are arranged
along radial and vertical rays which enables us to calculate the
respective column densities and line optical depths in a simple
way. The spatial resolution is much higher in the inner regions and
the grid points are also somewhat concentrated toward the
midplane. About half of the grid points are located inside of
2.25 AU in this model to resolve the strong gradients in the
radiation field and in the thermal and chemical structure occurring
just inside of the inner rim.
Table 5: Parameter of the model depicted in Figs. 7 to 14.
![\begin{figure}
\par\begin{tabular}{cc}
gas in thermal balance & $T_{\hspace*{-0...
...[height=7.5cm,width=8.8cm]{1821fg14.eps} \end{tabular}\\ *[-3mm]
\end{figure}](/articles/aa/full_html/2009/25/aa11821-09/img527.png) |
Figure 9:
Density structure
|
| Open with DEXTER | |
8.1 Disk structure
The physical structure of the disk is a consistent result of all model
components: dust radiative transfer, chemistry, and heating and cooling
balance. In order to explore how important the inclusion of the gas
heating and cooling balance is for the resulting disk structure, we
compare the full model (depicted on the l.h.s. of the following
figures) to a comparison model (r.h.s.) where we have assumed
![]() throughout the disk.
throughout the disk.
8.1.1 Thermal structure
Figures 7 and 8 show the resulting gas and
dust temperature structures of the models, respectively.
The most obvious feature in Fig. 7 is a hot surface layer
(
![]() -7000 K) which bends around the inner rim
and continues radially to about 10 AU. This hot surface layer is
situated above
-7000 K) which bends around the inner rim
and continues radially to about 10 AU. This hot surface layer is
situated above
![]() in this model. Its lower edge is not
related to the vertical AV but rather to the position of the shadow
casted by the puffed-up inner rim. It coincides with the first
occurrence of CO and other molecules like OH (see
Fig. 12). The hot surface layer is optically thin,
predominantly atomic (molecule-free) and directly heated by the stellar
radiation in various ways (see Sect. 8.1.4).
in this model. Its lower edge is not
related to the vertical AV but rather to the position of the shadow
casted by the puffed-up inner rim. It coincides with the first
occurrence of CO and other molecules like OH (see
Fig. 12). The hot surface layer is optically thin,
predominantly atomic (molecule-free) and directly heated by the stellar
radiation in various ways (see Sect. 8.1.4).
The shielded and cold regions in the midplane (
![]() )
are
characterised by small deviations between
)
are
characterised by small deviations between
![]() and
and
![]() ,
due to
effective thermal accommodation between gas and dust. However, beyond some
critical radius, here
,
due to
effective thermal accommodation between gas and dust. However, beyond some
critical radius, here ![]() 100 AU, even the midplane regions
become optically thin, and the interstellar UV irradiation causes an
increase of
100 AU, even the midplane regions
become optically thin, and the interstellar UV irradiation causes an
increase of
![]() .
We find midplane temperatures up to
.
We find midplane temperatures up to
![]() around 400 AU in this model. The critical radius
is related to
around 400 AU in this model. The critical radius
is related to ![]() and increases with disk mass.
and increases with disk mass.
The upper layers
![]() at
at
![]() AU show no clear
trend, both
AU show no clear
trend, both
![]() and
and
![]() is possible, due to a
complicated superposition of various heating and cooling processes.
is possible, due to a
complicated superposition of various heating and cooling processes.
Apart from the thermally decoupled layers at the inner rim, the
surface and the very extended layers, the disk temperature is mainly
controlled by the dust continuum radiative transfer (see
Fig. 8).
![]() shows all the features typical for
protoplanetary disks (see e.g. Pinte et al. 2009; Pascucci et al. 2004). The
midplane dust optical depth at
shows all the features typical for
protoplanetary disks (see e.g. Pinte et al. 2009; Pascucci et al. 2004). The
midplane dust optical depth at ![]() m is about
m is about
![]() in this
model. The slightly different
in this
model. The slightly different
![]() -results for the two models are
caused by the different density structures (see Fig. 9)
which depend on
-results for the two models are
caused by the different density structures (see Fig. 9)
which depend on
![]() .
In case of the full model, the vertically
extended inner regions scatter the star light and thereby heat the
disk from above.
.
In case of the full model, the vertically
extended inner regions scatter the star light and thereby heat the
disk from above.
![\begin{figure}
\par\begin{tabular}{ccc}
gas in thermal balance & $T_{\hspace*{-...
...egraphics[height=6.9cm,width=8.8cm]
{1821fg16.eps} \end{tabular}
\end{figure}](/articles/aa/full_html/2009/25/aa11821-09/img539.png) |
Figure 10:
Density structure of the puffed-up inner rim. Regions with
|
| Open with DEXTER | |
8.1.2 To flare or not to flare
Figure 9 shows the resulting density structures of both
models. The full model (l.h.s.) exhibits a remarkable vertical
extension (up to
![]() )
of both the inner rim and the
surface layers inward of
)
of both the inner rim and the
surface layers inward of
![]() AU. According to
Eq. (5), the vertical scale height H is approximately
(assuming
AU. According to
Eq. (5), the vertical scale height H is approximately
(assuming ![]() ,
,
![]() const.) given by
const.) given by
 |
(115) |
where H is defined as
It is noteworthy that the vertical density structure ![]() may be
locally inverted. Since Eq. (5) is a pressure
constraint, the density must locally re-increase if
may be
locally inverted. Since Eq. (5) is a pressure
constraint, the density must locally re-increase if
![]() drops quickly
with increasing height. This happens in the uppermost layers, in
particular around 10 AU at
drops quickly
with increasing height. This happens in the uppermost layers, in
particular around 10 AU at
![]() ,
a region which causes
the most numerical problems during the course of the global
iterations.
,
a region which causes
the most numerical problems during the course of the global
iterations.
At larger radii ![]() 30 AU, both models show a comparable vertical
extension, characterised by a generally flaring structure. The ``flaring''
(increase of H/r with increasing r) is a natural consequence of
the radial dust temperature profile varying roughly like
30 AU, both models show a comparable vertical
extension, characterised by a generally flaring structure. The ``flaring''
(increase of H/r with increasing r) is a natural consequence of
the radial dust temperature profile varying roughly like
![]() with
with
![]() in the midplane and
in the midplane and
![]() - 0.45 in the optically thin parts, so
- 0.45 in the optically thin parts, so
![]() .
.
8.1.3 The puffed-up inner rim
Figure 10 shows a magnification of the density
structure in the innermost regions. The figure demonstrates the large
impact of the treatment of the gas temperature in the model on the
resulting disk structure. There is a rapid decline of the density
between
![]() and
and
![]() ,
which is
caused by the steep
,
which is
caused by the steep
![]() -increase at given pressure at the top of the
shadow at
-increase at given pressure at the top of the
shadow at
![]() casted by the inner rim
(l.h.s.). Therefore, such densities merely exist in the model close to
the star, but the cool and dense midplane regions
casted by the inner rim
(l.h.s.). Therefore, such densities merely exist in the model close to
the star, but the cool and dense midplane regions
![]() are surrounded by an extended ``halo''
composed of thin hot atomic gas of almost constant density
(
are surrounded by an extended ``halo''
composed of thin hot atomic gas of almost constant density
(
![]() to
to
![]() )
which extends as high up as
)
which extends as high up as
![]() .
These results are astonishingly robust against
variation of the disk mass
.
These results are astonishingly robust against
variation of the disk mass
![]() between 10-4 and
between 10-4 and
![]() - we always find the same kind of halo composed
of the same kind of gas with the same densities. Only the midplane
regions contain more or less cold matter, according to
- we always find the same kind of halo composed
of the same kind of gas with the same densities. Only the midplane
regions contain more or less cold matter, according to
![]() .
.
The assumed position of the inner rim at 0.5 AU in our model implies maximum dust temperatures of about 500 K, which is well below the dust sublimation temperature, and the shape of the inner rim is controlled by the radial force equilibrium at the inner edge which implies a smooth density gradient, see Sect. 3.1. In contrast, Isella & Natta (2005) investigated the effect of pressure-dependent sublimation of refractory grains on the shape of the inner rim. In reality, different kinds of refractory grains will be present which have not only different and pressure-dependent sublimation temperatures, but the dust temperatures are strongly dependent on dust kind due to dust opacity effects (see Woitke 2006), which can be expected to result in a highly complex chemical structure of the inner rim.
In comparison, the
![]() -model does not possess the hot surface
layers and, consequently, shows a much flatter structure.
The inner rim is much less puffed-up causing the shadow
borderline to be situated deeper. The inner ``soft edge'' is likewise
less extended, only from 0.5-0.61 AU in the
-model does not possess the hot surface
layers and, consequently, shows a much flatter structure.
The inner rim is much less puffed-up causing the shadow
borderline to be situated deeper. The inner ``soft edge'' is likewise
less extended, only from 0.5-0.61 AU in the
![]() -model, whereas is extends from 0.5-0.8 AU in the
full model, or about 40% of the inner radius.
-model, whereas is extends from 0.5-0.8 AU in the
full model, or about 40% of the inner radius.
![\begin{figure}
\par\begin{tabular}{cc}
heating & cooling\\ [-1mm]
\hspace*{-8m...
...egraphics[width=10.4cm,height=11cm]{1821fg18.eps} \end{tabular}
\end{figure}](/articles/aa/full_html/2009/25/aa11821-09/img564.png) |
Figure 11:
Leading heating process (l.h.s.) and leading cooling
process (r.h.s.) of the model in gas thermal balance. The black
dashed contour line indicates an optical extinction of
|
| Open with DEXTER | |
8.1.4 Thermal balance
Figure 11 shows the most important heating processes
(l.h.s.) and the most important cooling process (r.h.s.) in the full
model of the disk with the gas being in thermal balance. Again, there
is a clear dividing line at
![]() coinciding with the shadow
of the inner rim, which separates the directly illuminated hot surface
layers from the shielded and cold midplane regions.
coinciding with the shadow
of the inner rim, which separates the directly illuminated hot surface
layers from the shielded and cold midplane regions.
The central midplane of the disk below
![]() is
dominated by thermal accommodation which assures
is
dominated by thermal accommodation which assures
![]() (see also Gorti & Hollenbach 2008; Kamp & Dullemond 2004; Nomura & Millar 2005).
Since UV photons cannot penetrate these layers, cosmic-ray ionisation
is the only remaining heating process, mostly compensated for by thermal
accommodation cooling. In the central midplane
(see also Gorti & Hollenbach 2008; Kamp & Dullemond 2004; Nomura & Millar 2005).
Since UV photons cannot penetrate these layers, cosmic-ray ionisation
is the only remaining heating process, mostly compensated for by thermal
accommodation cooling. In the central midplane
![]() AU, before
H2O freezes out (see Fig. 12), there is
additionally H2O rotational cooling, as well as some H2quadrupole and CO rotational cooling just below
AU, before
H2O freezes out (see Fig. 12), there is
additionally H2O rotational cooling, as well as some H2quadrupole and CO rotational cooling just below
![]() .
.
Between
![]() and
and
![]() ,
the UV radiation
can partly penetrate the disk via scattering from above (see
Fig. 4). This creates an active photon-dominated region
with a rich molecular chemistry, where most of the abundant molecules
like H2, CO, HCN, OH and H2O form, usually referred to as the
``intermediate warm molecular layer'' (Bergin et al. 2007). The layer is
predominantly heated by H2 formation on grain surfaces and, with
increasing height, by photo-effect on PAH molecules. The gas
temperature increases upward in this layer, e.g. from
,
the UV radiation
can partly penetrate the disk via scattering from above (see
Fig. 4). This creates an active photon-dominated region
with a rich molecular chemistry, where most of the abundant molecules
like H2, CO, HCN, OH and H2O form, usually referred to as the
``intermediate warm molecular layer'' (Bergin et al. 2007). The layer is
predominantly heated by H2 formation on grain surfaces and, with
increasing height, by photo-effect on PAH molecules. The gas
temperature increases upward in this layer, e.g. from ![]() 200 K to
200 K to
![]() 700 K at 1 AU, but the additional heating can still be
balanced by thermal accommodation in our model.
700 K at 1 AU, but the additional heating can still be
balanced by thermal accommodation in our model.
The upper edge of the warm molecular layer is characterised by a thin
zone of intensive CO ro-vibrational cooling. Above this zone, CO is
photo-dissociated - below this zone, the CO lines become optically
thick. It is this CO ro-vibrational cooling that can counterbalance
the upwards increasing UV heating for a while, until the heating
becomes too strong even for CO. This happens just at the upper end of
the disk shadow
![]() where the direct stellar
irradiation becomes dominant.
where the direct stellar
irradiation becomes dominant.
Above the CO layer, the temperature suddenly jumps to about 5000 K,
all molecules are destroyed (thermally and radiatively), and we enter
the hot surface layer described in the previous sections. This layer
is predominantly heated by collisional de-excitation of vibrationally
excited H![]() (inner regions) and by PAH heating (outer
regions). Although H2 is barely existent at these heights above the
disk (concentration is 10-4 to 10-7, see
Fig. 12), the few H2 molecules formed on grain
surfaces can easily be excited by UV fluorescence, and these
H
(inner regions) and by PAH heating (outer
regions). Although H2 is barely existent at these heights above the
disk (concentration is 10-4 to 10-7, see
Fig. 12), the few H2 molecules formed on grain
surfaces can easily be excited by UV fluorescence, and these
H![]() particles undergo de-exciting collisions. This heating is
balanced by various line cooling mechanisms. Since molecules are not
available, atoms and ions like O I and Fe II are most
effective. The non-LTE cooling by the wealth of fine-structure,
semi-forbidden and permitted Fe I and Fe II lines has been
investigated in detail by Woitke & Sedlmayr (1999), who found that in
particular the semi-forbidden iron lines provide one of the most
efficient cooling mechanisms for warm, predominantly atomic gases at
densities
particles undergo de-exciting collisions. This heating is
balanced by various line cooling mechanisms. Since molecules are not
available, atoms and ions like O I and Fe II are most
effective. The non-LTE cooling by the wealth of fine-structure,
semi-forbidden and permitted Fe I and Fe II lines has been
investigated in detail by Woitke & Sedlmayr (1999), who found that in
particular the semi-forbidden iron lines provide one of the most
efficient cooling mechanisms for warm, predominantly atomic gases at
densities
![]() to
to
![]() .
.
Since the stellar optical to IR radiation can excite most of the
Fe II levels directly, radiative heating occurs. This
``background heating by Fe II'' as referred to in
Fig. 11 (l.h.s.) turns out to contribute significantly
to the heating of the hot atomic layer close to the star
(![]() AU). In fact, further analysis shows that the gas
temperature in a large fraction of the hot atomic layer is regulated
by
AU). In fact, further analysis shows that the gas
temperature in a large fraction of the hot atomic layer is regulated
by
![]() ,
i.e. by radiative
equilibrium of the gas with respect to the Fe II line
opacity. Similarly, we find a small zone in the midplane just behind
the inner rim where radiative equilibrium with respect to the water
line opacity is established. The regulation of the gas temperature via
radiative equilibrium is a typical feature for dense gases in strong
radiation fields, e.g. in stellar atmospheres. This behaviour is rather
unusual in PDR and interstellar cloud research from where most of the
other heating and cooling processes have been adopted.
,
i.e. by radiative
equilibrium of the gas with respect to the Fe II line
opacity. Similarly, we find a small zone in the midplane just behind
the inner rim where radiative equilibrium with respect to the water
line opacity is established. The regulation of the gas temperature via
radiative equilibrium is a typical feature for dense gases in strong
radiation fields, e.g. in stellar atmospheres. This behaviour is rather
unusual in PDR and interstellar cloud research from where most of the
other heating and cooling processes have been adopted.
The more distant regions ![]() 50 AU are characterised by an
equilibrium between interstellar UV heating (photo-effect on PAHs)
and [C II]
50 AU are characterised by an
equilibrium between interstellar UV heating (photo-effect on PAHs)
and [C II] ![]() m, [O I] 63 and
m, [O I] 63 and ![]() m, CO rotational
line cooling, and thermal accommodation (e.g. Kamp & van Zadelhoff 2001).
m, CO rotational
line cooling, and thermal accommodation (e.g. Kamp & van Zadelhoff 2001).
8.2 Chemical structure
![\begin{figure}
\par\begin{tabular}{ccc}
\hspace*{-5mm}\includegraphics[width=6c...
...e*{-6mm}\includegraphics[width=6cm]{1821fg30.eps} \end{tabular}
\end{figure}](/articles/aa/full_html/2009/25/aa11821-09/img578.png) |
Figure 12:
Chemical composition of the gas in a T Tauri type
protoplanetary disk with
|
| Open with DEXTER | |
The following discussion of the chemical results focuses on aspects that are relevant for an understanding of the two-dimensional disk structure. We restrict it to the most important atomic and molecular cooling species and the species that trace the dominant carriers of the abundant elements hydrogen, carbon and oxygen throughout the disk (Fig. 12). A more detailed discussion of particular chemical aspects and their relevance to observations will be the topic of future work.
8.2.1 Atomic and molecular hydrogen
Inward of about 10 AU, the H/H2 transition occurs at the lower
boundary of the hot surface layer. There is a very sharp gradient of
UV field and gas temperature explained by the shadow casted by the dust in
the inner rim. Above the shadow, the gas temperature is high enough
to efficiently destroy molecular hydrogen via
![]() ,
and also by collisions with atomic oxygen.
,
and also by collisions with atomic oxygen.
At larger distances, H2 can form on grain surfaces as soon as the
dust temperature drops to about 100 K, where the formation efficiency
![]() increases sharply. This happens primarily in
the secondary puffed-up regions around 10 AU. The formation of
molecular hydrogen beyond this distance is mainly controlled by H2self-shielding, which is an intrinsically self-amplifying (i.e.
unstable) process. In addition, the gas density increases by a factor
of
increases sharply. This happens primarily in
the secondary puffed-up regions around 10 AU. The formation of
molecular hydrogen beyond this distance is mainly controlled by H2self-shielding, which is an intrinsically self-amplifying (i.e.
unstable) process. In addition, the gas density increases by a factor
of ![]() 2 when H2 forms at given pressure, which causes
increased collisional H2 formation rates in comparison to the
photo-dissociation rates. This H2 formation instability leads to
local overdense H2-rich regions in an otherwise atomic gas at high
altitudes at about 10 AU in our model. Other molecules like OH and
H2O are also affected and these molecules can show even larger
concentration contrasts as compared to H2 which causes the
instability.
2 when H2 forms at given pressure, which causes
increased collisional H2 formation rates in comparison to the
photo-dissociation rates. This H2 formation instability leads to
local overdense H2-rich regions in an otherwise atomic gas at high
altitudes at about 10 AU in our model. Other molecules like OH and
H2O are also affected and these molecules can show even larger
concentration contrasts as compared to H2 which causes the
instability.
8.2.2 Electron concentration and dead zone
The electron density in the upper part of the disk is set by the
balance between UV ionisations and electron recombinations of atoms
and molecules. In the UV obscured, cold and icy midplane below
![]() ,
extending radially from just behind the inner
rim to a distance of about 30 AU, the electron concentration drops to
values below 10-8, but cosmic ray ionisations maintain a minimum
electron concentration of
,
extending radially from just behind the inner
rim to a distance of about 30 AU, the electron concentration drops to
values below 10-8, but cosmic ray ionisations maintain a minimum
electron concentration of ![]() 10-10 throughout the disk, because
the vertical hydrogen column densities in this model are insufficient
to absorb the cosmic rays (
10-10 throughout the disk, because
the vertical hydrogen column densities in this model are insufficient
to absorb the cosmic rays (
![]() at
at ![]() AU). An electron concentration of
AU). An electron concentration of
![]() 10-10 is two orders of magnitude larger than the minimum
value of
10-10 is two orders of magnitude larger than the minimum
value of ![]() 10-12 required to sustain turbulence generation by
magneto-rotational instability (MRI), see Sano & Stone (2002). Thus, our
model does not possess a ``dead zone'' in the planet forming region,
which is different from studies about massive and compact, actively
accreting disks (e.g. Ilgner & Nelson 2006).
10-12 required to sustain turbulence generation by
magneto-rotational instability (MRI), see Sano & Stone (2002). Thus, our
model does not possess a ``dead zone'' in the planet forming region,
which is different from studies about massive and compact, actively
accreting disks (e.g. Ilgner & Nelson 2006).
![\begin{figure}
\par\begin{tabular}{cc}
\hspace*{-3mm}\includegraphics[width=9cm...
...ncludegraphics[width=9cm]{1821fg32.eps} \end{tabular}\\ *[-3mm]
\end{figure}](/articles/aa/full_html/2009/25/aa11821-09/img584.png) |
Figure 13:
Cooling relaxation timescale
|
| Open with DEXTER | |
8.2.3 C ,
C, O, CO, OH, and H2O
,
C, O, CO, OH, and H2O
Outside the shadowed regions, the models clearly show the classical
C+/ C / CO / CO-ice transition as expected from PDR chemistry
(e.g. Jonkheid et al. 2004; Gorti & Hollenbach 2008; Kamp & Dullemond 2004). However, there are
some important differences to note in the 1-10 AU range. The
dominant form of carbon in the midplane is CH4. At those high
densities, oxygen is locked up into H2O-ice, leaving carbon to form
methane instead of CO. Above the icy regions, in a belt up to
![]() ,
water molecules evaporate from the ice and CO
becomes again the dominant carbon and oxygen carrier.
,
water molecules evaporate from the ice and CO
becomes again the dominant carbon and oxygen carrier.
At radial distances between ![]() 0.8-10 AU in the warm
intermediate layer, the model shows a double layer with high
concentrations of neutral C, OH, H2O and other, partly organic
molecules like CO2 HCN and H2CO (not depicted). This double
layer is a result of the full 2D radiative transfer modelling in
P ROD IM O . The radial UV intensities drop quickly by orders of magnitude
at the position of the inner rim shadow (
0.8-10 AU in the warm
intermediate layer, the model shows a double layer with high
concentrations of neutral C, OH, H2O and other, partly organic
molecules like CO2 HCN and H2CO (not depicted). This double
layer is a result of the full 2D radiative transfer modelling in
P ROD IM O . The radial UV intensities drop quickly by orders of magnitude
at the position of the inner rim shadow (
![]() ). The UV
radiation field then stays about constant, until
). The UV
radiation field then stays about constant, until
![]() is
reached, and also the vertical (+ scattered) UV intensities
decrease. In combination with the downward decreasing gas temperatures
and increasing gas densities, this produces two layers of hot and cold
OH and H2O molecules with a maximum of C+ in between.
van Zadelhoff et al. (2003) have undertaken similar investigations
showing that dust scattering leads to a a deeper penetration and
redirection of the stellar UV into the vertical direction, with strong
impact on the photo-chemistry.
is
reached, and also the vertical (+ scattered) UV intensities
decrease. In combination with the downward decreasing gas temperatures
and increasing gas densities, this produces two layers of hot and cold
OH and H2O molecules with a maximum of C+ in between.
van Zadelhoff et al. (2003) have undertaken similar investigations
showing that dust scattering leads to a a deeper penetration and
redirection of the stellar UV into the vertical direction, with strong
impact on the photo-chemistry.
8.2.4 Ice formation
The ice formation is mainly a function of kind, gas density and dust temperature. Hence, the location of the individual ``ice lines'' strongly depend on the disk dust properties assumed, such as total grain surface area, disk shape and dust opacity. Water and CO2 ice formation is mostly restricted to the midplane, where the densities are in excess of 1010 cm-3, the reason being mainly the reaction pathways leading to the formation of the gaseous molecules that form these ice species. In addition, UV desorption counteracts the freeze-out of molecules in the upper layers at large distances from the star.
Inside 100 AU, densities are high enough to form water in the gas
phase which subsequently freezes out onto the cold grains
(
![]() K). This is a consequence of our stationary
chemistry that does not care about the intrinsically long timescale
for ice formation (see Fig. 13). As densities drop
and conditions for water formation in the gas phase become less
favourable, oxygen predominantly forms CO, which freezes out at dust
temperatures below
K). This is a consequence of our stationary
chemistry that does not care about the intrinsically long timescale
for ice formation (see Fig. 13). As densities drop
and conditions for water formation in the gas phase become less
favourable, oxygen predominantly forms CO, which freezes out at dust
temperatures below ![]() 25 K at large distances. There is an
intermediate density and temperature regime (20-100 AU), where
significant amounts of CO2-ice are formed.
25 K at large distances. There is an
intermediate density and temperature regime (20-100 AU), where
significant amounts of CO2-ice are formed.
8.3 Timescales
An important question is whether our assumptions of gas energy balance
and kinetic chemical equilibrium are valid in protoplanetary
disks. The cooling relaxation timescale is calculated as
 |
(116) |
where
 |
(117) |
where
Figure 13 (l.h.s.) shows that the cooling timescale
in the disk is smaller than typical evolution timescales by orders of
magnitude, and also smaller than typical mixing timescales
(e.g. Ilgner et al. 2004), justifying our assumption of thermal
balance. In particular, the gas is thermally tightly coupled to the
dust via thermal accommodation in the midplane regions where the
cooling timescale scales as
![]() .
.
The chemical relaxation timescales (r.h.s. of
Fig. 13) show that apart from the icy midplane,
where
![]() can be as large as 108 yrs, the chemical
relaxation timescale is typically 104 yrs or shorter, and as short
as
can be as large as 108 yrs, the chemical
relaxation timescale is typically 104 yrs or shorter, and as short
as ![]() 1-100 yrs in the photon-dominated warm intermediate
layer, where most spectral lines form.
1-100 yrs in the photon-dominated warm intermediate
layer, where most spectral lines form.
![\begin{figure}
\par\begin{tabular}{cc}
\hspace*{-5mm}\includegraphics[width=9cm...
...udegraphics[width=9cm]{1821fg36.eps}\\
\end{tabular}\\ *[-3mm]
\end{figure}](/articles/aa/full_html/2009/25/aa11821-09/img598.png) |
Figure 14:
Column density averaged gas temperatures
|
| Open with DEXTER | |
8.4 Gas emission lines
In order to discuss from which part of the disk the various gas emission lines come from, we provide some simple estimates of column densities and excitation temperatures in this section. Full 2D non-LTE line transfer calculations will be covered in subsequent papers.
The species column density
![]() required to achieve unit
line optical depth can be calculated from Eq. (75).
Assuming maximum and vanishing population in the lower and upper
level, respectively (
required to achieve unit
line optical depth can be calculated from Eq. (75).
Assuming maximum and vanishing population in the lower and upper
level, respectively (
![]() ,
,
![]() ),
the result for
),
the result for
![]() is
is
Table 6 shows some typical values of
Since the emission lines get saturated around
![]() ,
the
majority of the observable line flux originates in a surface region
of thickness
,
the
majority of the observable line flux originates in a surface region
of thickness
![]() .
From the
full model, we calculate the vertical species column densities
.
From the
full model, we calculate the vertical species column densities
![]() and column density averaged gas temperatures
and column density averaged gas temperatures
![]() defined as
defined as
Similar to Eq. (120), we define the column density averaged dust
temperature
![]() .
The results are
shown in Fig. 14. Treating the column above
.
The results are
shown in Fig. 14. Treating the column above
![]() as optically thin, ignoring deeper
layers for the line formation, and assuming LTE, the column density averaged
gas temperatures
as optically thin, ignoring deeper
layers for the line formation, and assuming LTE, the column density averaged
gas temperatures
![]() at depth
at depth
![]() provide an estimate of the expected
excitation temperature of the observable line flux.
provide an estimate of the expected
excitation temperature of the observable line flux.
Table 6:
Species masses in the disk and emission line characteristics.
A velocity width of
![]() km s-1 is assumed.
km s-1 is assumed.
CII: the most simple case in Fig. 14 is the 157.7
OI: the column of atomic oxygen gas responsible for the [O I] 63.2
CO: both the lowest rotational line
H2O: the situation for the rotational water lines is quite different. Large amounts of H2O only form in deep layers, typically below
Higher rotational lines are difficult to excite and the origin of such
lines is probably limited to regions ![]() AU. In particular,
the inside of the inner rim is full of water and the temperatures here
are high enough to excite a wealth of high-excitation rotational and
probably also ro-vibrational lines,
AU. In particular,
the inside of the inner rim is full of water and the temperatures here
are high enough to excite a wealth of high-excitation rotational and
probably also ro-vibrational lines,
![]() K between
K between
![]() AU and r = 0.8 AU. Another
interesting region is the vertically extended zone around 10 AU (see
Figs. 9 and 12) which contains some
amounts of hot water. We are currently investigating the impact
of this hot water layer on the rotational lines as observable with
Herschel (Woitke et al. 2009). The rotational H2O lines
probe the conditions in the midplane regions
AU and r = 0.8 AU. Another
interesting region is the vertically extended zone around 10 AU (see
Figs. 9 and 12) which contains some
amounts of hot water. We are currently investigating the impact
of this hot water layer on the rotational lines as observable with
Herschel (Woitke et al. 2009). The rotational H2O lines
probe the conditions in the midplane regions
![]() ,
the inside of the inner rim, and possibly a vertically extended region
with hot water around
,
the inside of the inner rim, and possibly a vertically extended region
with hot water around
![]() according to this model.
according to this model.
9 Conclusions and outlook
This paper introduces a new code, P ROD IM O, to model the
physical, chemical and thermal structure of protoplanetary disks. The
strength of the new code lies in a fully coupled treatment of 2D dust
continuum radiative transfer, gas phase and photo-chemistry, ice
formation, heating
![]() cooling balance, and the hydrostatic disk
structure. In particular, we use the calculated radiation field as
input for the photo-chemistry and as background continuum for the
non-LTE modelling of atoms, ions and molecules. The resulting gas
temperatures determine the vertical disk extension, which in turn
serves as input for the radiative transfer. Another advantage of the
code is the robustness of its kinetic chemistry module which is applicable to
densities between 102 to
cooling balance, and the hydrostatic disk
structure. In particular, we use the calculated radiation field as
input for the photo-chemistry and as background continuum for the
non-LTE modelling of atoms, ions and molecules. The resulting gas
temperatures determine the vertical disk extension, which in turn
serves as input for the radiative transfer. Another advantage of the
code is the robustness of its kinetic chemistry module which is applicable to
densities between 102 to
![]() ;
this makes possible
to model complete disks ranging from about
;
this makes possible
to model complete disks ranging from about ![]() 0.5 AU to 500 AU.
0.5 AU to 500 AU.
Heating and cooling: the heating
Puffed-up inner rim and atomic halo: applying the new concept of ``soft edges'' to the inner rim of a T Tauri disk, the models show a highly puffed-up inner rim extending up to
Scattering and photo-chemistry: the dust grains in the puffed-up inner rim and the halo scatter the stellar UV light back onto the disk surface, which enhances the photo-chemistry and the photo-desorption of ice at larger distances.
Chemistry: the surface regions of the model reveal the classical PDR structure for H2, H, C+, C and CO. However, due to the full 2D UV radiation transfer in P ROD IM O, a complicated multi-layered structure results for H2O and other organic molecules like CO2 and HCN, which depend sensitively on the model parameters. The UV radiation field in the intermediate warm layer is reduced in two steps, first the puffed-up inner rim blocks the direct path of the radial photons from the star, and second the vertical and scattered photons are absorbed in the deeper layers. We find in particular two layers of hot and cold water molecules. Mixing by hydrodynamical motions is likely to smooth out such structures (Tscharnuter & Gail 2007; Ilgner et al. 2004; Semenov et al. 2006).
Cooling and chemical timescales: from the calculated relaxation timescales we conclude that the assumption of gas thermal balance and kinetic chemical equilibrium should be sufficient for the interpretation of most gas emission lines, although mixing may play a role. In the midplane, the chemical timescale is as long as 108 yr due to ice formation, but the spectral lines form predominantly in higher layers where
Emission lines: disk emission lines originate mostly in the thermally decoupled surface layers, where
Observations: we intend to apply P ROD IM O to a large sample of observational disk emission line data that will be collected by the P ACS spectrometer on the HERSCHEL satellite, open time Key Program G ASPS. Based on calculated chemical and thermal disk structures, detailed non-LTE line radiative transfer calculations for the O I and C II fine-structure lines as well as some CO and H2O molecular lines will be carried out for analysis. We expect to be able to determine the gas mass in disks from the line data, and to find tracers for hot inner layers. In the next decade, P ROD IM O can be used to interpret A LMA data which probe the physical conditions and the chemical composition of the gas in the planet forming regions of protoplanetary disks.
References
- Abbas, M. M., Tankosic, D., Craven, P. D., et al. 2006, ApJ, 645, 324 [NASA ADS] [CrossRef] (In the text)
- Aikawa, Y., Miyama, S. M., Nakano, T., & Umebayashi, T. 1996, ApJ, 467, 684 [NASA ADS] [CrossRef] (In the text)
- Alexander, R. 2008, New Astron. Rev., 52, 60 [NASA ADS] [CrossRef]
- Auer, L. 1984, in Numerical Radiative Transfer, ed. W. Kalkhofen (Cambridge: Cambridge Univ. Press), 101 (In the text)
- Avrett, E. H., & Hummer, D. G. 1965, MNRAS, 130, 295 [NASA ADS]
- Bakes, E. L. O., & Tielens, A. G. G. M. 1994, ApJ, 427, 822 [NASA ADS] [CrossRef] (In the text)
- Bary, J. S., Weintraub, D. A., & Kastner, J. H. 2003, ApJ, 586, 1136 [NASA ADS] [CrossRef]
- Beckwith, S., Sargent, A. I., Scoville, N. Z., et al. 1986, ApJ, 309, 755 [NASA ADS] [CrossRef]
- Beckwith, S. V. W., Sargent, A. I., Chini, R. S., & Guesten, R. 1990, AJ, 99, 924 [NASA ADS] [CrossRef] (In the text)
- Bergin, E. A., Aikawa, Y., Blake, G. A., & van Dishoeck, E. F. 2007, in Protostars and Planets V, ed. B. Reipurth, D. Jewitt, & K. Keil, 751 (In the text)
- Bertoldi, F., & Draine, B. T. 1996, ApJ, 458, 222 [NASA ADS] [CrossRef]
- Bitner, M. A., Richter, M. J., Lacy, J. H., et al. 2007, ApJ, 661, L69 [NASA ADS] [CrossRef]
- Black, J. H. 1987, in Interstellar Processes, ed. D. J. Hollenbach, & H. A. Thronson, Jr., Astrophysics and Space Science Library, 134, 731 (In the text)
- Black, J. H., & Dalgarno, A. 1976, ApJ, 203, 132 [NASA ADS] [CrossRef] (In the text)
- Brittain, S. D., Simon, T., Najita, J. R., & Rettig, T. W. 2007, ApJ, 659, 685 [NASA ADS] [CrossRef]
- Bruggeman, D. A. G. 1935, Annalen der Physik, 416, 636 [NASA ADS] [CrossRef] (In the text)
- Burke, J. R., & Hollenbach, D. J. 1983, ApJ, 265, 223 [NASA ADS] [CrossRef] (In the text)
- Cazaux, S., & Tielens, A. G. G. M. 2002, ApJ, 575, L29 [NASA ADS] [CrossRef] (In the text)
- Chiang, E. I., & Goldreich, P. 1997, ApJ, 490, 368 [NASA ADS] [CrossRef] (In the text)
- D'Alessio, P., Canto, J., Calvet, N., & Lizano, S. 1998, ApJ, 500, 411 [NASA ADS] [CrossRef]
- Dent, W. R. F., Greaves, J. S., & Coulson, I. M. 2005, MNRAS, 359, 663 [NASA ADS] [CrossRef] (In the text)
- Dere, K. P., Landi, E., Mason, H. E., Monsignori Fossi, B. C., & Young, P. R. 1997, A&AS, 125, 149 [NASA ADS] [CrossRef] [EDP Sciences] (In the text)
- Deuflhard, P., & Nowak, U. 1987, in Large scale scientific computing, ed. P. Deuflhard, & B. Engquist, Prog. Sci. Comp. 7 (Birkhäuser), 37 (In the text)
- Dominik, C., Ceccarelli, C., Hollenbach, D., & Kaufman, M. 2005, ApJ, 635, L85 [NASA ADS] [CrossRef]
- Dorren, J. D., & Guinan, E. F. 1994, ApJ, 428, 805 [NASA ADS] [CrossRef] (In the text)
- Draine, B. T. 1978, ApJS, 36, 595 [NASA ADS] [CrossRef] (In the text)
- Draine, B. T., & Lee, H. M. 1984, ApJ, 285, 89 [NASA ADS] [CrossRef] (In the text)
- Draine, B. T., & Bertoldi, F. 1996, ApJ, 468, 269 [NASA ADS] [CrossRef] (In the text)
- Dullemond, C. P., & Dominik, C. 2004, A&A, 417, 159 [NASA ADS] [CrossRef] [EDP Sciences]
- Dullemond, C. P., van Zadelhoff, G. J., & Natta, A. 2002, A&A, 389, 464 [NASA ADS] [CrossRef] [EDP Sciences]
- Dullemond, C. P., Hollenbach, D., Kamp, I., & D'Alessio, P. 2007, in Protostars and Planets V, ed. B. Reipurth, D. Jewitt, & K. Keil, 555
- Dutrey, A., Guilloteau, S., & Guelin, M. 1997, A&A, 317, L55 [NASA ADS]
- Elitzur, M. 1983, ApJ, 266, 609 [NASA ADS] [CrossRef] (In the text)
- Feuerbacher, B., & Fitton, B. 1972, J. Appl. Phys., 43, 1563 [NASA ADS] [CrossRef] (In the text)
- Frank, J., King, A., & Raine, D. 1992, Accretion Power in Astrophysics (Cambridge University Press) (In the text)
- Gorti, U., & Hollenbach, D. 2004, ApJ, 613, 424 [NASA ADS] [CrossRef]
- Gorti, U., & Hollenbach, D. 2008, ApJ, 683, 287 [NASA ADS] [CrossRef]
- Guilloteau, S., & Dutrey, A. 1998, A&A, 339, 467 [NASA ADS]
- Haisch, Jr., K. E., Barsony, M., Ressler, M. E., & Greene, T. P. 2006, AJ, 132, 2675 [NASA ADS] [CrossRef]
- Hartmann, L., Calvet, N., Gullbring, E., & D'Alessio, P. 1998, ApJ, 495, 385 [NASA ADS] [CrossRef] (In the text)
- Hasegawa, T. I., & Herbst, E. 1993, MNRAS, 261, 83 [NASA ADS] (In the text)
- Hollenbach, D. J., Takahashi, T., & Tielens, A. G. G. M. 1991, ApJ, 377, 192 [NASA ADS] [CrossRef]
- Hughes, A. M., Wilner, D. J., Kamp, I., & Hogerheijde, M. R. 2008, ApJ, 681, 626 [NASA ADS] [CrossRef] (In the text)
- Hummer, D. G. 1988, ApJ, 327, 477 [NASA ADS] [CrossRef] (In the text)
- Ilgner, M., & Nelson, R. P. 2006, A&A, 455, 731 [NASA ADS] [CrossRef] [EDP Sciences] (In the text)
- Ilgner, M., Henning, T., Markwick, A. J., & Millar, T. J. 2004, A&A, 415, 643 [NASA ADS] [CrossRef] [EDP Sciences] (In the text)
- Isella, A., & Natta, A. 2005, A&A, 438, 899 [NASA ADS] [CrossRef] [EDP Sciences] (In the text)
- John, T. L. 1994, MNRAS, 269, 871 [NASA ADS] (In the text)
- Jonkheid, B., Faas, F. G. A., van Zadelhoff, G.-J., & van Dishoeck, E. F. 2004, A&A, 428, 511 [NASA ADS] [CrossRef] [EDP Sciences]
- Kamp, I., & Bertoldi, F. 2000, A&A, 353, 276 [NASA ADS]
- Kamp, I., & van Zadelhoff, G.-J. 2001, A&A, 373, 641 [NASA ADS] [CrossRef] [EDP Sciences]
- Kamp, I., & Dullemond, C. P. 2004, ApJ, 615, 991 [NASA ADS] [CrossRef]
- Koerner, D. W., Sargent, A. I., & Beckwith, S. V. W. 1993, Icarus, 106, 2 [NASA ADS] [CrossRef]
- Lahuis, F., van Dishoeck, E. F., Blake, G. A., et al. 2007, ApJ, 665, 492 [NASA ADS] [CrossRef]
- Le Bourlot, J., Pineau des Forêts, G., & Flower, D. R. 1999, MNRAS, 305, 802 [NASA ADS] [CrossRef] (In the text)
- Malbet, F., Lachaume, R., & Monin, J.-L. 2001, A&A, 379, 515 [NASA ADS] [CrossRef] [EDP Sciences]
- Meijerink, R., Glassgold, A. E., & Najita, J. R. 2008, ApJ, 676, 518 [NASA ADS] [CrossRef]
- Mihalas, D. 1978, Stellar atmospheres /2nd edition/ (San Francisco: W. H. Freeman and Co.), 650 (In the text)
- Millikan, R. C. & White, D. R. 1964, J. Chem. Phys., 39(4), 3209 (In the text)
- Neufeld, D. A., & Hollenbach, D. J. 1994, ApJ, 428, 170 [NASA ADS] [CrossRef] (In the text)
- Nomura, H., & Millar, T. J. 2005, A&A, 438, 923 [NASA ADS] [CrossRef] [EDP Sciences] (In the text)
- Öberg, K. I., Fuchs, G. W., Awad, Z., et al. 2007, ApJ, 662, L23 [NASA ADS] [CrossRef]
- Öberg, K. I., Linnartz, H., Visser, R., & van Dishoeck, E. F. 2008, ArXiv e-prints
- Osterbrock, D. E. 1989, Astrophysics of gaseous nebulae and active galactic nuclei (University of Minnesota, University Science Books), 422 (In the text)
- Pascucci, I., Wolf, S., Steinacker, J., et al. 2004, A&A, 417, 793 [NASA ADS] [CrossRef] [EDP Sciences]
- Pascucci, I., Hollenbach, D., Najita, J., et al. 2007, ApJ, 663, 383 [NASA ADS] [CrossRef]
- Pinte, C., Ménard, F., Duchêne, G., & Bastien, P. 2006, A&A, 459, 797 [NASA ADS] [CrossRef] [EDP Sciences]
- Pinte, C., Harries, T. J., Min, M., Watson, A., et al. 2009, A&A, accepted (In the text)
- Qi, C., Kessler, J. E., Koerner, D. W., Sargent, A. I., & Blake, G. A. 2003, ApJ, 597, 986 [NASA ADS] [CrossRef]
- Qi, C., Wilner, D. J., Aikawa, Y., Blake, G. A., & Hogerheijde, M. R. 2008, ApJ, 681, 1396 [NASA ADS] [CrossRef]
- Röllig, M., Abel, N. P., Bell, T., et al. 2007, A&A, 467, 187 [NASA ADS] [CrossRef] [EDP Sciences] (In the text)
- Rothman, L. S., Jacquemart, D., Barbe, A., et al. 2005, Journal of Quantitative Spectroscopy and Radiative Transfer, 96, 139 [NASA ADS] [CrossRef] (In the text)
- Salyk, C., Pontoppidan, K. M., Blake, G. A., et al. 2008, ApJ, 676, L49 [NASA ADS] [CrossRef]
- Sandford, S. A., & Allamandola, L. J. 1990, Icarus, 87, 188 [NASA ADS] [CrossRef]
- Sano, T., & Stone, J. M. 2002, ApJ, 577, 534 [NASA ADS] [CrossRef] (In the text)
- Schöier, F. L., van der Tak, F. F. S., van Dishoeck, E. F., & Black, J. H. 2005, A&A, 432, 369 [NASA ADS] [CrossRef] [EDP Sciences] (In the text)
- Semenov, D., Pavlyuchenkov, Y., Schreyer, K., et al. 2005, ApJ, 621, 853 [NASA ADS] [CrossRef]
- Semenov, D., Wiebe, D., & Henning, T. 2006, ApJ, 647, L57 [NASA ADS] [CrossRef]
- Shakura, N. I., & Syunyaev, R. A. 1973, A&A, 24, 337 [NASA ADS] (In the text)
- Simon, M., Dutrey, A., & Guilloteau, S. 2000, ApJ, 545, 1034 [NASA ADS] [CrossRef]
- Somerville, W. B. 1964, ApJ, 139, 192 [NASA ADS] [CrossRef] (In the text)
- Stephens, T. L., & Dalgarno, A. 1973, ApJ, 186, 165 [NASA ADS] [CrossRef] (In the text)
- Sternberg, A., & Dalgarno, A. 1989, ApJ, 338, 197 [NASA ADS] [CrossRef] (In the text)
- Stilley, J. L., & Callaway, J. 1970, ApJ, 160, 245 [NASA ADS] [CrossRef] (In the text)
- Thi, W.-F., van Zadelhoff, G.-J., & van Dishoeck, E. F. 2004, A&A, 425, 955 [NASA ADS] [CrossRef] [EDP Sciences]
- Tielens, A. G. G. M., & Hollenbach, D. 1985, ApJ, 291, 747 [NASA ADS] [CrossRef] (In the text)
- Tscharnuter, W. M., & Gail, H.-P. 2007, A&A, 463, 369 [NASA ADS] [CrossRef] [EDP Sciences]
- van Dishoeck, E. F., Jonkheid, B., & van Hemert, M. C. 2006, Faraday Discuss., 133, 231 [CrossRef] (In the text)
- van Zadelhoff, G.-J., van Dishoeck, E. F., Thi, W.-F., & Blake, G. A. 2001, A&A, 377, 566 [NASA ADS] [CrossRef] [EDP Sciences]
- van Zadelhoff, G.-J., Aikawa, Y., Hogerheijde, M. R., & van Dishoeck, E. F. 2003, A&A, 397, 789 [NASA ADS] [CrossRef] [EDP Sciences] (In the text)
- Voshchinnikov, N. 2002, Astrophys. Space Phys. Rev., 12, 1 [NASA ADS] (In the text)
- Watson, A. M., Stapelfeldt, K. R., Wood, K., & Ménard, F. 2007, in Protostars and Planets V, ed. B. Reipurth, D. Jewitt, & K. Keil, 523
- Westley, M. S., Baragiola, R. A., Johnson, R. E., & Baratta, G. A. 1995, Nature, 373, 405 [NASA ADS] [CrossRef]
- Willacy, K., & Langer, W. D. 2000, ApJ, 544, 903 [NASA ADS] [CrossRef]
- Woitke, P. 2006, A&A, 460, L9 [NASA ADS] [CrossRef] [EDP Sciences] (In the text)
- Woitke, P., & Sedlmayr, E. 1999, A&A, 347, 617 [NASA ADS] (In the text)
- Woitke, P., Dent, B., Thi, W.-F., et al. 2008 [arXiv:0809.4137]
- Woitke, P., Thi, W.-F., Kamp, I., & Hogerheijde, M. R. 2009, A&A, 501, L5 [NASA ADS] [CrossRef] [EDP Sciences] (In the text)
- Wolniewicz, L., Simbotin, I., & Dalgarno, A. 1998, ApJS, 115, 293 [NASA ADS] [CrossRef] (In the text)
- Woodall, J., Agúndez, M., Markwick-Kemper, A. J., & Millar, T. J. 2007, A&A, 466, 1197 [NASA ADS] [CrossRef] [EDP Sciences] (In the text)
- Woods, P. M., & Willacy, K. 2008 [arXiv:0812.0269]
- Wrathmall, S. A., Gusdorf, A., & Flower, D. R. 2007, MNRAS, 382, 133 [NASA ADS] [CrossRef] (In the text)
Footnotes
- ... SUPA
![[*]](/icons/foot_motif.png)
- The Scottish Universities Physics Alliance.
- ... HOENIX-model
- See ftp://ftp.hs.uni-hamburg.de/pub/outgoing/phoenix/GAIA/
- ... wrong
- For species that can be ionised with visual light like H-, it might be actually better to use our AV scale. But most photo-reactions occur in the UV and AV is just used as an auxiliary variable.
- ...(D'Alessio et al. 1998)
- Without further adjustments, the
viscous heating rate according to Eq. (104) scales as
 at given radius r. Since all known
cooling rates scale as
at given radius r. Since all known
cooling rates scale as
 in the low density
limit, there is always a critical height z above which the viscous
heating would dominate the energy balance and lead to ever increasing
in the low density
limit, there is always a critical height z above which the viscous
heating would dominate the energy balance and lead to ever increasing
 (well above 20 000 K) with increasing height z. We consider
this behaviour as an artefact of the concept of viscous heating and/or
-viscosity.
(well above 20 000 K) with increasing height z. We consider
this behaviour as an artefact of the concept of viscous heating and/or
-viscosity.
All Tables
Table 1: Elements and chemical species.
Table 2: Adsorption energies and photo-desorption yields.
Table 3: Assumed element abundances in (gas + ice)
Table 4: Non-LTE model atoms, ions and molecules.
Table 5: Parameter of the model depicted in Figs. 7 to 14.
Table 6:
Species masses in the disk and emission line characteristics.
A velocity width of
![]() km s-1 is assumed.
km s-1 is assumed.
All Figures
| |
Figure 1: Concept of global iterations in P ROD IM O. The circular arrows on the r.h.s. indicate sub-iterations. For example, the dust temperature structure needs to be iterated in the continuum radiative transfer. |
| Open with DEXTER | |
| In the text | |
| |
Figure 2:
Incident stellar intensity compiled from
two sources: a P HOENIX solar model spectrum with
|
| Open with DEXTER | |
| In the text | |
| |
Figure 3:
Benchmark for the dust continuum radiative transfer
part. Vertical cuts of the calculated dust temperature structure
|
| Open with DEXTER | |
| In the text | |
| |
Figure 4:
Comparison of the UV radiation field strengths |
| Open with DEXTER | |
| In the text | |
| |
Figure 5: Different pumping and escape probabilities according to the predominantly radial irradiation and the predominantly vertical escape. |
| Open with DEXTER | |
| In the text | |
| |
Figure 6:
Continuum mean intensities as input for non-LTE modelling.
The calculated band-mean mean intensities are shown for one
particular point (r,z) in a model (12 black dots) and a
cubic spline interpolation through these points (black
line). The vertical lines indicate the interval boundaries of
the 12 spectral bands. The red line shows the band-mean
incident stellar intensities
|
| Open with DEXTER | |
| In the text | |
| |
Figure 7:
Gas temperature structure
|
| Open with DEXTER | |
| In the text | |
| |
Figure 8:
Dust temperature structure
|
| Open with DEXTER | |
| In the text | |
| |
Figure 9:
Density structure
|
| Open with DEXTER | |
| In the text | |
| |
Figure 10:
Density structure of the puffed-up inner rim. Regions with
|
| Open with DEXTER | |
| In the text | |
| |
Figure 11:
Leading heating process (l.h.s.) and leading cooling
process (r.h.s.) of the model in gas thermal balance. The black
dashed contour line indicates an optical extinction of
|
| Open with DEXTER | |
| In the text | |
| |
Figure 12:
Chemical composition of the gas in a T Tauri type
protoplanetary disk with
|
| Open with DEXTER | |
| In the text | |
| |
Figure 13:
Cooling relaxation timescale
|
| Open with DEXTER | |
| In the text | |
| |
Figure 14:
Column density averaged gas temperatures
|
| Open with DEXTER | |
| In the text | |
Copyright ESO 2009
Current usage metrics show cumulative count of Article Views (full-text article views including HTML views, PDF and ePub downloads, according to the available data) and Abstracts Views on Vision4Press platform.
Data correspond to usage on the plateform after 2015. The current usage metrics is available 48-96 hours after online publication and is updated daily on week days.
Initial download of the metrics may take a while.