| Issue |
A&A
Volume 584, December 2015
|
|
|---|---|---|
| Article Number | L4 | |
| Number of page(s) | 5 | |
| Section | Letters | |
| DOI | https://doi.org/10.1051/0004-6361/201526981 | |
| Published online | 18 November 2015 | |
Online material
Appendix A: Comparison with HiCIAO data
Figure A.1 shows the comparison between the azimuthally averaged radial profile of the polarised surface brightness at R′ and H band. The data are normalised to the maximum value at r> 0.2′′. By fitting a Gaussian profile to the ring emission (aexp [−(x − b)2/2c2] + d), the centre of the Gaussian is at ~61.5 ± 0.3 and ~64.8 ± 0.2 AU (for 145 pc distance) for R′ and H band, respectively. The width of the Gaussian is ~8.5 ± 0.4 and ~10.6 ± 0.9 AU for R′ and H band respectively. The errors are from the χ2 minimisation and are much smaller than the spatial uncertainty from the observations (1 pixel size ~2 AU). Fitting a power-law to the brightness profile beyond the location of the peak, the emission drops as ∝ r− 2.92 ± 0.03 and ∝ r− 4.70 ± 0.06 for R′ and H band, respectively.
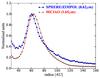 |
Fig. A.1
Comparison between the azimuthally averaged radial profile of the polarised surface brightness at R′ and H band. The data are normalised to the maximum value at r> 0.2′′. Error bars are omitted for better readability; typical values are 40% and 30% of the mean value for R′ and H band respectively. |
| Open with DEXTER | |
Appendix B: Ring shape at different azimuthal cuts
Figure B.1 shows the radial profile of the azimuthally averaged surface brightness over four bins of PA. A Gaussian profile is fitted to each case; the width and centre of the Gaussians are summarised in Table B.1. The fitting results show that there are no significant azimuthal variations of the ring within the uncertainties of the data (pixel size ~2 AU).
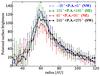 |
Fig. B.1
Radial profile of the polarised surface brightness obtained assuming four different cuts of the PA. |
| Open with DEXTER | |
© ESO, 2015
Current usage metrics show cumulative count of Article Views (full-text article views including HTML views, PDF and ePub downloads, according to the available data) and Abstracts Views on Vision4Press platform.
Data correspond to usage on the plateform after 2015. The current usage metrics is available 48-96 hours after online publication and is updated daily on week days.
Initial download of the metrics may take a while.